
| € million | ||
| 2019 | 2020 | |
| Flows - Abroad | 28,659 | -39,395 |
| Flows - In Ireland | 133,485 | 70,803 |
| Positions - Abroad - end year | 1,001,686 | 987,531 |
| Positions - In Ireland - end year | 1,079,570 | 1,097,554 |
| Positions - Net - end year | -77,884 | -110,023 |
| Net Income Flows | -69,166 | -78,026 |
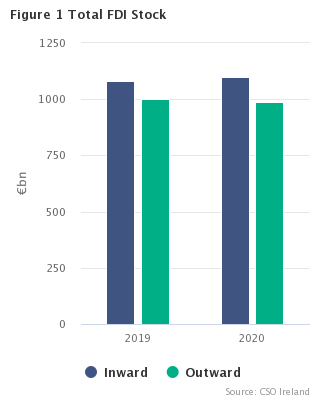
Irish stocks of direct investment abroad decreased to €988bn at the end of 2020 from a stock position of €1,002bn at the end of 2019.
The stock of direct investment abroad at the end of 2020 comprised of Equity Capital & Reinvested Earnings of €1039bn and the withdrawal of Other Capital of -€52bn. A decrease in Other Capital positions (-€46bn) was offset by an increase in Equity Capital & Reinvested Earnings (€32bn). The decrease in Other Capital positions was mostly attributable to the withdrawal of investment from Switzerland and Central American Offshore centres of €19bn and €25bn respectively. The increase in Equity Capital and Reinvested Earnings positions was attributed to increased investment in North America, €97bn which was offset by a decrease in European investment of €77bn. For the data breakdowns, see Table 3.
The stock of direct investment in Ireland increased between the end of 2019 and end of 2020 - from €1080bn to €1,098bn. Increased investment from the United States of €54bn was offset by a decrease in investment from Europe and Offshore centres of €13bn and €27bn respectively - Table 4.
Ireland had a net foreign liability of €110bn at the end of 2020, an increase of €32bn on the net foreign liability of €78bn at the end 2019.
| X-axis label | Offshore Centres | United States | Other | Netherlands | Luxembourg | Switzerland |
|---|---|---|---|---|---|---|
| 2020 | 383.132 | 240.05 | 136.885 | 133.479 | 119.313 | 84.695 |
| X-axis label | United States | Other | Ireland | Offshore Centres | United Kingdom | France |
|---|---|---|---|---|---|---|
| 2020 | 836.023 | 143.494 | 51.939 | 36.383 | 14.855 | 14.86 |
In line with International recommendations the geographic allocation of direct investment flows and stocks in Tables 1 to 9 is based on the country of location of the immediate owner of the direct investment enterprise.
An alternative presentation of the stock of direct investment in Ireland by ultimate investor displays a different geographic pattern. Figure 2 presents the value of investment stock in Ireland by location of the immediate owner (of the direct investment enterprise). Figure 3 presents the value of investment stock in Ireland by location of the ultimate investor. In 2020, the stock of investment from the US as ultimate investor at €836bn was €596bn greater than the stock of US investment presented by immediate owner (€240bn). This difference indicates that while a great deal of investment into Ireland comes directly from our European counter parts, this investment originates from enterprises located in the United States.
Investment stock from Ireland as ultimate investor at €52bn primarily represents former US-based corporate inversion enterprises which are now located in Ireland (see figure 3).
For further analysis on FDI, that explores its impact on the Irish economy with respect to employment, wages and regional breakdowns, see the FDI in Ireland publication. This research publication also contains numerous statistics based on the location of the ultimate investor, pass through FDI and Greenfield FDI.
Flows of direct investment into Ireland increased by €71bn in 2020: Equity and reinvested earnings inflows of €57bn and €64bn respectively, were offset by decreases in other capital investment of €50bn. The increase in flows of FDI into Ireland was largely attributable to investment from North America and Bermuda which increased by €46bn and €18bn in 2020 respectively. - see Table 2.
| X-axis label | North America | Offshore Centres | Luxembourg | Germany | UK | Other | Netherlands |
|---|---|---|---|---|---|---|---|
| Flows | 45.843 | 19.821 | 7.227 | 2.046 | 2.441 | -1.94800000000001 | -4.627 |
| X-axis label | Total | Europe | US |
|---|---|---|---|
| 2012 | 38.046 | 25.113 | 3.757 |
| 2013 | 38.107 | 24.443 | 9.615 |
| 2014 | 36.317 | 19.549 | 6.892 |
| 2015 | 196.363 | 79.976 | 76.457 |
| 2016 | 35.607 | 96.488 | -55.433 |
| 2017 | 46.77 | 101.238 | -53.064 |
| 2018 | -10.176 | -154.913 | 74.256 |
| 2019 | 133.485 | 67.936 | -105.339 |
| 2020 | 70.803 | 9.481 |
Please note: The Inward FDI flow for US in year 2020 is suppressed due to confidentiality requirements.
In 2015, the flow of direct investment into Ireland increased by €196bn mainly due to increased investment from Europe (€80bn) and the US (€76bn). This increase in 2015 pertains to the financing of intellectual property as well as the onshoring of other assets. In years 2019 and 2020, flows of direct investment into Ireland increased by €133bn and €71bn respectively. - see Table 2.
Direct investment abroad decreased by €39bn in 2020 – following an increase in outflows of €29bn in 2019. Reinvested earnings abroad and equity investments abroad of €16bn and €1bn were offset by a decrease in other capital investment abroad of €57bn. This decrease in other capital investment abroad was mainly with Europe (€44bn) - see Table 1.
Investment abroad by enterprises located in Ireland is primarily from the services sector – an investment position of €771bn at the end of 2020 is down €78bn compared to the position at the end of 2019 (€850bn). The stock of services sector investment into the EU was €427bn (55% of total services sector investment). Investment abroad from the manufacturing sector amounted to €187bn, up €68bn on the position at the end of 2019 (€120bn) - see table 7.
The Services Sector remains the largest sector for inward investment - at the end of 2020, the investment position was €628bn, down €15bn from the previous end of year 2019 position (€643bn). The investment position in financial intermediation increased from €218bn in 2019 to €234bn at end of 2020. Investment in administrative and support activities increased from €64bn in 2019 to €53bn in 2020. Investment in the Manufacturing Sector increased by €33bn to a stock position of €469bn in the same period - see Table 8.
| X-axis label | Manufacturing | Services |
|---|---|---|
| In Ireland | 468.609 | 627.971 |
| Abroad | 187.326 | 771.176 |
Income outflows of foreign owned direct investment enterprises were €99bn in 2020, an increase of €7bn compared with 2019. Earnings of European owned companies were €66.6bn in 2020, up €1.6bn on the 2019 figure. Income earned abroad by investors located in Ireland was €21bn in 2020 down €1.6bn from 2019. The income earned abroad was predominantly from Luxembourg (€11bn), United States (€4bn), the Netherlands and UK (€2.9bn & €2.8bn) - see Table 9.
| Table 1 Direct Investment1 Flows Abroad Classified by Location of Investment | € million | |||||||||
| Region/Country | 2019 2 | 2020 | ||||||||
| Equity | Reinvested Earnings | Other Capital | Total | Equity | Reinvested Earnings | Other Capital | Total | |||
| Europe | 89,463 | 14,789 | -86,689 | 17,564 | -123,672 | 15,653 | -44,290 | -152,308 | ||
| of which: | ||||||||||
| Belgium | 1,561 | -32 | -873 | 657 | -44 | * | * | -1,689 | ||
| France | 2,325 | 151 | -58 | 2,418 | -341 | 179 | -192 | -355 | ||
| Germany | 444 | -20 | 961 | 1,385 | -295 | -144 | 239 | -200 | ||
| Italy | -2 | -37 | 12 | -27 | -60 | -47 | 12 | -95 | ||
| Luxembourg | 85,570 | 10,359 | -37,419 | 58,510 | -124,752 | 10,452 | -3,596 | -117,896 | ||
| Netherlands | * | 4,053 | * | -32,498 | * | 2,319 | * | 5,304 | ||
| Spain | -216 | * | * | -567 | -165 | 20 | -38 | -183 | ||
| Switzerland | * | 213 | -15 | * | * | 407 | * | -21,151 | ||
| United Kingdom | 3,499 | 1,552 | 1,428 | 6,478 | * | 2,086 | * | -1,706 | ||
| EU 273 | 96,290 | 13,063 | -87,996 | 21,358 | * | 12,803 | * | -117,752 | ||
| EMU 194 | 95,356 | 13,207 | -79,348 | 29,215 | -124,483 | 12,802 | -6,980 | -118,662 | ||
| Americas | 13,346 | 2,191 | -2,590 | 12,947 | * | 3,255 | * | 117,464 | ||
| North America | 12,449 | 802 | 4,859 | 18,110 | * | 3,289 | 13,349 | * | ||
| of which: | ||||||||||
| Canada | 7 | -1 | 609 | 615 | * | 17 | * | 1,140 | ||
| United States | 12,442 | 803 | 4,250 | 17,495 | * | 3,272 | * | * | ||
| Central America | * | 1,330 | * | -5,330 | * | -47 | * | -6,781 | ||
| South America | * | 59 | * | 167 | 72 | 13 | * | * | ||
| Asia | 9,891 | * | * | 1,141 | 6,375 | * | * | -4,147 | ||
| of which: | ||||||||||
| China | * | * | -12 | * | * | * | -16 | * | ||
| Hong Kong | * | 13 | * | -75 | 5 | 18 | -30 | -8 | ||
| Japan | -28 | * | * | 32 | * | * | 24 | 84 | ||
| Africa | * | 0 | * | * | * | 16 | * | * | ||
| Oceania and Polar Regions | -25 | * | * | 3 | * | -62 | * | 310 | ||
| Not geographically allocated5 | * | 1,359 | -1,743 | * | * | * | * | * | ||
| Total | 110,305 | 13,323 | -94,969 | 28,659 | 1,195 | 16,383 | -56,973 | -39,395 | ||
| of which: | ||||||||||
| All offshore centres6 | * | 1,195 | * | -21,426 | * | 225 | * | -17,695 | ||
| 1Data are provided according to arithmetic sign conventions e.g. minus signs are used in cases where there is withdrawal of investment. | ||||||||||
| 2Revised. | ||||||||||
| 3For analytical purposes, additional details are given of transactions between residents of Ireland and residents of the EU27 area. | ||||||||||
| 4The relevant EMU countries are: Austria, Belgium, Cyprus, Estonia, Finland, France, Germany, Greece, Italy, Latvia, Lithuania, Luxembourg, Malta, Netherlands, Portugal, Slovakia, Slovenia and Spain. | ||||||||||
| 5This category covers data supplied by respondents without a geographical breakdown. | ||||||||||
| 6This category overlaps with the regions referred to above and covers Andorra, Antigua and Barbuda, Anguilla, Netherlands Antilles, Barbados, Bahrain, Bermuda, Bahamas, Belize, Cook Islands, Curacao, Dominica, Grenada, Guernsey, Gibraltar, Hong Kong, Isle of Man, Jersey, Jamaica, St. Kitts and Nevis, St Maarten, Turks and Caicos Islands, Cayman Islands, Lebanon, Saint Lucia, Liechtenstein, Liberia, Marshall Islands, Montserrat, Maldives, Nauru, Niue, Panama, Philippines, Singapore, Saint Vincent and the Grenadines, British Virgin Islands, US Virgin Islands, Vanuatu, Samoa. | ||||||||||
| *Data suppressed for confidentiality reasons. | ||||||||||
| Table 2 Direct Investment1 Flows into Ireland Classified by Location of Investor | € million | ||||||||
| Region/Country | 2019 2 | 2020 | |||||||
| Equity | Reinvested Earnings | Other Capital | Total | Equity | Reinvested Earnings | Other Capital | Total | ||
| Europe | -102,960 | 44,796 | 126,100 | 67,936 | -22,924 | 42,237 | -9,833 | 9,481 | |
| of which: | |||||||||
| Belgium | -700 | 2,388 | 533 | 2,220 | * | 1,451 | * | 427 | |
| France | 166 | 1,577 | -486 | 1,258 | -459 | 1,684 | 740 | 1,966 | |
| Germany | 790 | * | * | -4,571 | 2,030 | 899 | -883 | 2,046 | |
| Italy | 110 | 1,799 | 119 | 2,028 | -427 | 1,424 | 605 | 1,602 | |
| Luxembourg | -87,699 | 12,134 | 14,927 | -60,638 | -15,924 | 2,388 | 20,763 | 7,227 | |
| Netherlands | -5,481 | 6,307 | 111,064 | 111,889 | 17,896 | 5,821 | -28,344 | -4,627 | |
| United Kingdom | -7,486 | 2,172 | -5,262 | -10,575 | -3,767 | 23 | 6,186 | 2,441 | |
| EU 273 | -96,294 | 21,210 | 128,463 | 53,379 | 530 | 14,325 | -4,298 | 10,557 | |
| EMU 194 | -93,380 | 21,024 | 129,229 | 56,873 | 492 | 14,291 | -6,485 | 8,298 | |
| North America | -8,365 | 8,226 | -105,455 | -105,594 | 55,394 | 3,023 | -12,575 | 45,843 | |
| of which: | |||||||||
| Canada | * | * | -593 | -255 | -6 | -45 | * | * | |
| United States | * | * | -104,862 | -105,339 | 55,401 | 3,069 | * | * | |
| Central America | 121,920 | 3,250 | 52,589 | 177,759 | 17,223 | 14,281 | -18,971 | 12,533 | |
| of which: | |||||||||
| Bermuda | 97,990 | 1,914 | 48,129 | 148,032 | 18,016 | * | * | 17,755 | |
| South America | 0 | 0 | 13 | 13 | 0 | 0 | -26 | -26 | |
| of which: | |||||||||
| Brazil | 0 | 0 | 39 | 39 | 0 | 0 | -67 | -67 | |
| Asia | 73 | 3,832 | -10,915 | -7,010 | * | 4,137 | * | 12,999 | |
| of which: | |||||||||
| China | * | * | 1,292 | 1,902 | * | * | 1,059 | 1,831 | |
| Japan | * | 2,541 | * | 2,241 | * | * | 229 | * | |
| Africa | * | 11 | * | 20 | 0 | 7 | -46 | -38 | |
| Oceania and Polar Regions | * | * | 186 | 255 | * | * | -189 | 75 | |
| Not geographically allocated5 | * | * | * | 106 | 558 | * | * | -10,064 | |
| Total | 11,152 | 60,074 | 62,259 | 133,485 | 57,028 | 63,550 | -49,775 | 70,803 | |
| of which: | |||||||||
| All offshore centres6 | 123,564 | 17,648 | 52,515 | 193,727 | 7,763 | 28,905 | -16,847 | 19,821 | |
| 1Data are provided according to arithmetic sign conventions e.g. minus signs are used in cases where there is withdrawal of investment. | |||||||||
| 2Revised. | |||||||||
| 3For analytical purposes, additional details are given of transactions between residents of Ireland and residents of the EU27 area. | |||||||||
| 4The relevant EMU countries are: Austria, Belgium, Cyprus, Estonia, Finland, France, Germany, Greece, Italy, Latvia, Lithuania, Luxembourg, Malta, Netherlands, Portugal, Slovakia, Slovenia and Spain. | |||||||||
| 5This category covers data supplied by respondents without a geographical breakdown. | |||||||||
| 6This category overlaps with the regions referred to above and covers Andorra, Antigua and Barbuda, Anguilla, Netherlands Antilles, Barbados, Bahrain, Bermuda, Bahamas, Belize, Cook Islands, Curacao, Dominica, Grenada, Guernsey, Gibraltar, Hong Kong, Isle of Man, Jersey, Jamaica, St. Kitts and Nevis, St Maarten, Turks and Caicos Islands, Cayman Islands, Lebanon, Saint Lucia, Liechtenstein, Liberia, Marshall Islands, Montserrat, Maldives, Nauru, Niue, Panama, Philippines, Singapore, Saint Vincent and the Grenadines, British Virgin Islands, US Virgin Islands, Vanuatu, Samoa. | |||||||||
| *Data suppressed for confidentiality reasons. | |||||||||
| Table 3 Direct Investment1 Abroad End Year Positions Classified by Location of Investment | € million | |||||||
| Region/Country | 2019 2 | 2020 | ||||||
| Equity Capital & Reinvested Earnings | Other Capital | Total | Equity Capital & Reinvested Earnings | Other Capital | Total | |||
| Europe | 700,458 | 18,015 | 718,472 | 623,615 | -22,147 | 601,468 | ||
| of which: | ||||||||
| France | 3,549 | 578 | 4,127 | 2,844 | 45 | 2,888 | ||
| Germany | 2,681 | 6 | 2,687 | 2,671 | 292 | 2,963 | ||
| Italy | 2,418 | -762 | 1,655 | 2,412 | -695 | 1,717 | ||
| Luxembourg | 455,785 | 8,832 | 464,618 | 366,175 | 4,135 | 370,310 | ||
| Netherlands | 56,511 | 5,220 | 61,732 | 54,141 | 4,233 | 58,375 | ||
| Switzerland | 24,020 | -12,082 | 11,939 | 5,165 | -31,472 | -26,307 | ||
| United Kingdom | 79,901 | 15,882 | 95,784 | 89,530 | 5,043 | 94,573 | ||
| Offshore centres | * | * | 32,340 | * | * | 55,974 | ||
| EU 273 | 560,612 | 14,165 | 574,777 | 469,915 | 3,829 | 473,744 | ||
| EMU 194 | 550,760 | 14,663 | 565,423 | 459,458 | 5,045 | 464,503 | ||
| Americas | * | * | 164,971 | 279,932 | -31,721 | 248,211 | ||
| North America | 115,295 | -18,299 | 96,996 | 212,384 | -5,651 | 206,732 | ||
| of which: | ||||||||
| Canada | * | * | 2,950 | 2,873 | 399 | 3,272 | ||
| United States | * | * | 94,046 | 209,511 | -6,051 | 203,461 | ||
| Central America | * | * | 66,837 | * | * | 40,477 | ||
| of which: | ||||||||
| Offshore centres | 67,030 | -977 | 66,053 | 66,088 | -26,324 | 39,765 | ||
| South America | * | * | 1,138 | * | * | 1,002 | ||
| Asia | 70,940 | -1,787 | 69,154 | 70,982 | -11,664 | 59,318 | ||
| Africa | * | * | 63 | * | * | 466 | ||
| Oceania and Polar Regions | 2,126 | -481 | 1,645 | 3,346 | 161 | 3,507 | ||
| Not geographically allocated5 | * | * | 47,381 | * | * | 74,560 | ||
| Total | 1,007,550 | -5,864 | 1,001,686 | 1,039,429 | -51,897 | 987,531 | ||
| of which: | ||||||||
| All offshore centres6 | * | * | 152,106 | * | * | 146,930 | ||
| 1The sign convention used is: for year-end positions 'Abroad', an entry without sign indicates a net asset position, while a minus sign indicates a net liability position. | ||||||||
| 2Revised. | ||||||||
| 3For analytical purposes, additional details are given of transactions between residents of Ireland and residents of the EU27 area. | ||||||||
| 4The relevant EMU countries are: Austria, Belgium, Cyprus, Estonia, Finland, France, Germany, Greece, Italy, Latvia, Lithuania, Luxembourg, Malta, Netherlands, Portugal, Slovakia, Slovenia and Spain. | ||||||||
| 5This category covers data supplied by respondents without a geographical breakdown. | ||||||||
| 6This category overlaps with the regions referred to above and covers Andorra, Antigua and Barbuda, Anguilla, Netherlands Antilles, Barbados, Bahrain, Bermuda, Bahamas, Belize, Cook Islands, Curacao, Dominica, Grenada, Guernsey, Gibraltar, Hong Kong, Isle of Man, Jersey, Jamaica, St. Kitts and Nevis, St Maarten, Turks and Caicos Islands, Cayman Islands, Lebanon, Saint Lucia, Liechtenstein, Liberia, Marshall Islands, Montserrat, Maldives, Nauru, Niue, Panama, Philippines, Singapore, Saint Vincent and the Grenadines, British Virgin Islands, US Virgin Islands, Vanuatu, Samoa. | ||||||||
| *Data suppressed for confidentiality reasons. | ||||||||
| Table 4 Direct Investment1 in Ireland End Year Positions Classified by Location of Investor | € million | |||||||
| Region/Country | 2019 2 | 2020 | ||||||
| Equity Capital & Reinvested Earnings | Other Capital | Total | Equity Capital & Reinvested Earnings | Other Capital | Total | |||
| Europe | 554,073 | 7,508 | 561,581 | 549,242 | -420 | 548,822 | ||
| of which: | ||||||||
| Belgium | 5,542 | -20,091 | -14,549 | 3,873 | -19,845 | -15,972 | ||
| France | 21,457 | 483 | 21,940 | 21,206 | 1,278 | 22,484 | ||
| Germany | 10,533 | -4,260 | 6,273 | 12,631 | -5,025 | 7,606 | ||
| Italy | 8,774 | 707 | 9,481 | 8,744 | 1,185 | 9,929 | ||
| Luxembourg | 122,600 | -10,209 | 112,391 | 109,361 | 9,952 | 119,313 | ||
| Netherlands | 74,530 | 61,930 | 136,461 | 97,921 | 35,558 | 133,479 | ||
| Spain | * | * | 13,419 | * | * | 9,694 | ||
| Switzerland | 110,441 | -13,224 | 97,217 | 106,486 | -21,791 | 84,695 | ||
| United Kingdom | 58,417 | -20,774 | 37,643 | 51,168 | -13,600 | 37,568 | ||
| Offshore centres | * | * | 131,634 | * | * | * | ||
| EU 273 | 260,998 | 30,578 | 291,576 | 271,040 | 24,032 | 295,072 | ||
| EMU 194 | 258,124 | 33,430 | 291,555 | 268,067 | 24,502 | 292,568 | ||
| North America | 125,364 | 59,797 | 185,160 | 206,409 | 35,612 | 242,022 | ||
| of which: | ||||||||
| Canada | * | * | -840 | 1,438 | 533 | 1,971 | ||
| United States | * | * | 186,000 | 204,971 | 35,079 | 240,050 | ||
| Central America | 197,458 | 79,177 | 276,636 | 193,180 | 57,450 | 250,630 | ||
| of which: | ||||||||
| Offshore centres | 197,458 | 79,345 | 276,804 | 193,180 | 57,520 | 250,700 | ||
| South America | 0 | -322 | -322 | 0 | -263 | -263 | ||
| of which: | ||||||||
| Brazil | 0 | -226 | -226 | 0 | -227 | -227 | ||
| Asia | 45,916 | -3,126 | 42,790 | 48,035 | 378 | 48,413 | ||
| of which: | ||||||||
| China | * | * | 8,120 | * | * | 8,283 | ||
| Japan | * | 162 | * | * | 415 | * | ||
| Singapore | 405 | -1,290 | -885 | 336 | 824 | 1,159 | ||
| Offshore centres5 | 2,016 | -428 | 1,588 | 1,953 | 2,070 | 4,023 | ||
| Africa | 284 | -126 | 158 | 269 | -167 | 102 | ||
| Oceania and Polar Regions | * | * | 639 | * | * | 704 | ||
| Not geographically allocated6 | * | * | 12,928 | * | * | 7,124 | ||
| Total | 922,276 | 157,294 | 1,079,570 | 997,095 | 100,459 | 1,097,554 | ||
| of which: | ||||||||
| All offshore centres7 | 319,773 | 90,326 | 410,099 | 311,912 | 71,221 | 383,132 | ||
| 1The sign convention used is: for year-end positions 'Abroad', an entry without sign indicates a net liability position, while a minus sign indicates a net asset position. | ||||||||
| 2Revised. | ||||||||
| 3For analytical purposes, additional details are given of transactions between residents of Ireland and residents of the EU27 area. | ||||||||
| 4The relevant EMU countries are: Austria, Belgium, Cyprus, Estonia, Finland, France, Germany, Greece, Italy, Latvia, Lithuania, Luxembourg, Malta, Netherlands, Portugal, Slovakia, Slovenia and Spain. | ||||||||
| 5This category overlaps with some of the regions referred to above. | ||||||||
| 6This category covers data supplied by respondents without a geographical breakdown. | ||||||||
| 7This category overlaps with the regions referred to above and covers Andorra, Antigua and Barbuda, Anguilla, Netherlands Antilles, Barbados, Bahrain, Bermuda, Bahamas, Belize, Cook Islands, Curacao, Dominica, Grenada, Guernsey, Gibraltar, Hong Kong, Isle of Man, Jersey, Jamaica, St. Kitts and Nevis, Cayman Islands, Lebanon, Saint Lucia, Liechtenstein, Liberia, Marshall Islands, Montserrat, Maldives, Nauru, Niue, Panama, Philippines, Singapore, St MaartenTurks and Caicos Islands, Saint Vincent and the Grenadines, British Virgin Islands, US Virgin Islands, Vanuatu, Samoa. | ||||||||
| *Data suppressed for confidentiality reasons. | ||||||||
| Table 5 Direct Investment1 Flows Abroad Classified by Activity2 of Resident Investor | € million | ||||||||
| Sector | NACE 2 | 2019 3 | 2020 | ||||||
| Total | of which: | Total | of which: | ||||||
| Section & Division | EU 274 | EMU 195 | EU 274 | EMU 195 | |||||
| All Industries | 28,659 | 21,358 | 29,215 | -39,395 | -117,752 | -118,662 | |||
| of which: | |||||||||
| Agriculture, Forestry and Fishing; Mining and Quarrying; Construction | A, B & F | * | * | * | * | * | * | ||
| Total Manufacturing Sector | C | 2,388 | -8,557 | -8,585 | -34,349 | * | * | ||
| Food, beverages and tobacco products | 10, 11 & 12 | 3,358 | * | 699 | * | * | * | ||
| Textiles and wood | 13, 14 & 16 - 18 | * | * | * | * | * | * | ||
| Basic pharmaceutical products and preparations | 21 | 993 | * | * | * | * | * | ||
| Other manufacturing n.e.s. | * | -351 | -420 | -13,072 | 1,065 | 88 | |||
| Electricity, Gas, Steam and Air Conditioning supply | D | * | * | * | * | 0 | * | ||
| Total Services Sector | 45 - 99 | 24,907 | 30,038 | 37,919 | -3,022 | -14,503 | -14,503 | ||
| Wholesale and retail trade; Repairs of motor vehicles | G | -614 | 469 | 467 | -1,095 | * | * | ||
| Transportation and storage | H | * | * | * | * | 0 | 0 | ||
| Information and communication | J | * | * | * | 3,494 | * | * | ||
| Financial and insurance activities | K | 2,753 | 1,550 | 1,496 | -3,034 | 4,176 | 4,338 | ||
| of which: | |||||||||
| Activities of holding companies | 64.2 | 673 | 568 | 558 | 2,568 | 2,939 | 2,928 | ||
| Other service activities6 | 50740 | 57,328 | 65,254 | * | * | -18,484 | |||
| 1Data are provided according to arithmetic sign conventions e.g. minus signs are used in cases where there is withdrawal of investment. | |||||||||
| 2The activity classification used in this release is the NACE Rev. 2 classification. | |||||||||
| 3Revised. | |||||||||
| 4For analytical purposes, additional details are given of transactions between residents of Ireland and residents of the EU27 area. | |||||||||
| 5The relevant EMU countries are: Austria, Belgium, Cyprus, Estonia, Finland, France, Germany, Greece, Italy, Latvia, Lithuania, Luxembourg, Malta, Netherlands, Portugal, Slovakia, Slovenia and Spain. | |||||||||
| 6This covers residual FDI service activity. | |||||||||
| *Data suppressed for confidentiality reasons. | |||||||||
| Table 6 Direct Investment1 Flows into Ireland Classified by Activity2 of Resident Enterprise | € million | ||||||||||||||
| Sector | NACE 2 | 2019 3 | 2020 | ||||||||||||
| Total | of which: | Total | of which: | ||||||||||||
| Section & Division | United States | Japan | EU 274 | EMU 195 | Offshore Centres | United States | Japan | EU 274 | EMU 195 | Offshore Centres | |||||
| All Industries | 133,485 | -105,339 | 2,241 | 53,379 | 56,873 | 193,727 | 70,803 | 42,617 | * | 10,557 | 8,299 | 19,821 | |||
| Agriculture, Forestry and Fishing; Mining and Quarrying; Construction | A, B & F | * | * | 0 | * | * | 0 | * | * | 0 | * | * | 0 | ||
| Total Manufacturing Sector | C | 53,054 | -56,414 | -317 | 50,279 | 50,405 | 79,075 | 44,412 | 5,238 | -223 | 24,419 | 23,690 | 20,424 | ||
| Food, beverages and tobacco products | 10, 11 & 12 | 9,461 | * | 0 | * | * | * | -793 | * | 0 | * | * | * | ||
| Textiles and wood | 13, 14 & 16 - 18 | * | -1 | 0 | 1 | -1 | 1 | * | 0 | 0 | 0 | 0 | 0 | ||
| Basic pharmaceutical products and preparations | 21 | 40,841 | -2,786 | -46 | 7,012 | 7,070 | 35,679 | 80,812 | * | -24 | 27,026 | 26,867 | 11,309 | ||
| Other manufacturing n.e.s. | * | * | -271 | * | * | * | * | * | -199 | * | * | * | |||
| Electricity, Gas, Steam and Air Conditioning supply | D | * | * | 0 | * | * | 0 | * | * | 0 | * | * | 0 | ||
| Total Services Sector | 45 - 99 | 80,413 | -48,933 | 2,558 | 3,020 | 6,406 | 114,652 | 26,342 | 37,371 | * | -13,873 | -15,434 | -603 | ||
| Wholesale and retail trade; Repairs of motor vehicles | G | 4,778 | 120 | * | -2,906 | -2,816 | * | -2,540 | -1,012 | * | -1,068 | -1,214 | 78 | ||
| Transportation and storage | H | * | -1 | 0 | * | * | * | * | 0 | 0 | * | * | 0 | ||
| Information and communication | J | 27,212 | 4,091 | * | -107,910 | -107,978 | 130,996 | 51,839 | 51,755 | 18 | 1,227 | 1,066 | -2,180 | ||
| Financial intermediation | 64 | 9,951 | -49,103 | -4 | 73,223 | 76,659 | * | -3,802 | -15,649 | 322 | -4,881 | -6,469 | 814 | ||
| of which: | |||||||||||||||
| Activities of holding companies | 64.2 | -2,506 | * | 0 | * | * | -36 | 35 | 236 | 0 | -159 | -160 | -366 | ||
| Insurance, reinsurance and pension funding | 65 | 4,824 | -16 | * | 1,417 | 1,355 | 1,155 | 2,159 | 89 | * | 3,020 | 3,287 | 503 | ||
| Other financial activities | 66 | 771 | * | * | 335 | 333 | * | 1,309 | * | * | 1,265 | 1,265 | * | ||
| Other services activities6 | * | * | 2,535 | * | * | -5,872 | * | * | 9,277 | * | * | * | |||
| 1Data are provided according to arithmetic sign conventions. e.g. minus signs are used in cases where there is withdrawal of investment. | |||||||||||||||
| 2The activity classification used in this release is the NACE Rev. 2 classification. | |||||||||||||||
| 3Revised. | |||||||||||||||
| 4For analytical purposes, additional details are given of transactions between residents of Ireland and residents of the EU27 area. | |||||||||||||||
| 5The relevant EMU countries are: Austria, Belgium, Cyprus, Estonia, Finland, France, Germany, Greece, Italy, Latvia, Lithuania, Luxembourg, Malta, Netherlands, Portugal, Slovakia, Slovenia and Spain. | |||||||||||||||
| 6This covers residual FDI service activity. | |||||||||||||||
| *Data suppressed for confidentiality reasons. | |||||||||||||||
| Table 7 Direct Investment1 Abroad End Year Positions Classified by Activity2 of Resident Investor | € million | ||||||||
| Sector | NACE 2 | 2019 3 | 2020 | ||||||
| Total | of which: | Total | of which: | ||||||
| Section & Division | EU 274 | EMU 195 | EU 274 | EMU 195 | |||||
| All Industries | 1,001,686 | 574,777 | 565,423 | 987,531 | 473,744 | 464,503 | |||
| of which: | |||||||||
| Agriculture, Forestry and Fishing; Mining and Quarrying; Construction | A, B & F | * | * | * | * | * | * | ||
| Total Manufacturing Sector | C | 119,635 | 29,924 | 29,275 | 187,326 | 38,142 | 36,656 | ||
| Food, beverages and tobacco products | 10, 11 & 12 | * | * | * | * | * | * | ||
| Textiles and wood | 13, 14 & 16 - 18 | * | * | * | * | * | * | ||
| Basic pharmaceutical products and preparations | 21 | * | * | -1,994 | 65,199 | 2,740 | 2,661 | ||
| Other manufacturing n.e.s. | 68,395 | 10,483 | 9,884 | 70,228 | 12,502 | 10,982 | |||
| Electricity, Gas, Steam and Air Conditioning supply | D | * | * | * | * | * | * | ||
| Total Services Sector | 45 - 99 | 849,493 | 534,217 | 525,511 | 771,176 | 426,900 | 419,146 | ||
| Wholesale and retail trade; Repairs of motor vehicles | G | 10,574 | 3,639 | 3,366 | 9,575 | 3,094 | 2,800 | ||
| Transportation and storage | H | * | * | * | * | * | * | ||
| Information and communication | J | * | * | 2,456 | * | * | 2,258 | ||
| Financial and insurance activities | K | 102,196 | 26,511 | 25,091 | 113,909 | 51,922 | 50,709 | ||
| of which: | |||||||||
| Activities of holding companies | 64.2 | 32,161 | * | * | 37,589 | 30,980 | 30,844 | ||
| Other service activities6 | 689,182 | * | * | 577,161 | * | * | |||
| 1The sign convention used is: for year-end positions 'Abroad', an entry without sign indicates a net asset position, while a minus sign indicates a net liability position. | |||||||||
| 2The activity classification used in this release is the NACE Rev. 2 classification. | |||||||||
| 3Revised. | |||||||||
| 4For analytical purposes, additional details are given of transactions between residents of Ireland and residents of the EU27 area. | |||||||||
| 5The relevant EMU countries are: Austria, Belgium, Cyprus, Estonia, Finland, France, Germany, Greece, Italy, Latvia, Lithuania, Luxembourg, Malta, Netherlands, Portugal, Slovakia, Slovenia and Spain. | |||||||||
| 6This covers residual FDI service activity. | |||||||||
| *Data suppressed for confidentiality reasons. | |||||||||
| Table 8 Direct Investment1 in Ireland End Year Positions Classified by Activity2 of Resident Enterprise | € million | ||||||||||||||
| Sector | NACE 2 | 2019 3 | 2020 | ||||||||||||
| Total | of which: | Total | of which: | ||||||||||||
| Section & Division | United States | Japan | EU 274 | EMU 195 | Offshore Centres | United States | Japan | EU 274 | EMU 195 | Offshore Centres | |||||
| All Industries | 1,079,570 | 186,000 | * | 291,576 | 291,555 | 410,099 | 1,097,554 | 240,050 | * | 295,072 | 292,568 | 383,132 | |||
| Agriculture, Forestry and Fishing | A | * | * | 0 | * | * | 0 | * | * | 0 | * | * | 0 | ||
| Mining and Quarrying; Construction | B | * | 0 | * | * | 0 | 0 | * | 0 | 0 | * | 0 | 0 | ||
| Total Manufacturing | C | 435,376 | 53,416 | -300 | 87,867 | 88,156 | 236,496 | 468,609 | 73,209 | -436 | 124,096 | 123,628 | 222,121 | ||
| Food, beverages and tobacco products | 10, 11 & 12 | * | * | 0 | * | * | * | * | * | * | * | * | * | ||
| Textiles and wood | 13, 14 & 16 - 18 | * | 0 | 0 | 0 | * | 0 | * | 0 | 0 | 0 | 0 | * | ||
| Basic pharmaceutical products and preparations | 21 | 138,575 | 6,284 | 348 | 26,154 | 26,109 | 45,997 | 224,883 | 66,977 | 347 | 69,448 | 69,208 | 30,569 | ||
| Metal and mechanical products | 24, 25, 26 & 28 | * | * | * | * | * | 111,665 | * | * | * | * | * | * | ||
| Other manufacturing | * | 3,275 | * | 45,659 | * | * | 43,461 | 223 | -279 | 37,778 | 37,742 | 708 | |||
| Electricity, Gas, Steam and Air Conditioning supply | D | * | * | * | * | * | 0 | * | * | 0 | 0 | * | 0 | ||
| Total Services Sector | 45 - 99 | 643,175 | 132,583 | * | 203,315 | 203,191 | 173,603 | 627,971 | 166,840 | * | 170,821 | 168,939 | 161,011 | ||
| Wholesale and retail trade; Repairs of motor vehicles | G | 30,015 | * | * | 18,375 | 18,313 | 1,952 | 29,109 | * | * | 17,586 | 17,412 | 2,662 | ||
| Information and communication | J | 150,220 | 9,289 | * | 5,334 | 5,338 | 130,289 | 193,730 | 58,194 | * | 4,739 | 4,587 | 122,618 | ||
| Financial intermediation | 64 | 218,059 | 106,117 | 673 | 63,809 | 64,272 | 18,679 | 234,160 | 91,205 | * | 83,637 | 82,494 | 17,254 | ||
| of which: | |||||||||||||||
| Activities of holding companies | 64.2 | 21,131 | * | 0 | * | * | 6,058 | 20,505 | * | 0 | 8,753 | 8,753 | 5,961 | ||
| Insurance services | 65 | 28,683 | 3,745 | * | 15,416 | 15,051 | 5,565 | 29,673 | * | 315 | 17,901 | 17,582 | 6,076 | ||
| Administrative and support activities | N | 64,232 | 8,615 | * | 5,675 | 5,511 | 7,193 | 52,927 | 9,695 | * | 9,903 | 9,809 | 5,055 | ||
| Other services activities6 | 151,966 | * | 29,762 | 94,706 | 94,706 | 9,925 | 88,372 | -81 | 32,791 | 37,055 | 37,055 | 7,346 | |||
| 1The sign convention used is: for year-end positions 'In Ireland' an entry without sign indicates a net liability position, while a minus sign indicates a net asset position. | |||||||||||||||
| 2The activity classification used in this release is the NACE Rev. 2 classification. | |||||||||||||||
| 3Revised. | |||||||||||||||
| 4For analytical purposes, additional details are given of transactions between residents of Ireland and residents of the EU27 area. | |||||||||||||||
| 5The relevant EMU countries are: Austria, Belgium, Cyprus, Estonia, Finland, France, Germany, Greece, Italy, Latvia, Lithuania, Luxembourg, Malta, Netherlands, Portugal, Slovakia, Slovenia and Spain. | |||||||||||||||
| 6This covers residual FDI service activity. | |||||||||||||||
| *Data suppressed for confidentiality reasons. | |||||||||||||||
| Table 9 Direct Investment Income1 Flows Classified by Geographic Location of Creditor/Debtor | € million | |||||||
| Region/Country | 2019 2 | 2020 | ||||||
| Inflows | Outflows | Net | Inflows | Outflows | Net | |||
| Europe | 21,532 | 65,000 | -43,468 | 18,764 | 66,596 | -47,832 | ||
| of which: | ||||||||
| Belgium | 90 | 2,413 | -2,323 | * | 1,586 | * | ||
| France | 280 | 2,524 | -2,244 | 220 | 1,813 | -1,593 | ||
| Germany | 143 | * | * | 111 | 1,068 | -957 | ||
| Italy | 31 | 2,032 | -2,001 | -114 | 1,586 | -1,700 | ||
| Luxembourg | 11,523 | 16,053 | -4,530 | 11,409 | 8,352 | 3,057 | ||
| Netherlands | 6,380 | 11,428 | -5,048 | 2,867 | 10,163 | -7,296 | ||
| Spain | -57 | 391 | -448 | 7 | 415 | -408 | ||
| Switzerland | 228 | 14,590 | -14,362 | 536 | 23,714 | -23,178 | ||
| United Kingdom | 2,396 | 3,971 | -1,575 | 2,794 | 1,918 | 876 | ||
| EU 273 | 18,802 | 32,297 | -13,495 | 14,994 | 25,394 | -10,400 | ||
| EMU 194 | 18,803 | 31,876 | -13,073 | 14,935 | 25,277 | -10,342 | ||
| Americas | 3,994 | 22,154 | -18,160 | 4,429 | 27,300 | -22,871 | ||
| of which: | ||||||||
| Canada | 85 | -53 | 138 | 46 | -4 | 50 | ||
| United States | 2,074 | 11,386 | -9,312 | 4,214 | 8,366 | -4,152 | ||
| Offshore centres | 1,698 | 10,818 | -9,119 | 100 | 18,936 | -18,836 | ||
| Asia | * | 4,171 | * | * | 4,583 | * | ||
| of which: | ||||||||
| Japan | 28 | 2,667 | -2,639 | 46 | * | * | ||
| Africa | 1 | 37 | -36 | 14 | 21 | -7 | ||
| Oceania and Polar Regions | * | 21 | * | * | 9 | * | ||
| Not geographically allocated5 | 1,611 | 345 | 1,266 | 880 | 463 | 417 | ||
| Total | 22,562 | 91,728 | -69,166 | 20,945 | 98,971 | -78,026 | ||
| of which: | ||||||||
| Offshore centres6 | 1,625 | 25,629 | -24,004 | 459 | 35,235 | -34,776 | ||
| 1Income on equity and other direct investment capital. | ||||||||
| 2Revised. | ||||||||
| 3For analytical purposes, additional details are given of transactions between residents of Ireland and residents of the EU27 area. | ||||||||
| 4The relevant EMU countries are: Austria, Belgium, Cyprus, Estonia, Finland, France, Germany, Greece, Italy, Latvia, Lithuania, Luxembourg, Malta, Netherlands, Portugal, Slovakia, Slovenia and Spain. | ||||||||
| 5This category covers data supplied by respondents without a geographical breakdown. | ||||||||
| 6This category overlaps with the regions referred to above and covers Andorra, Antigua and Barbuda, Anguilla, Netherlands Antilles, Barbados, Bahrain, Bermuda, Bahamas, Belize, Cook Islands, Curacao, Dominica, Grenada, Guernsey, Gibraltar, Hong Kong, Isle of Man, Jersey, Jamaica, St. Kitts and Nevis, Cayman Islands, Lebanon, Saint Lucia, Liechtenstein, Liberia, Marshall Islands, Montserrat, Maldives Nauru, Niue, Panama, Philippines, Singapore, St MaartenTurks and Caicos Islands, Saint Vincent and the Grenadines, British Virgin Islands, US Virgin Islands, Vanuatu, Samoa. | ||||||||
| *Data suppressed for confidentiality reasons. | ||||||||
The Foreign Direct Investment release updates the annual statistical series on Foreign Direct Investment (FDI) flows and end-year stocks (or positions) for Ireland, broken down geographically by region and by country. The release includes tables with further analyses of the FDI flows and stocks presented by the principal economic activity (using NACE Rev.2 classification) of the resident direct investment enterprise. The statistics are methodologically consistent with the data already presented in the quarterly balance of payments and IIP releases. The statistics are also compatible with those supplied to Eurostat and the European Central Bank (ECB) and to other international organisations such as the International Monetary Fund (IMF) and the Organisation for Economic Co-operation and Development (OECD).
For more detailed methodological information see:
Foreign Direct Investment - Background Notes (PDF 215KB)
Redomiciled PLCs in the Irish Balance of Payments
 Hide Background Notes
Scan the QR code below to view this release online or go to
http://www.cso.ie/en/releasesandpublications/er/fdi/foreigndirectinvestmentannual2020/
 Show Table 1 - Direct Investment Flows Abroad Classified by Location of Investment
 Hide Table 1 - Direct Investment Flows Abroad Classified by Location of Investment