
| € million | ||||
| 2012 | 2013 | 2014 | 2015 | |
| Foreign Direct Investment | ||||
| Flows - Abroad | 17,562 | 22,118 | 31,231 | 149,937 |
| Flows - In Ireland | 36,520 | 35,114 | 28,200 | 169,809 |
| Positions - Abroad - end year | 312,304 | 387,987 | 510,178 | 815,202 |
| Positions - In Ireland - end year | 290,466 | 296,412 | 342,700 | 795,644 |
| Positions - Net - end year | 21,838 | 91,575 | 167,478 | 19,558 |
| Net Income Flows | -26,791 | -23,822 | -23,717 | -43,934 |
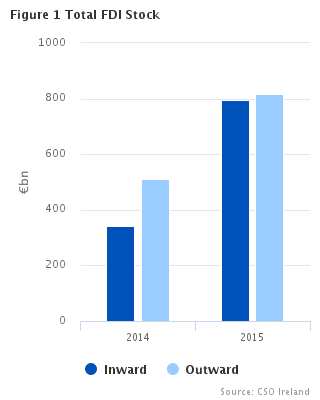
Irish stocks of direct investment abroad increased to €815bn at the end of 2015 from a stock position of €510bn at the end of 2014.This increase continues to be driven by the Redomiciled PLCs in Ireland - see background note. The end 2015 stock of direct investment abroad comprised of Equity Capital & Reinvested Earnings of €729bn and Other Capital of €86bn. The rise between the end of 2014 and the end of 2015 was largely due to increased investment in enterprises located in Luxembourg (€240bn) and the US (€48bn). Further investment in Europe went to enterprises located in UK (€11bn), the Netherlands (€6bn) and offshore centres (€5bn) while Investment in Central American offshore centres decreased (€38bn) - see Table 3
The stock of foreign direct investment into Ireland also increased between the end of 2014 and the end of 2015 - from €343bn to €796bn. The main contributors were increased investment from the US (€349bn), from Luxembourg (€69bn), the Netherlands (€11bn) and from all offshore centres (€38bn) - see Table 4.
The net FDI asset position for Ireland at the end of 2015 was a surplus of €20bn, down €148bn from the net position at the end of 2014.
In line with International recommendations the geographic allocation of direct investment flows and stocks in Tables 1 to 9 is based on the country of location of the immediate owner of the direct investment enterprise.
An alternative presentation of the stock of direct investment in Ireland by ultimate investor displays a different geographic pattern. Figure 2 measures the value of investment stock in Ireland by location of the immediate owner (of the direct investment enterprise). Figure 3 measures the value of investment stock in Ireland by location of the ultimate investor. In 2015, the stock of investment from the US as ultimate investor at €581bn was €215bn greater than the stock of US investment presented by immediate owner (€367bn). Investment stock from Ireland as ultimate investor at €105bn primarily represents former US-based corporate inversion enterprises which are now located in Ireland - see Figure 3.
| X-axis label | United States | Luxembourg | Offshore centres | Netherlands | Other | United Kingdom |
|---|---|---|---|---|---|---|
| 2015 | 366.764 | 139.286 | 96.995 | 87.333 | 68.307 | 36.959 |
| X-axis label | United States | Ireland | Other | Offshore | United Kingdom | Germany |
|---|---|---|---|---|---|---|
| 2015 | 581.448 | 104.651 | 54.8440000000001 | 23.636 | 19.461 | 11.603 |
| The order of labels 'Offshore ' and 'Other' (in Figure 3) were corrected on 28/04/17. |
Flows of direct investment into Ireland in 2015 were €170bn – up from a €28bn inflow in 2014. Equity investment amounted to €117bn with reinvested earnings and other capital investment at €39bn and €14bn respectively. Investment from US increased from €6bn in 2014 to €100bn in 2015 similarly investment from Europe increased from €12bn to €62bn in the same period. Investment from Asia increased from a disinvestment of €4bn in 2014 to an investment of €7bn in 2015 - see Table 2.
| X-axis label | United States | Offshore centres | Other | Netherlands | Bermuda | France |
|---|---|---|---|---|---|---|
| Flows | 100.134 | 38.094 | 15.906 | 7.995 | 3.95 | 3.73 |
During 2015 direct investment flows abroad increased by €119bn to €150bn from €31bn in 2014. Investment into the US of €63bn and into Europe of €71bn (mainly to Luxembourg €56bn) accounted for most of the total investment. The increased flows abroad consisted mainly of Equity investment (€113bn) while reinvested earnings and other capital amounted to €11bn and €26bn respectively - see Table 1.
Investment abroad by enterprises located in Ireland was mainly from the services sector - positions of €733bn at the end of 2015 were up €288bn compared to positions at the end of 2014 (€446bn). Of this investment from the services sector, 79% (€583bn) was into the EU. Investment from the manufacturing sector amounted to €56bn - see Table 7.
The largest sector for inward investment was the services sector which at the end of 2015 held positions of €453bn, a result of increased investment in financial intermediation and other services activities, up €67bn and €90bn to €185 and €119bn respectively. Investment in the manufacturing sector increased by €263bn to €341bn in the same period - see Table 8.
| X-axis label | Manufacturing | Services |
|---|---|---|
| In Ireland | 341.342 | 452.938 |
| Abroad | 56.188 | 733.304 |
Income outflows of foreign owned direct investment enterprises were €60bn in 2015, an increase of €16bn compared with 2014. The earnings of European owned companies were €42bn in 2015, up €18bn on the 2014 figure. Income earned abroad by investors located in Ireland was €16bn in 2015 down €4bn on 2014. The source of these earnings were mainly Luxembourg (€8bn), the US (€4bn) and the Netherlands (€2bn) - see Table 9.
| Table 1 Direct Investment1 Flows Abroad Classified by Location of Investment | € million | ||||||||||||||||||
| Region/Country | 2012 2 | 2013 2 | 2014 2 | 2015 | |||||||||||||||
| Equity | Reinvested Earnings | Other Capital | Total | Equity | Reinvested Earnings | Other Capital | Total | Equity | Reinvested Earnings | Other Capital | Total | Equity | Reinvested Earnings | Other Capital | Total | ||||
| Europe | 409 | 5,601 | -1,143 | 4,867 | 19,443 | 8,657 | -83 | 28,015 | -3,763 | 9,775 | 21,827 | 27,838 | 57,018 | 10,203 | 3,670 | 70,890 | |||
| of which: | |||||||||||||||||||
| Belgium | -193 | * | * | -3 | * | * | * | -132 | 108 | * | * | 184 | * | 0 | * | 338 | |||
| France | * | * | 87 | 200 | 131 | 58 | 50 | 239 | -31 | 104 | -9 | 61 | 529 | 49 | -416 | 160 | |||
| Germany | -1 | 34 | 39 | 71 | 75 | 54 | 315 | 445 | 52 | 23 | 171 | 246 | -158 | 122 | -281 | -318 | |||
| Italy | * | * | 79 | -68 | * | 35 | * | 136 | 32 | 27 | -79 | -21 | 76 | -99 | 20 | -4 | |||
| Luxembourg | -3,715 | 1,896 | -1,525 | -3,343 | -859 | 3,518 | -1,440 | 1,219 | 12,664 | 3,558 | 20,281 | 36,502 | 48,059 | 5,229 | 2,879 | 56,167 | |||
| Netherlands | * | 1,679 | * | 1,111 | 472 | 1,999 | -242 | 2,229 | 1,513 | 2,193 | -927 | 2,780 | 3,372 | 1,744 | -856 | 4,262 | |||
| Spain | 80 | * | * | -743 | 178 | 16 | 429 | 621 | 63 | 9 | 56 | 131 | * | -9 | * | 85 | |||
| Switzerland | 757 | * | * | 1,225 | * | * | 92 | * | -36 | * | * | * | * | * | 1,605 | 5,637 | |||
| United Kingdom | 391 | 732 | -1,408 | -285 | 5,349 | 994 | 1,595 | 7,937 | -9,549 | 1,071 | 7,888 | -590 | 19 | 665 | -205 | 478 | |||
| EU 283 | -3,193 | 4,897 | -1,983 | -278 | 13,424 | 7,668 | 97 | 21,188 | -4,070 | 8,424 | 35,719 | 40,075 | 52,218 | 9,493 | 1,530 | 63,241 | |||
| EMU 194 | -3,677 | 3,692 | -2,542 | -2,527 | 304 | 5,677 | -1,523 | 4,457 | 14,433 | 6,254 | 20,067 | 40,755 | 51,138 | 7,473 | 2,851 | 61,461 | |||
| Americas | 5,495 | * | 1,798 | * | -9,008 | 2,933 | 459 | -5,614 | 1,493 | 3,911 | -3,654 | 1,751 | * | * | 15,850 | 64,719 | |||
| North America | * | 1,113 | * | 6,751 | * | * | 2,127 | 63 | 1,809 | 1,670 | -7,478 | -3,998 | * | * | 16,713 | 63,175 | |||
| of which: | |||||||||||||||||||
| Canada | * | 16 | * | 22 | * | * | -10 | -43 | 58 | 93 | -40 | 110 | 266 | 50 | 215 | 531 | |||
| United States | 5,908 | 1,098 | -277 | 6,729 | * | * | 2,137 | 107 | 1,750 | 1,577 | -7,438 | -4,111 | * | * | 16,498 | 62,643 | |||
| Central America | -460 | 3,219 | 1,520 | 4,278 | * | * | * | -5,670 | * | * | * | 5,753 | * | 1,793 | * | * | |||
| South America | * | * | * | * | * | 17 | * | -6 | * | * | * | -4 | 149 | 23 | * | * | |||
| Asia | * | 509 | * | 920 | 27 | 530 | -49 | 508 | 200 | 555 | 267 | 1,021 | * | * | * | 8,938 | |||
| of which: | 0 | 0 | 0 | 0 | |||||||||||||||
| China | 14 | * | 2 | * | 23 | * | * | 282 | * | * | 43 | 343 | * | * | -3 | -76 | |||
| Hong Kong | 40 | 23 | 2 | 67 | * | 15 | * | 19 | * | * | -2 | -11 | * | 4 | 13 | * | |||
| Japan | * | 20 | * | 258 | -15 | 3 | 119 | 107 | -6 | 13 | 75 | 86 | * | 4 | * | 3,560 | |||
| Africa | * | * | * | -11 | * | * | * | * | * | * | * | * | 7 | * | * | 18 | |||
| Oceania and Polar Regions | * | 202 | * | * | * | 221 | * | 526 | 130 | 70 | -53 | 146 | * | * | * | 351 | |||
| Not geographically allocated5 | 77 | 228 | -181 | 125 | -345 | * | -170 | * | * | * | * | * | -333 | 1,523 | 3,833 | 5,023 | |||
| Total | 6,892 | 10,915 | -244 | 17,562 | 10,059 | 11,583 | 475 | 22,118 | -2,076 | 14,199 | 19,110 | 31,231 | 113,321 | 10,863 | 25,754 | 149,937 | |||
| of which: | |||||||||||||||||||
| All offshore centres6 | 715 | 3,473 | 2,239 | 6,424 | * | 2,004 | * | -5,733 | * | 2,754 | * | 6,950 | 5,716 | 2,094 | -273 | 7,537 | |||
| 1Data are provided according to arithmetic sign conventions e.g. minus signs are used in cases where there is withdrawal of investment. | |||||||||||||||||||
| 2Revised | |||||||||||||||||||
| 3For analytical purposes, additional details are given of transactions between residents of Ireland and residents of the EU28 area. | |||||||||||||||||||
| 4The relevant EMU countries are: Austria, Belgium, Cyprus, Estonia, Finland, France, Germany, Greece, Italy, Latvia, Lithuania, Luxembourg, Malta, Netherlands, Portugal, Slovakia, Slovenia and Spain. | |||||||||||||||||||
| 5This category covers data supplied by respondents without a geographical breakdown. | |||||||||||||||||||
| 6This category overlaps with the regions referred to above and covers Andorra, Antigua and Barbuda, Anguilla, Netherlands Antilles, Barbados, Bahrain, Bermuda, Bahamas, Belize, Cook Islands, Curacao, Dominica, Grenada, | |||||||||||||||||||
| Guernsey, Gibraltar, Hong Kong, Isle of Man, Jersey, Jamaica, St. Kitts and Nevis, Cayman Islands, Lebanon, Saint Lucia, Liechtenstein, Liberia, Marshall Islands, Montserrat, Maldives, Nauru, Niue, Panama, Philippines, | |||||||||||||||||||
| Singapore, St Maarten, Turks and Caicos Islands, Saint Vincent and the Grenadines, British Virgin Islands, US Virgin Islands, Vanuatu, Samoa. | |||||||||||||||||||
| *Data suppressed for confidentiality reasons. | |||||||||||||||||||
| Table 2 Direct Investment1 Flows into Ireland Classified by Location of Investor | € million | ||||||||||||||||||
| Region/Country | 2012 2 | 2013 2 | 2014 2 | 2015 | |||||||||||||||
| Equity | Reinvested Earnings | Other Capital | Total | Equity | Reinvested Earnings | Other Capital | Total | Equity | Reinvested Earnings | Other Capital | Total | Equity | Reinvested Earnings | Other Capital | Total | ||||
| Europe | 14,710 | 11,924 | -2,942 | 23,693 | 7,640 | 13,018 | 1,461 | 22,117 | 13,433 | 12,951 | -14,104 | 12,280 | 110,501 | 28,899 | -77,478 | 61,923 | |||
| of which: | |||||||||||||||||||
| Belgium | * | * | -1,687 | -689 | * | * | -661 | 1,162 | * | * | 66 | 2,041 | * | 1,246 | * | 40 | |||
| France | 391 | 1,268 | -155 | 1,503 | 1,262 | 1,435 | 971 | 3,668 | 15 | 1,527 | -5,225 | -3,681 | 60 | 1,762 | 1,908 | 3,730 | |||
| Germany | 464 | 824 | -429 | 861 | -266 | 650 | -411 | -26 | 148 | 666 | -800 | 14 | -91 | 613 | -2,359 | -1,837 | |||
| Italy | -87 | 1,105 | -163 | 853 | 50 | 1,341 | 443 | 1,834 | -70 | 907 | -481 | 356 | * | 1,486 | * | 1,525 | |||
| Luxembourg | 4,264 | 1,002 | -1,334 | 3,933 | 1,190 | 1,573 | 5,929 | 8,694 | 7,767 | 2,150 | -6,714 | 3,205 | * | 2,032 | -12,577 | * | |||
| Netherlands | 1,014 | 4,593 | 5,826 | 11,432 | -1,639 | 3,400 | -143 | 1,618 | -6,022 | 2,573 | 15,980 | 12,529 | 8,766 | 6,570 | -7,341 | 7,995 | |||
| United Kingdom | 7,320 | 627 | -4,370 | 3,577 | 5,060 | -19 | -4,542 | 500 | 6,566 | 1,235 | -7,044 | 757 | 15,901 | 1,082 | -21,122 | -4,138 | |||
| EU 283 | 13,508 | 10,789 | -1,115 | 23,184 | 7,328 | 9,856 | 3,441 | 20,625 | 13,654 | 10,535 | -11,041 | 13,148 | 64,352 | 15,328 | -42,414 | 37,266 | |||
| EMU 194 | 6,722 | 9,967 | 3,033 | 19,723 | 1,640 | 9,863 | 7,562 | 19,066 | 7,200 | 9,132 | -550 | 15,779 | 48,490 | 13,985 | -21,938 | 40,537 | |||
| North America | * | * | -3,566 | 4,379 | 6,236 | 2,034 | 811 | 9,080 | * | * | 3,264 | 6,543 | * | * | 98,866 | 99,171 | |||
| of which: | |||||||||||||||||||
| Canada | * | * | 190 | 634 | -16 | 15 | 87 | 84 | * | * | 83 | 286 | * | * | -101 | -961 | |||
| United States | 3,705 | 3,797 | -3,755 | 3,745 | 6,251 | 2,019 | 724 | 8,996 | -848 | 3,925 | 3,180 | 6,257 | -844 | 2,009 | 98,967 | 100,134 | |||
| Central America | -1,206 | 5,736 | -1,895 | 2,636 | -410 | 4,550 | 1,153 | 5,292 | 5,560 | 7,124 | 2,462 | 15,146 | 2,864 | 7,879 | -95 | 10,647 | |||
| of which: | |||||||||||||||||||
| Bermuda | 100 | 5,498 | -2,441 | 3,157 | -241 | 4,328 | 377 | 4,464 | 4,071 | 7,941 | -1,165 | 10,846 | -1,173 | 7,848 | -2,725 | 3,950 | |||
| South America | * | * | -136 | -96 | 0 | 0 | 43 | 43 | * | * | -35 | -35 | * | * | -204 | -204 | |||
| of which: | |||||||||||||||||||
| Brazil | 0 | 0 | -120 | -120 | 0 | 0 | 60 | 60 | 0 | 0 | -20 | -20 | 0 | 0 | -90 | -90 | |||
| Asia | 1,161 | 344 | 2,827 | 4,331 | * | * | 431 | -952 | * | * | -4,353 | -3,802 | * | * | 7,465 | 7,499 | |||
| of which: | |||||||||||||||||||
| China | 0 | -4 | 43 | 39 | 4 | 0 | -397 | -393 | 0 | 0 | 65 | 65 | * | * | 1,152 | 1,298 | |||
| Japan | * | * | 407 | 1,199 | * | * | -1,328 | -1,281 | * | * | 1,509 | 1,842 | * | * | * | -1,207 | |||
| Africa | -98 | 12 | 66 | -21 | * | * | 1 | 0 | 0 | 6 | * | * | 0 | * | * | * | |||
| Oceania and Polar Regions | * | * | 743 | 771 | * | * | 508 | 543 | * | * | 462 | 451 | * | * | * | * | |||
| Not geographically allocated5 | * | * | 755 | 825 | * | * | -867 | -1,012 | -240 | * | * | * | * | * | * | * | |||
| Total | 18,513 | 22,153 | -4,147 | 36,520 | 11,673 | 19,902 | 3,541 | 35,114 | 18,570 | 24,449 | -14,818 | 28,200 | 116,845 | 38,781 | 14,181 | 169,809 | |||
| of which: | |||||||||||||||||||
| All offshore centres6 | -1,425 | 6,095 | -626 | 4,044 | -353 | 4,689 | 2,314 | 6,648 | 5,565 | 7,370 | -2,643 | 10,293 | * | * | -25,787 | 38,094 | |||
| 1Data are provided according to arithmetic sign conventions e.g. minus signs are used in cases where there is withdrawal of investment. | |||||||||||||||||||
| 2Revised | |||||||||||||||||||
| 3For analytical purposes, additional details are given of transactions between residents of Ireland and residents of the EU28 area. | |||||||||||||||||||
| 4The relevant EMU countries are: Austria, Belgium, Cyprus, Estonia, Finland, France, Germany, Greece, Italy, Latvia, Lithuania, Luxembourg, Malta, Netherlands, Portugal, Slovakia, Slovenia and Spain. | |||||||||||||||||||
| 5This category covers data supplied by respondents without a geographical breakdown. | |||||||||||||||||||
| 6This category overlaps with the regions referred to above and covers Andorra, Antigua and Barbuda, Anguilla, Netherlands Antilles, Barbados, Bahrain, Bermuda, Bahamas, Belize, Cook Islands, Curacao, Dominica, Grenada, | |||||||||||||||||||
| Guernsey, Gibraltar, Hong Kong,Isle of Man, Jersey, Jamaica, St. Kitts and Nevis, Cayman Islands, Lebanon, Saint Lucia, Liechtenstein, Liberia, Marshall Islands, Montserrat, Maldives, Nauru, Niue, Panama, Philippines, | |||||||||||||||||||
| Singapore, St Maarten, Turks and Caicos Islands, Saint Vincent and the Grenadines, British Virgin Islands, US Virgin Islands, Vanuatu, Samoa. | |||||||||||||||||||
| *Data suppressed for confidentiality reasons. | |||||||||||||||||||
| Table 3 Direct Investment1 Abroad End Year Positions Classified by Location of Investment | € million | ||||||||||||||
| Region/Country | 2012 2 | 2013 2 | 2014 2 | 2015 | |||||||||||
| Equity Capital & Reinvested Earnings | Other Capital | Total | Equity Capital & Reinvested Earnings | Other Capital | Total | Equity Capital & Reinvested Earnings | Other Capital | Total | Equity Capital & Reinvested Earnings | Other Capital | Total | ||||
| Europe | 166,083 | 48,024 | 214,107 | 223,750 | 40,910 | 264,660 | 291,724 | 66,136 | 357,860 | 546,449 | 80,678 | 627,127 | |||
| of which: | |||||||||||||||
| France | 1,926 | 1,071 | 2,997 | 2,026 | 785 | 2,811 | * | * | 2,577 | 2,616 | 84 | 2,700 | |||
| Germany | 3,008 | 159 | 3,167 | 3,234 | 349 | 3,583 | 4,833 | 410 | 5,243 | 4,461 | 31 | 4,492 | |||
| Italy | 301 | 402 | 704 | 246 | 14 | 260 | 439 | -235 | 204 | 1,367 | -133 | 1,234 | |||
| Luxembourg | 39,122 | 24,756 | 63,878 | 66,115 | 28,166 | 94,281 | 126,771 | 49,889 | 176,660 | 353,001 | 63,483 | 416,485 | |||
| Netherlands | 34,013 | 5,664 | 39,678 | 33,374 | 5,404 | 38,778 | 40,417 | 4,863 | 45,281 | 47,544 | 4,209 | 51,754 | |||
| Switzerland | 5,626 | 983 | 6,609 | * | * | 7,279 | * | * | -6,856 | * | * | -5,666 | |||
| United Kingdom | 47,052 | 2,950 | 50,001 | 61,079 | 5,166 | 66,245 | 63,236 | 14,763 | 77,999 | 73,525 | 15,523 | 89,049 | |||
| Offshore centres | 9,218 | 1,895 | 11,113 | 9,144 | 2,175 | 11,319 | 8,550 | 403 | 8,953 | 12,753 | 848 | 13,601 | |||
| EU 283 | 149,126 | 45,061 | 194,187 | 202,899 | 41,394 | 244,293 | 270,555 | 83,250 | 353,805 | 518,453 | 98,551 | 617,004 | |||
| EMU 194 | 93,344 | 32,896 | 126,240 | 119,749 | 35,602 | 155,351 | 192,049 | 59,319 | 251,368 | 426,825 | 74,137 | 500,962 | |||
| Americas | * | * | 83,730 | * | * | 105,634 | 126,823 | 5,926 | 132,749 | 144,807 | -2,314 | 142,492 | |||
| North America | * | * | 39,629 | * | * | 47,582 | 56,842 | -2,719 | 54,123 | 113,473 | -11,030 | 102,443 | |||
| of which: | |||||||||||||||
| Canada | * | * | 1,894 | * | * | 1,669 | 2,138 | -59 | 2,078 | 1,989 | 164 | 2,153 | |||
| United States | 39,868 | -2,132 | 37,735 | 44,069 | 1,845 | 45,914 | 54,705 | -2,660 | 52,045 | 111,484 | -11,193 | 100,290 | |||
| Central America | 46,658 | -3,242 | 43,416 | * | * | 57,528 | * | * | 78,114 | * | * | 39,448 | |||
| of which: | |||||||||||||||
| Offshore centres | 46,018 | -3,294 | 42,725 | 51,816 | 5,316 | 57,132 | 69,240 | 8,309 | 77,549 | 31,075 | 8,406 | 39,481 | |||
| South America | 107 | 578 | 685 | * | * | 524 | * | * | 512 | * | * | 601 | |||
| Asia | 2,561 | -210 | 2,352 | 3,546 | 86 | 3,633 | 4,094 | 27 | 4,121 | 15,496 | 2,677 | 18,173 | |||
| Africa | 98 | 134 | 232 | 17 | 101 | 118 | * | * | 340 | * | * | 350 | |||
| Oceania and Polar Regions | * | * | 4,026 | 5,295 | -409 | 4,886 | 5,540 | -583 | 4,957 | 5,064 | -513 | 4,551 | |||
| Not geographically allocated5 | 8,020 | -162 | 7,858 | * | * | 9,056 | * | * | 10,153 | * | * | 22,508 | |||
| Total | 269,818 | 42,487 | 312,304 | 340,246 | 47,742 | 387,987 | 437,273 | 72,905 | 510,178 | 729,484 | 85,718 | 815,202 | |||
| of which: | |||||||||||||||
| All offshore centres6 | 55,847 | -1,445 | 54,403 | 61,810 | 7,078 | 68,888 | 78,715 | 8,709 | 87,424 | * | * | 57,088 | |||
| 1The sign convention used is: for year-end positions 'Abroad', an entry without sign indicates a net asset position, while a minus sign indicates a net liability position. | |||||||||||||||
| 2Revised | |||||||||||||||
| 3For analytical purposes, additional details are given of transactions between residents of Ireland and residents of the EU28 area. | |||||||||||||||
| 4The relevant EMU countries are: Austria, Belgium, Cyprus, Estonia, Finland, France, Germany, Greece, Italy, Latvia, Lithuania, Luxembourg, Malta, Netherlands, Portugal, Slovakia, Slovenia and Spain. | |||||||||||||||
| 5This category covers data supplied by respondents without a geographical breakdown. | |||||||||||||||
| 6This category overlaps with the regions referred to above and covers Andorra, Antigua and Barbuda, Anguilla, Netherlands Antilles, Barbados, Bahrain, Bermuda, Bahamas, Belize, Cook Islands, Curacao, Dominica, Grenada, | |||||||||||||||
| Guernsey, Gibraltar, Hong Kong, Isle of Man, Jersey, Jamaica, St. Kitts and Nevis, Cayman Islands, Lebanon, Saint Lucia, Liechtenstein, Liberia, Marshall Islands, Montserrat, Maldives, Nauru, Niue, Panama, Philippines, | |||||||||||||||
| Singapore, St Maarten, Turks and Caicos Islands, Saint Vincent and the Grenadines, British Virgin Islands, US Virgin Islands, Vanuatu, Samoa. | |||||||||||||||
| *Data suppressed for confidentiality reasons. | |||||||||||||||
| Table 4 Direct Investment1 in Ireland End Year Positions Classified by Location of Investor | € million | ||||||||||||||
| Region/Country | 2012 2 | 2013 2 | 2014 2 | 2015 | |||||||||||
| Equity Capital & Reinvested Earnings | Other Capital | Total | Equity Capital & Reinvested Earnings | Other Capital | Total | Equity Capital & Reinvested Earnings | Other Capital | Total | Equity Capital & Reinvested Earnings | Other Capital | Total | ||||
| Europe | 186,603 | 42,404 | 229,007 | 197,090 | 37,617 | 234,707 | 223,587 | 31,020 | 254,607 | 381,485 | -39,909 | 341,575 | |||
| of which: | |||||||||||||||
| Belgium | 1,366 | -2,817 | -1,452 | 3,398 | -718 | 2,681 | 5,423 | -505 | 4,919 | 6,120 | -2,214 | 3,906 | |||
| France | 13,339 | 3,898 | 17,237 | 15,252 | 4,473 | 19,725 | 16,739 | -1,438 | 15,301 | 17,962 | 623 | 18,585 | |||
| Germany | 9,237 | 1,079 | 10,316 | 8,221 | 1,530 | 9,752 | 8,443 | -1,082 | 7,361 | 7,827 | -4,775 | 3,052 | |||
| Italy | 6,690 | 383 | 7,074 | 7,734 | -450 | 7,284 | 7,147 | -917 | 6,229 | 8,173 | -612 | 7,562 | |||
| Luxembourg | 37,334 | 33,007 | 70,341 | 39,941 | 33,786 | 73,726 | 48,157 | 22,536 | 70,693 | 127,999 | 11,287 | 139,286 | |||
| Netherlands | 41,236 | 5,208 | 46,444 | 34,486 | 5,425 | 39,912 | 40,232 | 35,974 | 76,207 | 54,915 | 32,417 | 87,333 | |||
| Spain | 9,205 | 503 | 9,708 | 9,835 | 1,068 | 10,903 | 13,191 | -629 | 12,562 | 12,801 | -1,255 | 11,547 | |||
| Switzerland | 11,168 | 963 | 12,131 | 14,639 | -4,467 | 10,172 | * | * | 9,581 | 25,075 | -11,991 | 13,085 | |||
| United Kingdom | 46,277 | -3,177 | 43,100 | 52,940 | -6,863 | 46,077 | 56,327 | -13,265 | 43,062 | 69,667 | -32,708 | 36,959 | |||
| Offshore centres | 4,026 | -9 | 4,016 | 4,606 | -206 | 4,400 | 4,497 | 728 | 5,225 | * | * | 16,019 | |||
| EU 283 | 170,512 | 40,819 | 211,330 | 177,641 | 41,703 | 219,344 | 200,862 | 38,598 | 239,460 | 309,826 | 2,566 | 312,391 | |||
| EMU 194 | 119,724 | 43,434 | 163,158 | 120,263 | 47,723 | 167,987 | 140,750 | 54,795 | 195,544 | 236,769 | 37,537 | 274,306 | |||
| North America | 66,859 | -41,998 | 24,861 | 73,843 | -42,054 | 31,789 | 69,451 | -48,108 | 21,343 | 65,705 | 302,632 | 368,337 | |||
| of which: | |||||||||||||||
| Canada | 3,526 | -289 | 3,237 | 3,458 | -299 | 3,159 | 3,612 | -134 | 3,478 | 1,676 | -103 | 1,573 | |||
| United States | 63,333 | -41,709 | 21,624 | 70,385 | -41,755 | 28,630 | 65,839 | -47,974 | 17,865 | 64,029 | 302,735 | 366,764 | |||
| Central America | * | * | 27,463 | 34,335 | -12,843 | 21,492 | 62,810 | -13,073 | 49,738 | 88,579 | -16,517 | 72,062 | |||
| of which: | |||||||||||||||
| Offshore centres | 36,526 | -9,138 | 27,389 | 34,252 | -12,974 | 21,278 | 62,780 | -13,133 | 49,647 | 88,545 | -16,489 | 72,056 | |||
| South America | * | * | -348 | -2 | -391 | -393 | 0 | -325 | -325 | 0 | -481 | -481 | |||
| of which: | |||||||||||||||
| Brazil | -1 | -246 | -247 | -1 | * | * | 0 | * | * | 0 | -241 | -241 | |||
| Asia | 2,106 | 6,079 | 8,185 | 921 | 6,629 | 7,550 | 1,918 | 5,643 | 7,561 | 3,671 | 8,288 | 11,959 | |||
| of which: | |||||||||||||||
| China | 35 | -282 | -248 | 4 | -678 | -674 | 0 | -215 | -215 | * | * | -126 | |||
| Japan | 855 | 469 | 1,324 | 724 | -651 | 72 | * | * | 2,282 | 1,693 | -27 | 1,666 | |||
| Singapore | 21 | * | * | 15 | * | * | 18 | 3,086 | 3,104 | 39 | * | * | |||
| Offshore centres5 | 51 | 6,822 | 6,872 | 41 | * | * | 81 | 3,609 | 3,690 | 108 | 3,442 | 3,550 | |||
| Africa | 374 | 47 | 421 | 256 | -49 | 207 | * | * | -1,235 | 114 | -61 | 53 | |||
| Oceania and Polar Regions | * | * | 523 | 63 | 745 | 808 | * | * | 1,099 | * | * | 447 | |||
| Not geographically allocated6 | 225 | 128 | 353 | 1,432 | -1,180 | 252 | * | * | 9,909 | * | * | 1,692 | |||
| Total | 293,142 | -2,676 | 290,466 | 307,938 | -11,527 | 296,412 | 372,257 | -29,557 | 342,700 | 546,067 | 249,577 | 795,644 | |||
| of which: | |||||||||||||||
| All offshore centres7 | 40,791 | -2,326 | 38,465 | 39,089 | -4,394 | 34,695 | 67,364 | -8,796 | 58,568 | 135,109 | -38,114 | 96,995 | |||
| 1The sign convention used is: for year-end positions 'In Ireland' an entry without sign indicates a net liability position, while a minus sign indicates a net asset position. | |||||||||||||||
| 2Revised | |||||||||||||||
| 3For analytical purposes, additional details are given of transactions between residents of Ireland and residents of the EU28 area. | |||||||||||||||
| 4The relevant EMU countries are: Austria, Belgium, Cyprus, Estonia, Finland, France, Germany, Greece, Italy, Latvia, Lithuania, Luxembourg, Malta, Netherlands, Portugal, Slovakia, Slovenia and Spain. | |||||||||||||||
| 5This category overlaps with some of the regions referred to above. | |||||||||||||||
| 6This category covers data supplied by respondents without a geographical breakdown | |||||||||||||||
| 7This category overlaps with the regions referred to above and covers Andorra, Antigua and Barbuda, Anguilla, Netherlands Antilles, Barbados, Bahrain, Bermuda, Bahamas, Belize, Cook Islands, Curacao, Dominica, | |||||||||||||||
| Grenada, Guernsey, Gibraltar, Hong Kong, Isle of Man, Jersey, Jamaica, St. Kitts and Nevis, Cayman Islands, Lebanon, Saint Lucia, Liechtenstein, Liberia, Marshall Islands, Montserrat, Panama, Philippines, | |||||||||||||||
| Singapore, St Maarten, Turks and Caicos Islands, Saint Vincent and the Grenadines, Maldives, Nauru, Niue, British Virgin Islands, US Virgin Islands, Vanuatu, Samoa. | |||||||||||||||
| *Data suppressed for confidentiality reasons. | |||||||||||||||
| Table 5 Direct Investment1 Flows Abroad Classified by Activity2 of Resident Investor | € million | |||||||||||||||
| Sector | NACE 2 | 2012 2 | 2013 2 | 2014 2 | 2015 | |||||||||||
| Total | of which: | Total | of which: | Total | of which: | Total | of which: | |||||||||
| Section & Division | EU 284 | EMU 195 | EU 284 | EMU 195 | EU 284 | EMU 195 | EU 284 | EMU 195 | ||||||||
| All Industries | 17,562 | -278 | -2,527 | 22,118 | 21,188 | 4,457 | 31,231 | 40,075 | 40,755 | 149,937 | 63,241 | 61,461 | ||||
| of which: | ||||||||||||||||
| Agriculture, Forestry and Fishing; Mining and Quarrying; Construction | A, B & F | * | * | * | * | * | * | * | * | * | * | * | * | |||
| Total Manufacturing Sector | C | 7,200 | 373 | 342 | 8,706 | 5,472 | 595 | 3,472 | 1,234 | 3,565 | 4,297 | 368 | -367 | |||
| Food, beverages and tobacco products | 10, 11 & 12 | 649 | * | * | 5,016 | * | * | -1,451 | -2,165 | * | -120 | * | * | |||
| Textiles and wood | 13, 14 & 16 - 18 | * | * | * | * | * | * | * | 346 | * | * | * | * | |||
| Basic pharmaceutical products and preparations | 21 | * | * | * | -1,937 | * | 325 | * | * | * | 3,163 | * | -234 | |||
| Other manufacturing n.e.s. | 7,185 | -313 | -222 | * | 382 | 275 | -89 | * | -757 | * | 699 | 245 | ||||
| Electricity, Gas, Steam and Air Conditioning supply | D | * | * | * | * | * | * | * | * | * | * | * | * | |||
| Total Services Sector | 45 - 99 | 10,951 | 188 | -1,664 | 13,489 | 13,684 | 1,870 | 26,073 | 38,472 | 36,606 | 143,322 | 62,116 | 61,199 | |||
| Wholesale and retail trade; Repairs of motor vehicles | G | 1,641 | 150 | -21 | 825 | 236 | 154 | 548 | 494 | 268 | 1,492 | -1,430 | 459 | |||
| Transportation and storage | H | * | * | * | * | * | * | * | * | * | * | * | 0 | |||
| Information and communication | J | * | 17 | -8 | 2,806 | * | * | 2,096 | * | * | 2,563 | * | -45 | |||
| Financial and insurance activities | K | 1,013 | 754 | 105 | 1,766 | 2,409 | 1,065 | -8,748 | -11,904 | * | * | 4,692 | -304 | |||
| of which: | ||||||||||||||||
| Activities of holding companies | 64.2 | 822 | 703 | 493 | -401 | 323 | * | 26 | 38 | 35 | 317 | 14 | * | |||
| Other service activities 6 | 3,602 | * | * | * | * | 301 | * | 45,971 | 37,315 | 91,787 | * | 61,089 | ||||
| 1Data are provided according to arithmetic sign conventions e.g. minus signs are used in cases where there is withdrawal of investment. | ||||||||||||||||
| 2The activity classification used in this release is the NACE Rev. 2 classification. | ||||||||||||||||
| 3Revised | ||||||||||||||||
| 4For analytical purposes, additional details are given of transactions between residents of Ireland and residents of the EU28 area. | ||||||||||||||||
| 5The relevant EMU countries are: Austria, Belgium, Cyprus, Estonia, Finland, France, Germany, Greece, Italy, Latvia, Lithuania, Luxembourg, Malta, Netherlands, Portugal, Slovakia, Slovenia and Spain. | ||||||||||||||||
| 6This covers residual FDI service activity. | ||||||||||||||||
| *Data suppressed for confidentiality reasons. | ||||||||||||||||
| Table 6 Direct Investment1 Flows into Ireland Classified by Activity2 of Resident Enterprise | € million | ||||||||||||||||||||||||||||
| Sector | NACE 2 | 2012 3 | 2013 3 | 2014 3 | 2015 | ||||||||||||||||||||||||
| Total | of which: | Total | of which: | Total | of which: | Total | of which: | ||||||||||||||||||||||
| Section & Division | United States | Japan | EU 284 | EMU 195 | Offshore Centres | United States | Japan | EU 284 | EMU 195 | Offshore Centres | United States | Japan | EU 284 | EMU 195 | Offshore Centres | United States | Japan | EU 284 | EMU 195 | Offshore Centres | |||||||||
| All Industries | 36,520 | 3,745 | 1,199 | 23,184 | 19,723 | 4,044 | 35,114 | 8,996 | -1,281 | 20,625 | 19,066 | 6,648 | 28,200 | 6,257 | 1,842 | 13,148 | 15,779 | 10,293 | 169,809 | 100,134 | -1,207 | 37,266 | 40,537 | 38,094 | |||||
| Agriculture, Forestry and Fishing; Mining and Quarrying; Construction | A, B & F | * | * | 0 | * | * | 0 | * | * | 0 | * | * | 0 | * | * | 0 | * | * | 0 | * | * | 0 | * | * | * | ||||
| Total Manufacturing Sector | C | 9,452 | 1,083 | 58 | 10,589 | 11,715 | -1,779 | 13,282 | 4,901 | 48 | 7,198 | 7,887 | 936 | 1,543 | 213 | * | 1,093 | -2,733 | 3,603 | 14,554 | -543 | -1,049 | 2,071 | 5,769 | 23,845 | ||||
| Food, beverages and tobacco products | 10, 11 & 12 | 430 | -494 | * | 77 | 973 | 546 | 4,848 | * | * | 4,998 | 5,206 | * | -2,830 | * | 0 | -3,444 | -3,341 | * | 194 | * | -1 | 1,010 | 944 | -152 | ||||
| Textiles and wood | 13, 14 & 16 - 18 | * | 0 | 0 | * | * | * | * | 0 | 0 | * | * | 0 | * | 0 | 0 | * | * | 0 | * | 0 | 0 | * | * | 0 | ||||
| Basic pharmaceutical products and preparations | 21 | 145 | -48 | * | 1,413 | 918 | 207 | -1,758 | -1,145 | -29 | -1,052 | -428 | 244 | 4,211 | -1,426 | * | 2,133 | 2,468 | * | 3,865 | -677 | -165 | 1,007 | 1,461 | 3,152 | ||||
| Other manufacturing n.e.s. | * | 1,625 | * | * | * | * | * | * | * | * | * | * | * | * | * | * | * | * | * | * | -883 | * | * | 20,845 | |||||
| Electricity, Gas, Steam and Air Conditioning supply | D | * | * | 0 | * | * | 0 | * | * | 0 | * | * | 0 | * | * | * | * | * | 0 | * | * | 0 | * | * | * | ||||
| Total Services Sector | 45 - 99 | 27,535 | 2,654 | 1,143 | 13,078 | 8,012 | 5,824 | 21,648 | 4,088 | -1,328 | 13,260 | 11,193 | 5,713 | 27,165 | 6,035 | 751 | 12,581 | 18,504 | 6,688 | 155,207 | 100,666 | -158 | 35,209 | 34,796 | 14,257 | ||||
| Wholesale and retail trade; Repairs of motor vehicles | G | 1,272 | 1,671 | 62 | 332 | 251 | 72 | -778 | -802 | -253 | 745 | 1,639 | 35 | 2,256 | * | * | -319 | -1,750 | 385 | 2,589 | -142 | * | 981 | 678 | 2,682 | ||||
| Transportation and storage | H | * | * | 0 | * | * | 0 | * | 0 | 0 | * | * | 0 | * | 0 | 0 | * | * | 0 | * | 0 | 0 | * | * | 0 | ||||
| Information and communication | I | 7,386 | 4,149 | -35 | -837 | -915 | 4,039 | 1,706 | -5,132 | 2 | 3,891 | 3,499 | 2,618 | 4,480 | 698 | * | -310 | -530 | 4,162 | 6,772 | * | * | 2,153 | 1,497 | 2,433 | ||||
| Financial intermediation | 64 | 15,333 | -6,562 | * | 14,595 | 11,508 | 3,010 | 16,391 | 8,777 | * | 5,852 | 4,635 | 2,893 | -129 | 2,198 | 550 | -290 | 7,316 | -3,584 | 69,707 | 79,111 | -39 | -23,918 | -6,629 | 7,322 | ||||
| of which: | |||||||||||||||||||||||||||||
| Activities of holding companies | 64.2 | 5,074 | * | 0 | * | 133 | 486 | -689 | -133 | * | * | 41 | 336 | -112 | * | * | * | * | -111 | 3,047 | * | * | * | * | 875 | ||||
| Insurance, reinsurance and pension funding | 65 | 1,493 | 2,690 | 101 | -664 | 159 | -884 | 1,337 | 887 | -103 | 254 | 364 | -27 | 1,009 | 432 | 31 | 295 | 703 | 541 | -453 | -1,118 | -101 | 2,617 | 1,796 | -834 | ||||
| Other financial activities | 66 | 1,728 | * | 0 | * | * | * | 617 | * | 0 | 626 | * | * | * | * | * | * | * | * | 541 | * | 0 | 688 | 665 | * | ||||
| Other services activities | * | 541 | * | -1,760 | -4,387 | * | * | * | * | * | 474 | * | 15,335 | * | 89 | 9,085 | 8,605 | * | * | * | 47 | * | * | * | |||||
| 1Data are provided according to arithmetic sign conventions. e.g. minus signs are used in cases where there is withdrawal of investment. | |||||||||||||||||||||||||||||
| 2The activity classification used in this release is the NACE Rev. 2 classification. | |||||||||||||||||||||||||||||
| 3Revised | |||||||||||||||||||||||||||||
| 4For analytical purposes, additional details are given of transactions between residents of Ireland and residents of the EU28 area. | |||||||||||||||||||||||||||||
| 5The relevant EMU countries are: Austria, Belgium, Cyprus, Estonia, Finland, France, Germany, Greece, Italy, Latvia, Lithuania, Luxembourg, Malta, Netherlands, Portugal, Slovakia, Slovenia and Spain | |||||||||||||||||||||||||||||
| *Data suppressed for confidentiality reasons. | |||||||||||||||||||||||||||||
| Table 7 Direct Investment1 Abroad End Year Positions Classified by Activity2 of Resident Investor | € million | |||||||||||||||
| Sector | NACE 2 | 2012 3 | 2013 3 | 2014 3 | 2015 | |||||||||||
| Total | of which: | Total | of which: | Total | of which: | Total | of which: | |||||||||
| Section & Division | EU 284 | EMU 195 | EU 284 | EMU 195 | EU 284 | EMU 195 | EU 284 | EMU 195 | ||||||||
| All Industries | 312,304 | 194,187 | 126,240 | 387,987 | 244,293 | 155,351 | 510,178 | 353,805 | 251,368 | 815,202 | 617,004 | 500,962 | ||||
| of which: | ||||||||||||||||
| Agriculture, Forestry and Fishing; Mining and Quarrying; Construction | A, B & F | * | * | * | * | * | * | * | * | * | * | * | * | |||
| Total Manufacturing Sector | C | 33,244 | 16,033 | 12,327 | 45,400 | 25,252 | 16,117 | 46,674 | 31,114 | 24,506 | 56,188 | 23,810 | 15,986 | |||
| Food, beverages and tobacco products | 8,024 | * | * | 15,392 | 11,406 | * | 15,333 | 10,556 | * | 20,377 | * | * | ||||
| Textiles and wood | 10, 11 & 12 | * | * | * | * | * | * | * | * | * | * | * | * | |||
| Basic pharmaceutical products and preparations | 13, 14 & 16 - 18 | 1,926 | * | * | 2,410 | * | 3,244 | 11,356 | * | * | 5,001 | * | * | |||
| Other manufacturing n.e.s. | 21 | * | 3,930 | 1,480 | * | * | 1,421 | * | 3,190 | 564 | * | 2,940 | 104 | |||
| Electricity, Gas, Steam and Air Conditioning supply | D | * | * | * | * | * | * | * | * | * | * | * | * | |||
| Total Services Sector | 45 - 99 | 263,251 | 171,317 | 109,642 | 327,731 | 211,456 | 134,127 | 445,644 | 314,687 | 220,589 | 733,304 | 582,903 | 476,557 | |||
| Wholesale and retail trade; Repairs of motor vehicles | G | 13,045 | 5,988 | 962 | 13,858 | 6,889 | 1,034 | 18,685 | 9,885 | 3,026 | 14,361 | 6,711 | 2,702 | |||
| Transportation and storage | H | * | 116 | 313 | * | 128 | * | * | * | * | * | * | * | |||
| Information and communication | I | 1,039 | 378 | 342 | 1,380 | 565 | 670 | 1,293 | 715 | * | 4,351 | 1,412 | * | |||
| Financial and insurance activities | K | 55,994 | 48,195 | 34,246 | 44,358 | 37,105 | 16,594 | 37,559 | 24,703 | 10,973 | 86,442 | 31,131 | 10,928 | |||
| of which: | ||||||||||||||||
| Activities of holding companies | 64.2 | 25,162 | 21,524 | 20,233 | 8,583 | 3,443 | 2,983 | 8,403 | 2,610 | 2,087 | 8,554 | 1,926 | 1,337 | |||
| Other service activities 6 | * | 116,640 | 73,779 | * | 166,769 | * | * | * | 205,896 | * | * | 462,320 | ||||
| 1The sign convention used is: for year-end positions 'Abroad', an entry without sign indicates a net asset position, while a minus sign indicates a net liability position. | ||||||||||||||||
| 2The activity classification used in this release is the NACE Rev. 2 classification. | ||||||||||||||||
| 3Revised | ||||||||||||||||
| 4For analytical purposes, additional details are given of transactions between residents of Ireland and residents of the EU28 area. | ||||||||||||||||
| 5The relevant EMU countries are: Austria, Belgium, Cyprus, Estonia, Finland, France, Germany, Greece, Italy, Latvia, Lithuania, Luxembourg, Malta, Netherlands, Portugal, Slovakia, Slovenia and Spain. | ||||||||||||||||
| 6This covers residual FDI service activity. | ||||||||||||||||
| *Data suppressed for confidentiality reasons. | ||||||||||||||||
| Table 8 Direct Investment1 in Ireland End year Positions Classified by Activity2 of Resident Enterprise | € million | |||||||||||||||||||||||||||
| Sector | NACE 2 | 2012 3 | 2013 3 | 2014 3 | 2015 | |||||||||||||||||||||||
| Total | of which: | Total | of which: | Total | of which: | Total | of which: | |||||||||||||||||||||
| Section & Division | United States | Japan | EU 284 | EMU 195 | Offshore Centres | United States | Japan | EU 284 | EMU 195 | Offshore Centres | United States | Japan | EU 284 | EMU 195 | Offshore Centres | United States | Japan | EU 284 | EMU 195 | Offshore Centres | ||||||||
| All Industries | 290,466 | 21,624 | 1,324 | 211,330 | 163,158 | 38,465 | 296,412 | 28,630 | 72 | 219,344 | 167,987 | 34,695 | 342,700 | 17,865 | 2,282 | 239,460 | 195,544 | 58,568 | 795,644 | 366,764 | 1,666 | 312,391 | 274,306 | 96,995 | ||||
| Agriculture, Forestry and Fishing | A | * | * | 0 | * | * | 0 | * | * | 0 | * | * | 0 | * | * | 0 | * | * | 0 | * | * | 0 | * | * | 0 | |||
| Mining and Quarrying; Construction | B | * | * | 0 | * | * | 0 | * | * | 0 | * | * | 0 | * | * | 0 | * | * | 0 | * | 0 | 0 | * | * | * | |||
| Total Manufacturing | C | 69,236 | 3,806 | -381 | 56,419 | 55,007 | 5,402 | 81,236 | 12,115 | -157 | 61,669 | 60,152 | 3,909 | 78,024 | 2,655 | * | 57,864 | 51,626 | 16,957 | 341,342 | * | 153 | * | 60,596 | * | |||
| Food, beverages and tobacco products | 10, 11 & 12 | 4,219 | -489 | * | 1,823 | 3,670 | 3,620 | 9,576 | -5 | 0 | 6,928 | 7,979 | 4,083 | 6,026 | 139 | 0 | 3,361 | 4,249 | 5,802 | 5,682 | * | 0 | 4,035 | 5,257 | * | |||
| Textiles and wood | 13, 14 & 16 - 18 | * | 0 | 0 | * | * | * | * | 0 | 0 | * | * | 0 | * | 0 | 0 | * | * | 0 | * | 0 | 0 | * | * | 0 | |||
| Basic pharmaceutical products and preparations | 21 | 36,671 | 1,161 | -233 | 32,651 | 31,585 | 1,227 | 36,347 | 915 | * | 32,097 | 31,457 | 1,514 | 45,592 | -1,090 | 65 | 38,030 | 37,003 | 6,685 | * | * | 69 | * | 41,755 | * | |||
| Metal and mechanical products | 24, 25, 26 & 28 | 6,398 | 619 | * | 8,755 | 8,959 | -2,796 | 7,517 | 366 | * | 9,546 | 10,146 | -2,521 | 7,054 | 288 | * | 10,928 | 7,584 | * | * | * | * | 13,420 | 13,088 | * | |||
| Other manufacturing | * | 2,515 | -135 | * | * | * | * | 10,839 | -32 | * | * | 833 | * | 3,318 | -9 | * | * | * | * | * | * | * | * | * | ||||
| Electricity, Gas, Steam and Air Conditioning supply | D | * | 0 | 0 | * | 0 | 0 | * | 0 | 0 | * | 0 | 0 | 1,086 | 0 | * | * | * | 0 | 1,184 | 0 | 0 | 1,184 | * | 0 | |||
| Total Services Sector | 45 - 99 | 220,109 | 17,817 | 1,706 | 153,792 | 108,031 | 33,063 | 213,831 | 16,514 | 230 | 156,332 | 107,760 | 30,785 | 263,334 | 15,210 | 1,306 | 180,202 | 143,630 | 41,611 | 452,938 | * | 1,513 | 249,379 | 213,445 | * | |||
| Wholesale and retail trade; Repairs of motor vehicles | G | 11,239 | 3,580 | -56 | 7,607 | 6,848 | 2,219 | 10,122 | * | -321 | 9,075 | 9,242 | 2,197 | 16,553 | * | * | 8,136 | 7,402 | 5,590 | 15,977 | * | * | 12,189 | 10,804 | * | |||
| Information and communication | I | 13,230 | 6,644 | * | 2,612 | 2,758 | 4,831 | 12,509 | 937 | * | 7,457 | 7,197 | 4,331 | 14,610 | 5,511 | -5 | 4,923 | 4,497 | 4,352 | 21,552 | 7,657 | * | 5,669 | 4,929 | 8,132 | |||
| Financial intermediation | 64 | 102,633 | -6,970 | * | 89,370 | 64,263 | 14,096 | 109,216 | -1,378 | * | 88,275 | 60,964 | 16,945 | 118,308 | -4,804 | 288 | 95,472 | 78,507 | 20,914 | 185,194 | 75,405 | 332 | 62,771 | 72,648 | 32,595 | |||
| of which: | ||||||||||||||||||||||||||||
| Activities of holding companies | 64.2 | 14,936 | * | * | 9,773 | 8,618 | 2,976 | 10,054 | * | * | 4,366 | 3,239 | 3,529 | 18,940 | * | * | 3,678 | 3,536 | 5,086 | 21,521 | * | * | * | * | 6,597 | |||
| Insurance services | 65 | 28,560 | 3,563 | 242 | 16,043 | 12,881 | 6,508 | 20,555 | 4,364 | 36 | 13,193 | 10,667 | 1,823 | 21,477 | 5,537 | * | 12,544 | 11,278 | 2,467 | 21,534 | 5,595 | 5 | 14,350 | 12,313 | 1,651 | |||
| Administrative and support activities | N | 49,767 | * | * | 31,323 | 15,317 | 4,725 | 45,936 | * | 858 | 27,284 | 9,951 | 4,449 | 63,760 | 2,460 | 1,204 | 33,161 | 17,484 | 6,553 | 89,830 | * | 1,425 | 54,070 | * | * | |||
| Other services activities | 14,680 | * | -1 | 6,837 | 5,964 | 684 | 15,493 | * | 1 | 11,048 | 9,739 | 1,040 | 28,626 | * | -48 | 25,966 | 24,462 | 1,735 | 118,851 | * | -46 | 100,330 | * | * | ||||
| 1The sign convention used is: for year-end positions 'In Ireland' an entry without sign indicates a net liability position, while a minus sign indicates a net asset position. | ||||||||||||||||||||||||||||
| 2The activity classification used in this release is the NACE Rev. 2 classification. | ||||||||||||||||||||||||||||
| 3Revised | ||||||||||||||||||||||||||||
| 4For analytical purposes, additional details are given of transactions between residents of Ireland and residents of the EU28 area. | ||||||||||||||||||||||||||||
| 5The relevant EMU countries are: Austria, Belgium, Cyprus, Estonia, Finland, France, Germany, Greece, Italy, Latvia, Lithuania, Luxembourg, Malta, Netherlands, Portugal, Slovakia, Slovenia and Spain. | ||||||||||||||||||||||||||||
| *Data suppressed for confidentiality reasons. | ||||||||||||||||||||||||||||
| Table 9 Direct Investment Income1 Flows Classified by Geographic Location of Creditor/Debtor | € million | ||||||||||||||
| Region/Country | 2012 2 | 2013 2 | 2014 2 | 2015 | |||||||||||
| Inflows | Outflows | Net | Inflows | Outflows | Net | Inflows | Outflows | Net | Inflows | Outflows | Net | ||||
| Europe | 8,099 | 25,757 | -17,658 | 11,113 | 23,611 | -12,498 | 12,613 | 24,329 | -11,716 | 13,063 | 42,073 | -29,010 | |||
| of which: | |||||||||||||||
| Belgium | -38 | 693 | -731 | -10 | 926 | -936 | * | 961 | * | 7 | 1,258 | -1,251 | |||
| France | 156 | 1,585 | -1,429 | 147 | 1,714 | -1,567 | 157 | 1,944 | -1,787 | 88 | 2,135 | -2,047 | |||
| Germany | 68 | 981 | -913 | 80 | 766 | -686 | 49 | 707 | -658 | 140 | 670 | -530 | |||
| Italy | 28 | 1,347 | -1,319 | 35 | 1,573 | -1,538 | 25 | 1,517 | -1,492 | -80 | 1,648 | -1,728 | |||
| Luxembourg | 3,488 | 2,541 | 947 | 5,330 | 3,615 | 1,715 | 6,031 | 3,892 | 2,139 | 7,554 | 3,720 | 3,834 | |||
| Netherlands | 2,029 | 9,273 | -7,244 | 2,073 | 7,361 | -5,288 | 2,528 | 7,688 | -5,160 | 2,214 | 11,898 | -9,684 | |||
| Spain | 28 | 701 | -673 | 20 | 745 | -725 | 30 | 614 | -584 | 16 | 284 | -268 | |||
| Switzerland | * | 5,552 | * | * | 4,424 | * | * | 3,992 | * | -193 | 5,719 | -5,912 | |||
| United Kingdom | 1,085 | 1,789 | -704 | 1,156 | 1,774 | -618 | 1,157 | 2,420 | -1,263 | 909 | 3,120 | -2,211 | |||
| EU 283 | 7,350 | 19,662 | -12,312 | 9,931 | 18,975 | -9,044 | 11,311 | 19,942 | -8,631 | 12,593 | 25,203 | -12,610 | |||
| EMU 194 | 5,779 | 17,312 | -11,533 | 7,695 | 16,862 | -9,167 | 9,166 | 17,284 | -8,118 | 10,380 | 21,785 | -11,405 | |||
| Americas | 8,542 | 18,149 | -9,607 | 6,413 | 18,129 | -11,716 | 6,546 | 18,359 | -11,813 | 5,592 | 16,983 | -11,391 | |||
| of which: | |||||||||||||||
| Canada | 26 | 303 | -277 | 18 | 45 | -27 | 96 | -17 | 113 | 42 | 20 | 22 | |||
| United States | 3,484 | 5,707 | -2,223 | 3,110 | 4,778 | -1,668 | 3,350 | 5,084 | -1,734 | 3,840 | 3,038 | 802 | |||
| Offshore centres | 4,997 | 11,490 | -6,493 | 3,178 | 13,290 | -10,112 | 2,986 | 12,284 | -9,298 | 1,642 | 13,928 | -12,286 | |||
| Asia | 695 | 440 | 255 | 725 | 338 | 387 | 657 | 295 | 362 | * | 361 | * | |||
| of which: | |||||||||||||||
| Japan | * | 124 | * | * | 136 | * | 88 | 40 | 48 | 86 | 69 | 17 | |||
| Africa | * | * | -4 | 6 | 6 | 0 | * | 8 | * | * | * | 18 | |||
| Oceania and Polar Regions | * | * | 232 | 210 | * | * | 71 | 0 | 71 | * | * | * | |||
| Not geographically allocated5 | 229 | 237 | -8 | 301 | * | * | * | 575 | * | 1,575 | 234 | 1,341 | |||
| Total | 17,791 | 44,582 | -26,791 | 18,766 | 42,588 | -23,822 | 19,849 | 43,566 | -23,717 | 15,771 | 59,705 | -43,934 | |||
| of which: | |||||||||||||||
| Offshore centres6 | 5,273 | 12,609 | -7,336 | 3,636 | 13,559 | -9,923 | 3,621 | 13,761 | -10,140 | 2,181 | 25,167 | -22,986 | |||
| 1Income on equity and other direct investment capital | |||||||||||||||
| 2Revised | |||||||||||||||
| 3For analytical purposes, additional details are given of transactions between residents of Ireland and residents of the EU28 area. | |||||||||||||||
| 4The relevant EMU countries are: Austria, Belgium, Cyprus, Estonia, Finland, France, Germany, Greece, Italy, Latvia, Lithuania, Luxembourg, Malta, Netherlands, Portugal, Slovakia, Slovenia and Spain. | |||||||||||||||
| 5This category covers data supplied by respondents without a geographical breakdown. | |||||||||||||||
| 6This category overlaps with the regions referred to above and covers Andorra, Antigua and Barbuda, Anguilla, Netherlands Antilles, Barbados, Bahrain, Bermuda, Bahamas, Belize, Cook Islands, Curacao, Dominica, | |||||||||||||||
| Grenada, Guernsey, Gibraltar, Hong Kong, Isle of Man, Jersey, Jamaica, St. Kitts and Nevis, Cayman Islands, Lebanon, Saint Lucia, Liechtenstein, Liberia, Marshall Islands, Montserrat, Maldives, Nauru, Niue, Panama, | |||||||||||||||
| Philippines , Singapore, St Maarten, Turks and Caicos Islands, Saint Vincent and the Grenadines, British Virgin Islands, US Virgin Islands, Vanuatu, Samoa. | |||||||||||||||
| *Data suppressed for confidentiality reasons. | |||||||||||||||
The Foreign Direct Investment release updates the annual statistical series on Foreign Direct Investment (FDI) flows and end-year stocks (or positions) for Ireland, broken down geographically by region and by country. The release includes tables with further analyses of the FDI flows and stocks presented by the principal economic activity (using NACE Rev.2 classification) of the resident direct investment enterprise. The statistics are methodologically consistent with the data already presented in the quarterly balance of payments and IIP releases. The statistics are also compatible with those supplied to Eurostat and the European Central Bank (ECB) and to other international organisations such as the International Monetary Fund (IMF) and the Organisation for Economic Co-operation and Development (OECD).
For more detailed methodological information see:
Methodology DocumentsForeign Direct Investment - Background Notes (PDF 215KB)
Redomiciled PLCs in the Irish Balance of Payments
 Hide Background Notes
Scan the QR code below to view this release online or go to
http://www.cso.ie/en/releasesandpublications/er/fdi/foreigndirectinvestmentannual2015/
 Show Table 1 - Direct Investment Flows Abroad Classified by Location of Investment
 Hide Table 1 - Direct Investment Flows Abroad Classified by Location of Investment