
| Environmental Transfers by Environmental Protection/Resource Management Domain | ||||||||||
| €m | % Change | % of Total | ||||||||
| Domain | 2013 | 2014 | 2015 | 2016 | 2017 | 2017/2016 | 2017 | |||
| Total transfers† | 524 | 556 | 546 | 685 | 895 | 31% | 100% | |||
| of which | ||||||||||
| Production of energy from renewable resources | 56 | 45 | 97 | 183 | 282 | 54% | 31% | |||
| Wastewater management | 137 | 159 | 172 | 199 | 230 | 15% | 26% | |||
| Protection of biodiversity and landscapes | 218 | 212 | 133 | 143 | 210 | 47% | 23% | |||
| Heat/Energy saving and management | 57 | 90 | 90 | 88 | 82 | -7% | 9% | |||
| Other | 57 | 50 | 53 | 71 | 91 | 28% | 10% | |||
| †Due to rounding, totals may not correspond precisely with the sum of the categories. | ||||||||||
In 2017, €895 million was paid in environmental subsidies and similar transfers to Irish corporations, households and public bodies, as well as to international environmental organisations under Irish government commitments (see Table 1). This was an increase of 31% on environmental transfers paid in 2016 but was lower than the €1.2 billion provided in 2008.
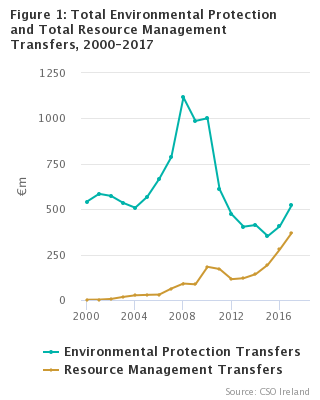
Figure 1 shows the trend in the total amount of environmental transfers allocated to environmental protection and to resource management during the period 2000-2017. The amount directed towards environmental protection peaked in 2008, then increased again after a sharp decrease, while there was a generally increasing trend in transfers to support resource management activities.
Environmental protection transfers were worth €524 million in 2017, or 59% of the total. Resource management activities received 41% of environmental transfers, worth €371 million.
|
An environmental subsidy or similar transfer is a current or capital transfer which is intended to support activities that protect the environment or reduce the use and extraction of natural resources. Environmental protection activities aim to prevent or reduce pollution and other negative impacts on the environment. Resource management activities aim to preserve natural resources against over-consumption. The classifications used are based on the UN System of Environmental-Economic Accounting and are explained in the Background Notes. |
In 2017, 31% of environmental transfers went to renewable energy production, 26% to wastewater management, 23% to biodiversity protection and 9% to heat and energy saving measures. Other activities, such as waste management and protection of air and climate, accounted for the remaining 10% (see Headline Table).
The largest subsidy to renewable energy generation in 2017 was worth €278 million and came from funds collected through the PSO (Public Service Obligation) Levy on electricity consumers (see Table 2.13A). Programmes that received substantial funding in the wastewater management and protection of biodiversity domains included Irish Water's capital investment in wastewater infrastructure (see Table 2.2), and agri-environment schemes such as the Green, Low-carbon Agri-environment Scheme (see Table 2.6).
| Protection of air and climate | Wastewater management | Waste management | Protection of soil and groundwater | Protection of biodiversity | Research and development | Noise abatement, protection against radiation and other environmental protection activities | |
| 2000 | 0.493 | 322.6377 | 9.9961 | 0.1799 | 205.6113 | 1.2867 | 1.988 |
| 2001 | 0.6734 | 402.365 | 11.8823 | 0.2139 | 164.9283 | 1.861 | 2.7522 |
| 2002 | 0.69 | 379.2484 | 14.4708 | 0.2412 | 172.9922 | 2.5049 | 2.9942 |
| 2003 | 0.7662 | 324.3254 | 18.6921 | 0.1612 | 185.3812 | 3.2726 | 2.224 |
| 2004 | 1.7252 | 266.6845 | 22.5113 | 0.4738 | 210.5761 | 3.6586 | 2.4641 |
| 2005 | 2.51 | 246.5488 | 26.4454 | 0.5681 | 286.5262 | 3.5075 | 2.5715 |
| 2006 | 6.1885 | 283.1498 | 28.6338 | 8.0543 | 334.3038 | 3.6534 | 3.9284 |
| 2007 | 13.8349 | 403.5382 | 33.0119 | 9.7543 | 317.6122 | 6.6113 | 3.2526 |
| 2008 | 23.3008 | 675.1116 | 34.3975 | 46.7245 | 325.4629 | 6.9577 | 3.7271 |
| 2009 | 4.8304 | 570.7272 | 35.7411 | 6.1681 | 356.0128 | 9.1414 | 3.428 |
| 2010 | 12.0073 | 597.7033 | 33.6843 | 5.8822 | 340.3897 | 7.851 | 3.454 |
| 2011 | 5.2493 | 268.5726 | 27.6274 | 11.7946 | 285.4424 | 7.5454 | 3.8777 |
| 2012 | 6.6553 | 161.0982 | 20.3109 | 10.982 | 264.5159 | 4.8846 | 3.9256 |
| 2013 | 4.3155 | 136.6009 | 19.8088 | 13.2728 | 217.5972 | 8.1181 | 4.1253 |
| 2014 | 6.1979 | 158.9422 | 15.0881 | 12.2122 | 212.3446 | 4.4608 | 3.761 |
| 2015 | 11.4069 | 172.0809 | 15.005 | 12.4824 | 133.085 | 4.4429 | 3.365 |
| 2016 | 24.5346 | 199.447 | 13.3073 | 15.9532 | 142.8673 | 7.1999 | 3.064 |
| 2017 | 43.473 | 230.0069 | 17.2663 | 14.2517 | 209.6358 | 6.1987 | 3.0554 |
Figure 2 shows the distribution by environmental protection domain of environmental subsidies and similar transfers. From 2000 to 2017, the majority of funding went to wastewater management and biodiversity protection activities. The peak in the graph from 2008-2010 is due to payments under the Farm Waste Management Scheme, a capital grant programme aimed at helping farmers meet the requirements of the EU Nitrates Directive by investing in animal housing and storage facilities for silage and agricultural waste. Further details of environmental protection transfers under particular programmes are provided in Tables 2.1-2.9.
| Year | Management of forest resources | Management of wild flora and fauna | Production of energy from renewable resources | Heat/Energy saving and management | Resource management research and development | Management of water, minerals; minimisation of the intake of fossil resources; other resource management activities |
|---|---|---|---|---|---|---|
| 2000 | 0.004 | 0.129 | 0 | 0 | 1.2867 | 0.14 |
| 2001 | 0 | 0.176 | 0 | 0.0831 | 1.861 | 0.14 |
| 2002 | 0.1205 | 0.368 | 0.015 | 2.6489 | 2.5049 | 0.2137 |
| 2003 | 0.09 | 1.004 | 7.9296 | 4.5119 | 3.2726 | 0.2237 |
| 2004 | 0.294 | 0.4951 | 18.2365 | 2.953 | 3.6586 | 0.2193 |
| 2005 | 0.15 | 5.2094 | 14.7138 | 4.6152 | 3.5075 | 0.1987 |
| 2006 | 0.7969 | 13.0845 | 2.1546 | 9.831 | 3.4839 | 0.6298 |
| 2007 | 2.2652 | 12.6868 | 2.8756 | 38.6837 | 5.8846 | 0.6842 |
| 2008 | 1.2457 | 35.6046 | 7.146 | 39.2036 | 6.0855 | 1.304 |
| 2009 | 0.8092 | 23.0347 | 7.3568 | 46.1774 | 7.8566 | 1.0653 |
| 2010 | 0.6463 | 1.7917 | 67.9213 | 104.151 | 7.0612 | 1.1397 |
| 2011 | 0.4145 | 1.3395 | 47.0151 | 113.5154 | 6.844 | 1.4031 |
| 2012 | 0.6105 | 1.2613 | 38.2143 | 68.0912 | 4.8846 | 1.6483 |
| 2013 | 0.4226 | 1.2073 | 55.5112 | 56.9262 | 4.397 | 1.6551 |
| 2014 | 0.2571 | 1.8018 | 44.5159 | 90.1588 | 4.1665 | 1.6814 |
| 2015 | 0.1055 | 1.2738 | 97.4549 | 89.9658 | 3.276 | 1.7097 |
| 2016 | 0.0972 | 1.6017 | 183.375 | 88.006 | 4.2536 | 1.269 |
| 2017 | 0.1445 | 1.5383 | 281.7353 | 82.1292 | 4.3313 | 1.1236 |
Figure 3 shows the distribution by resource management domain of environmental subsidies and similar transfers. Subsidies to production of energy generation from renewable sources showed a large increase each year from 2015 to 2017 due to increases in the PSO Levy subsidy to electricity generation from renewable sources. Energy efficiency programmes run by Local Authorities and the SEAI make up the other main component of resource management transfers. Full details of transfers under these and other resource management programmes can be found in Tables 2.10-2.16.
| Agriculture, forestry and fishing | Manufacturing, energy and construction | Commercial and other services | Public services | Households | |
| 2000 | 221.1983 | 6.628 | 4.3841 | 311.5421 | 0 |
| 2001 | 179.0188 | 6.1543 | 6.1915 | 395.4321 | 0.1395 |
| 2002 | 188.9607 | 7.3988 | 7.6051 | 374.9061 | 0.1422 |
| 2003 | 217.4073 | 19.4964 | 9.0905 | 305.5836 | 0.2769 |
| 2004 | 237.3267 | 30.9037 | 10.3558 | 254.0789 | 1.2852 |
| 2005 | 318.3085 | 26.7532 | 10.339 | 239.6097 | 2.0617 |
| 2006 | 377.2165 | 17.7898 | 10.8546 | 281.8213 | 10.2102 |
| 2007 | 454.1863 | 31.0686 | 16.7024 | 308.2152 | 40.4969 |
| 2008 | 783.6162 | 24.0265 | 20.6349 | 331.1636 | 46.665 |
| 2009 | 681.2236 | 18.5975 | 26.3045 | 310.6115 | 33.9467 |
| 2010 | 648.0341 | 76.5815 | 21.199 | 330.4639 | 103.6844 |
| 2011 | 325.1633 | 59.9523 | 24.5734 | 266.9871 | 102.5793 |
| 2012 | 267.1686 | 50.0134 | 18.1575 | 188.8345 | 61.9088 |
| 2013 | 220.1708 | 63.6408 | 18.6234 | 166.9065 | 53.9164 |
| 2014 | 215.6018 | 45.7756 | 16.9469 | 189.9656 | 86.3983 |
| 2015 | 139.4562 | 97.0244 | 18.6007 | 200.7822 | 88.6906 |
| 2016 | 153.2637 | 183.146 | 25.3559 | 230.8387 | 91.4715 |
| 2017 | 230.9602 | 281.5044 | 27.5516 | 271.7571 | 80.0167 |
Figure 4 shows how environmental subsidies and similar transfers were distributed to different sectors of the economy from 2000 to 2017. The agriculture, forestry and fishing sector and the public services sector were the main beneficiaries as a result of agri-environment schemes aimed at encouraging biodiversity-friendly farming, and funding of public bodies responsible for investment in wastewater management infrastructure. In more recent years, the energy industry began to receive comparable levels of subsidisation towards renewable energy generation, while transfers to the household sector were largely due to energy efficiency programmes. A detailed breakdown of environmental transfers by benefitting institutional sector and economic activity is provided in Tables 4 and 5.
| Capital Transfers | Current Transfers | |
| 2000 | 320.5505 | 223.202 |
| 2001 | 400.5136 | 186.4225 |
| 2002 | 380.9401 | 198.0726 |
| 2003 | 332.176 | 219.6786 |
| 2004 | 274.0507 | 259.8995 |
| 2005 | 259.7938 | 337.2782 |
| 2006 | 322.0935 | 375.7989 |
| 2007 | 472.1208 | 378.5748 |
| 2008 | 824.8296 | 381.4417 |
| 2009 | 666.7956 | 405.5533 |
| 2010 | 708.4736 | 475.2092 |
| 2011 | 383.5449 | 397.0962 |
| 2012 | 241.2118 | 345.8711 |
| 2013 | 196.6083 | 327.3497 |
| 2014 | 213.3159 | 342.2724 |
| 2015 | 239.7638 | 305.89 |
| 2016 | 275.9792 | 408.9966 |
| 2017 | 329.491 | 565.399 |
Since 2011, current transfers were greater than capital transfers (see Figure 5). In other words, more funding was used to support day-to-day, operating expenditure than was used for investment. In 2017, 37% of environmental transfers were capital transfers and 63% were subsidies or other current transfers. Further details are available in Tables 3 and 6.
Figure 6 shows the source of the payments. Most environmental transfers (85% in 2017) were paid by the exchequer with 15% coming from the EU in 2017 (see Table 7).
The amounts paid out under programmes run by each government department or body are presented in Table 8. The Department of Housing, Planning and Local Government; the EU; the Department of Agriculture, Food and the Marine; and the Department of Communications, Climate Action and Environment were, between them, responsible for 66% of environmental subsidies and similar transfers paid in Ireland in 2017.
| National Exchequer | EU | |
| 2000 | 76 | 24 |
| 2001 | 84 | 16 |
| 2002 | 82 | 18 |
| 2003 | 79 | 21 |
| 2004 | 76 | 24 |
| 2005 | 71 | 29 |
| 2006 | 70 | 30 |
| 2007 | 71 | 29 |
| 2008 | 63 | 37 |
| 2009 | 81 | 19 |
| 2010 | 85 | 15 |
| 2011 | 80 | 20 |
| 2012 | 74 | 26 |
| 2013 | 76 | 24 |
| 2014 | 72 | 28 |
| 2015 | 82 | 18 |
| 2016 | 86 | 14 |
| 2017 | 85 | 15 |
| Table 1 Environmental Transfers by Environmental Protection and Resource Management Domain, 2000-2017 | ||||||||||||||||||
| €000 | ||||||||||||||||||
| Environmental Protection/Resource Management Domain | 2000 | 2001 | 2002 | 2003 | 2004 | 2005 | 2006 | 2007 | 2008 | 2009 | 2010 | 2011 | 2012 | 2013 | 2014 | 2015 | 2016 | 2017 |
| 01 Protection of ambient air and climate | 493 | 673 | 690 | 766 | 1,725 | 2,510 | 6,189 | 13,835 | 23,301 | 4,830 | 12,007 | 5,249 | 6,655 | 4,316 | 6,198 | 11,407 | 24,535 | 43,473 |
| 02 Wastewater management | 322,638 | 402,365 | 379,248 | 324,325 | 266,685 | 246,549 | 283,150 | 403,538 | 675,112 | 570,727 | 597,703 | 268,573 | 161,098 | 136,601 | 158,942 | 172,081 | 199,447 | 230,007 |
| 03 Waste management | 9,996 | 11,882 | 14,471 | 18,692 | 22,511 | 26,445 | 28,634 | 33,012 | 34,398 | 35,741 | 33,684 | 27,627 | 20,311 | 19,809 | 15,088 | 15,005 | 13,307 | 17,266 |
| 04 Protection and remediation of soil, groundwater and surface water | 180 | 214 | 241 | 161 | 474 | 568 | 8,054 | 9,754 | 46,725 | 6,168 | 5,882 | 11,795 | 10,982 | 13,273 | 12,212 | 12,482 | 15,953 | 14,252 |
| 05 Noise and vibration abatement | 144 | 171 | 193 | 129 | 183 | 259 | 281 | 341 | 351 | 368 | 201 | 468 | 667 | 838 | 386 | 423 | 183 | 165 |
| 06 Protection of biodiversity and landscapes | 205,611 | 164,928 | 172,992 | 185,381 | 210,576 | 286,526 | 334,304 | 317,612 | 325,463 | 356,013 | 340,390 | 285,442 | 264,516 | 217,597 | 212,345 | 133,085 | 142,867 | 209,636 |
| 07 Protection against radiation | 287 | 291 | 299 | 208 | 410 | 438 | 1,220 | 400 | 447 | 380 | 304 | 242 | 200 | 200 | 400 | – | – | – |
| 08 Environmental protection research and development | 1,287 | 1,861 | 2,505 | 3,273 | 3,659 | 3,508 | 3,653 | 6,611 | 6,958 | 9,141 | 7,851 | 7,545 | 4,885 | 8,118 | 4,461 | 4,443 | 7,200 | 6,199 |
| 09 Other environmental protection activities | 1,557 | 2,290 | 2,502 | 1,887 | 1,871 | 1,875 | 2,427 | 2,512 | 2,929 | 2,680 | 2,949 | 3,168 | 3,059 | 3,087 | 2,975 | 2,942 | 2,881 | 2,891 |
| 10 Management of water | – | – | – | – | – | – | – | – | – | – | – | 0 | 8 | 0 | 19 | 24 | 34 | 0 |
| 11 Management of forest resources | 4 | 0 | 121 | 90 | 294 | 150 | 797 | 2,265 | 1,246 | 809 | 646 | 415 | 611 | 423 | 257 | 106 | 97 | 145 |
| 12 Management of wild flora and fauna | 129 | 176 | 368 | 1,004 | 495 | 5,209 | 13,085 | 12,687 | 35,605 | 23,035 | 1,792 | 1,340 | 1,261 | 1,207 | 1,802 | 1,274 | 1,602 | 1,538 |
| 13A Production of energy from renewable resources | – | 0 | 15 | 7,930 | 18,237 | 14,714 | 2,155 | 2,876 | 7,146 | 7,357 | 67,921 | 47,015 | 38,214 | 55,511 | 44,516 | 97,455 | 183,375 | 281,735 |
| 13B Heat/Energy saving and management | – | 83 | 2,649 | 4,512 | 2,953 | 4,615 | 9,831 | 38,684 | 39,204 | 46,177 | 104,151 | 113,515 | 68,091 | 56,926 | 90,159 | 89,966 | 88,006 | 82,129 |
| 13C Minimisation of the intake of fossil resources as raw materials | – | – | – | – | – | – | 147 | 147 | 147 | 147 | – | – | 389 | 389 | 389 | 389 | – | – |
| 14 Management of minerals | – | – | 74 | 74 | 74 | 74 | 74 | – | – | – | – | – | – | – | – | – | – | – |
| 15 Resource management research and development | 1,287 | 1,861 | 2,505 | 3,273 | 3,659 | 3,508 | 3,484 | 5,885 | 6,086 | 7,857 | 7,061 | 6,844 | 4,885 | 4,397 | 4,167 | 3,276 | 4,254 | 4,331 |
| 16 Other resource management activities | 140 | 140 | 140 | 150 | 146 | 125 | 409 | 537 | 1,157 | 918 | 1,140 | 1,403 | 1,252 | 1,266 | 1,274 | 1,297 | 1,235 | 1,124 |
| Total | 543,752 | 586,936 | 579,013 | 551,855 | 533,950 | 597,072 | 697,892 | 850,696 | 1,206,271 | 1,072,349 | 1,183,683 | 780,641 | 587,083 | 523,958 | 555,588 | 545,654 | 684,976 | 894,890 |
| – No transfers identified | ||||||||||||||||||
| Table 2.1 Environmental Transfers for the Protection of Ambient Air and Climate, 2000-2017 | ||||||||||||||||||
| €000 | ||||||||||||||||||
| Programme | 2000 | 2001 | 2002 | 2003 | 2004 | 2005 | 2006 | 2007 | 2008 | 2009 | 2010 | 2011 | 2012 | 2013 | 2014 | 2015 | 2016 | 2017 |
| Air Pollution Control (Local Authorities) | 144 | 171 | 193 | 129 | 183 | 259 | 281 | 341 | 351 | 368 | 201 | 468 | 667 | 838 | 386 | 423 | 183 | 165 |
| Aran Islands Electric Vehicle Programme | – | – | – | – | – | – | – | – | – | – | – | 75 | 85 | 77 | 9 | 0 | – | – |
| Electric Vehicle Programme | – | – | – | – | – | – | – | – | – | – | – | 198 | 771 | 252 | 1,207 | 2,644 | 3,039 | 4,272 |
| GLAS (Green, Low-carbon Agri-environment Scheme) | – | – | – | – | – | – | – | – | – | – | – | – | – | – | 0 | 1,145 | 10,262 | 19,558 |
| Geneva Convention | 15 | 20 | 21 | 22 | 24 | 25 | 28 | 25 | 34 | 36 | 35 | 37 | 40 | 57 | 16 | 41 | 42 | 38 |
| Green Schools Travel Programme | – | – | – | – | – | – | – | – | 580 | 776 | 799 | 603 | 714 | 586 | 632 | 606 | 660 | 659 |
| Low Emission Slurry Scheme (LESS) | – | – | – | – | – | – | – | – | – | – | – | – | – | – | – | – | 503 | 2,371 |
| Stockholm Convention | – | – | – | – | – | – | – | – | – | 0 | 3 | 15 | 21 | 23 | 20 | 26 | 25 | – |
| UN Framework Convention on Climate Change | 27 | 65 | 78 | 95 | 64 | 128 | 136 | 150 | 135 | 119 | 135 | 132 | 142 | 142 | 112 | 137 | 140 | 128 |
| Vehicle Registration Tax Relief on Electric Vehicles | – | 56 | 37 | 34 | 979 | 1,649 | 5,233 | 12,839 | 21,785 | 3,042 | 10,345 | 3,230 | 3,586 | 1,712 | 3,190 | 5,750 | 9,062 | 15,623 |
| Vienna Convention | 307 | 361 | 361 | 486 | 475 | 450 | 511 | 480 | 417 | 490 | 489 | 492 | 629 | 629 | 626 | 635 | 619 | 660 |
| Total | 493 | 673 | 690 | 766 | 1,725 | 2,510 | 6,189 | 13,835 | 23,301 | 4,830 | 12,007 | 5,249 | 6,655 | 4,316 | 6,198 | 11,407 | 24,535 | 43,473 |
| – Programme not in operation or no payments made | ||||||||||||||||||
| Table 2.2 Environmental Transfers for Wastewater Management, 2000-2017 | ||||||||||||||||||
| €000 | ||||||||||||||||||
| Programme | 2000 | 2001 | 2002 | 2003 | 2004 | 2005 | 2006 | 2007 | 2008 | 2009 | 2010 | 2011 | 2012 | 2013 | 2014 | 2015 | 2016 | 2017 |
| Animal Carcase Disposal Scheme | – | – | – | 106 | 29 | 82 | 28 | 53 | 57 | 32 | 25 | – | – | – | – | – | – | – |
| Capital Investment Plan (Wastewater) | – | – | – | – | – | – | – | – | – | – | – | – | – | – | 150,000 | 168,000 | 199,000 | 229,000 |
| Farm Waste Management Scheme | – | 153 | 9,388 | 20,612 | 16,684 | 19,150 | 21,358 | 113,937 | 413,738 | 292,763 | 298,149 | 32,639 | 391 | 521 | 310 | 0 | – | 41 |
| On-farm Investment: Pollution Control | 15,468 | 13,917 | 5,307 | 1,305 | 358 | 132 | 143 | – | – | – | – | – | – | – | – | – | – | – |
| Rural Wastewater Programme (Capital) | 6,628 | 5,904 | 6,770 | 10,857 | 12,388 | 10,351 | 13,032 | 21,395 | 11,141 | 9,804 | 8,682 | 10,262 | 5,304 | 6,307 | 777 | 1,146 | 212 | 199 |
| Wastewater Treatment Facilities (Local Authorities) | 5,365 | 6,377 | 7,192 | 6,247 | 7,596 | 8,315 | 9,222 | 13,604 | 10,345 | 13,027 | 7,103 | 5,529 | 5,040 | 5,377 | 7,855 | 2,935 | 235 | 767 |
| Water Services Investment Programme (Wastewater) | 295,177 | 376,014 | 350,592 | 285,199 | 229,630 | 208,520 | 239,368 | 254,550 | 239,831 | 255,102 | 283,744 | 220,143 | 150,363 | 124,396 | – | – | – | – |
| Total | 322,638 | 402,365 | 379,248 | 324,325 | 266,685 | 246,549 | 283,150 | 403,538 | 675,112 | 570,727 | 597,703 | 268,573 | 161,098 | 136,601 | 158,942 | 172,081 | 199,447 | 230,007 |
| – Programme not in operation or no payments made | ||||||||||||||||||
| Table 2.3 Environmental Transfers for Waste Management, 2000-2017 | ||||||||||||||||||
| €000 | ||||||||||||||||||
| Programme | 2000 | 2001 | 2002 | 2003 | 2004 | 2005 | 2006 | 2007 | 2008 | 2009 | 2010 | 2011 | 2012 | 2013 | 2014 | 2015 | 2016 | 2017 |
| Animal Carcase Disposal Scheme | – | – | – | 106 | 29 | 82 | 28 | 53 | 57 | 32 | 25 | – | – | – | – | – | – | – |
| Basel Convention | 8 | 10 | 13 | 11 | 11 | 37 | – | 13 | 37 | 18 | 39 | 22 | 23 | 19 | 21 | 24 | 23 | – |
| EU LIFE: HEATSUN | – | – | 74 | 74 | 74 | 74 | 74 | – | – | – | – | – | – | – | – | – | – | – |
| Fallen Animals Scheme | – | 0 | 994 | 9,552 | 9,697 | 8,117 | 8,833 | 8,921 | 9,518 | 10,694 | 6,797 | 3,358 | 2,267 | 2,311 | 2,820 | 2,005 | 2,056 | 2,682 |
| Green Health Programme | – | – | – | – | – | – | – | – | – | 100 | 100 | 165 | 120 | 98 | 65 | 131 | 160 | 140 |
| Green Hospitality Awards | – | – | – | – | – | – | – | 150 | 150 | 150 | 150 | 374 | 296 | 246 | 143 | 53 | 0 | 0 |
| Litter Management (Local Authorities) | 891 | 1,059 | 1,195 | 799 | 1,133 | 1,600 | 1,740 | 2,111 | 2,171 | 2,020 | 1,987 | 2,225 | 2,492 | 1,763 | 1,869 | 1,438 | 1,278 | 2,400 |
| Local Authority Waste Prevention Network | – | – | – | – | – | 200 | 200 | 200 | 285 | 982 | 308 | 476 | 371 | 396 | 218 | 221 | 273 | 191 |
| Packaging Prevention Programme | – | – | – | – | – | – | – | 10 | 10 | 10 | 10 | 8 | 12 | 15 | 0 | 0 | 0 | 0 |
| Recycling Facilities (Local Authorities) | 5,549 | 6,595 | 7,438 | 4,972 | 7,056 | 9,963 | 10,832 | 13,146 | 13,521 | 13,280 | 13,786 | 11,851 | 6,489 | 6,256 | 2,612 | 2,333 | 1,221 | 1,719 |
| Stop Food Waste Programme | – | – | – | – | – | – | – | – | – | 100 | 100 | 193 | 312 | 213 | 83 | – | 174 | 170 |
| Street Cleaning (Local Authorities) | 36 | 42 | 48 | 32 | 45 | 64 | 70 | 84 | 87 | 41 | 67 | 140 | 53 | 0 | 55 | 0 | 0 | 15 |
| Waste Collection Services (Local Authorities) | 520 | 618 | 696 | 466 | 661 | 933 | 1,014 | 1,231 | 1,266 | 1,435 | 1,398 | 820 | 615 | 452 | 389 | 372 | 486 | 677 |
| Waste Planning and Regulation (Local Authorities) | 2,994 | 3,558 | 4,013 | 2,683 | 3,807 | 5,375 | 5,844 | 7,093 | 7,295 | 6,880 | 8,518 | 7,996 | 7,262 | 8,040 | 6,813 | 8,030 | 7,636 | 9,274 |
| Waste Processing Facilities Scheme | – | – | – | – | – | – | 0 | 0 | 0 | 0 | 400 | 0 | – | – | – | 400 | – | – |
| Total | 9,996 | 11,882 | 14,471 | 18,692 | 22,511 | 26,445 | 28,634 | 33,012 | 34,398 | 35,741 | 33,684 | 27,627 | 20,311 | 19,809 | 15,088 | 15,005 | 13,307 | 17,266 |
| – Programme not in operation or no payments made | ||||||||||||||||||
| Table 2.4 Environmental Transfers for the Protection and Remediation of Soil, Groundwater and Surface Water, 2000-2017 | ||||||||||||||||||
| €000 | ||||||||||||||||||
| Programme | 2000 | 2001 | 2002 | 2003 | 2004 | 2005 | 2006 | 2007 | 2008 | 2009 | 2010 | 2011 | 2012 | 2013 | 2014 | 2015 | 2016 | 2017 |
| Contaminated Soil Forum | – | – | – | – | – | – | 7 | – | – | 7 | 0 | – | – | – | – | – | – | – |
| EU LIFE: Duck Slurry | – | – | – | – | 245 | 245 | – | – | – | – | – | – | – | – | – | – | – | – |
| Landfill Remediation | – | – | – | – | – | – | 7,696 | 9,328 | 46,286 | 5,346 | 3,526 | 1,001 | 3,300 | 8,598 | 7,673 | 4,506 | 7,816 | 5,721 |
| Landfill Remediation (Environment Fund) | – | – | – | – | – | – | – | – | – | – | – | 6,002 | 4,110 | – | – | – | – | – |
| Operation and Aftercare of Landfill (Local Authorities) | 180 | 214 | 241 | 161 | 229 | 323 | 351 | 426 | 439 | 362 | 397 | 499 | 254 | 121 | 112 | 7 | 98 | 306 |
| Organic Farming Scheme | – | – | – | – | – | – | – | – | – | 453 | 1,959 | 4,293 | 3,318 | 4,554 | 4,427 | 7,969 | 8,039 | 8,225 |
| Total | 180 | 214 | 241 | 161 | 474 | 568 | 8,054 | 9,754 | 46,725 | 6,168 | 5,882 | 11,795 | 10,982 | 13,273 | 12,212 | 12,482 | 15,953 | 14,252 |
| – Programme not in operation or no payments made | ||||||||||||||||||
| Table 2.5 Environmental Transfers for Noise and Vibration Abatement, 2000-2017 | ||||||||||||||||||
| €000 | ||||||||||||||||||
| Programme | 2000 | 2001 | 2002 | 2003 | 2004 | 2005 | 2006 | 2007 | 2008 | 2009 | 2010 | 2011 | 2012 | 2013 | 2014 | 2015 | 2016 | 2017 |
| Noise Pollution Control (Local Authorities) | 144 | 171 | 193 | 129 | 183 | 259 | 281 | 341 | 351 | 368 | 201 | 468 | 667 | 838 | 386 | 423 | 183 | 165 |
| Total | 144 | 171 | 193 | 129 | 183 | 259 | 281 | 341 | 351 | 368 | 201 | 468 | 667 | 838 | 386 | 423 | 183 | 165 |
| Table 2.6 Environmental Transfers for the Protection of Biodiversity and Landscapes, 2000-2017 | ||||||||||||||||||
| €000 | ||||||||||||||||||
| Programme | 2000 | 2001 | 2002 | 2003 | 2004 | 2005 | 2006 | 2007 | 2008 | 2009 | 2010 | 2011 | 2012 | 2013 | 2014 | 2015 | 2016 | 2017 |
| AEOS (Agri-Environment Options Scheme) | – | – | – | – | – | – | – | – | – | – | 0 | 12,190 | 53,785 | 58,148 | 60,767 | 79,801 | 32,624 | 16,197 |
| Burren Farming for Conservation Programme | – | – | – | – | – | – | – | – | – | – | 639 | 958 | 1,147 | 1,059 | 1,044 | 1,031 | 1,181 | 905 |
| Cartagena Biosafety Protocol | – | – | – | – | – | 28 | 10 | 7 | 10 | 11 | 0 | 24 | 0 | 14 | 13 | 15 | 15 | 11 |
| Cessation of Turf-Cutting Compensation Scheme | – | – | – | – | – | – | – | – | – | – | – | 45 | 3,497 | 3,982 | 4,173 | 4,022 | 4,390 | 4,251 |
| Chalara (Reconstitution of Woodlands) Scheme | – | – | – | – | – | – | – | – | – | – | – | 0 | 0 | 277 | 510 | 275 | 179 | 324 |
| Chough, Goose and Wader Farm Plan Schemes | – | – | – | – | – | – | 42 | 76 | 32 | 48 | 318 | 362 | 353 | 236 | 320 | 369 | 372 | 340 |
| Corncrake Farm Plan Scheme | – | – | – | – | – | – | – | – | 928 | 528 | 189 | 203 | 314 | 142 | 60 | 40 | 43 | 60 |
| Corncrake Grant Scheme | – | – | – | – | – | – | – | – | – | – | 205 | 188 | 208 | 226 | 175 | 716 | 181 | 106 |
| Data Collection Scheme | – | – | – | – | – | – | – | – | – | – | – | – | – | – | – | – | 5,145 | 4,852 |
| EU LIFE: AranLIFE | – | – | – | – | – | – | – | – | – | – | – | – | – | – | 487 | 487 | 487 | 487 |
| EU LIFE: Blackwater SAMOK | – | – | – | – | – | – | – | – | – | – | – | 187 | 187 | 187 | 187 | 187 | – | – |
| EU LIFE: Blanket Bog Project | – | – | 90 | 803 | 807 | 359 | 362 | 696 | – | – | – | – | – | – | – | – | – | – |
| EU LIFE: BurrenLIFE | – | – | – | – | – | 335 | 335 | 335 | 335 | 335 | – | – | – | – | – | – | – | – |
| EU LIFE: CAISIE | – | – | – | – | – | – | – | – | – | 185 | 185 | 185 | 185 | – | – | – | – | – |
| EU LIFE: GeoparkLIFE | – | – | – | – | – | – | – | – | – | – | – | – | – | 222 | 222 | 222 | 222 | 222 |
| EU LIFE: Golden Eagle | – | 21 | 21 | 21 | 21 | 21 | – | – | – | – | – | – | – | – | – | – | – | – |
| EU LIFE: KerryLIFE | – | – | – | – | – | – | – | – | – | – | – | – | – | – | 228 | 456 | 456 | 456 |
| EU LIFE: MulkearLIFE | – | – | – | – | – | – | – | – | – | 174 | 174 | 174 | 174 | 174 | – | – | – | – |
| EU LIFE: Raised Bog Project | – | – | – | – | 22 | 304 | 458 | 292 | 386 | – | – | 258 | 258 | 258 | 258 | 258 | 811 | 811 |
| EU LIFE: RaptorLIFE | – | – | – | – | – | – | – | – | – | – | – | – | – | – | – | 342 | 342 | 342 |
| EU LIFE: Restoring Priority Woodland | – | – | – | – | – | – | 127 | 344 | 414 | 589 | – | – | – | – | – | – | – | – |
| EU LIFE: Roseate Tern | – | – | – | – | – | – | – | – | – | – | – | – | – | – | – | – | 208 | 208 |
| EU LIFE: Termoncarragh | – | 117 | 117 | 117 | 117 | 117 | – | – | – | – | – | – | – | – | – | – | – | – |
| EU LIFE: Waterbirds | – | – | – | 320 | 320 | 320 | 320 | 320 | – | – | – | – | – | – | – | – | – | – |
| Forest Environment Protection Scheme | – | – | – | – | – | – | – | 1,741 | 7,079 | 11,250 | 11,538 | 4,652 | 2,390 | 1,387 | 431 | 6 | – | – |
| GLAS (Green, Low-carbon Agri-environment Scheme) | – | – | – | – | – | – | – | – | – | – | – | – | – | – | 0 | 10,308 | 92,354 | 176,025 |
| Hen Harrier Farm Plan Scheme | – | – | – | – | – | – | – | – | 559 | 1,037 | 2,518 | 2,793 | 2,565 | 2,308 | 2,185 | 828 | 109 | 23 |
| Heritage Council Biodiversity Grants | – | – | – | – | – | 97 | 401 | 402 | 580 | 269 | 212 | 120 | 84 | 162 | 213 | 228 | 419 | 312 |
| Marine Biodiversity Scheme | – | – | – | – | – | – | – | – | – | 1,000 | 750 | 643 | 496 | 333 | 330 | 559 | 427 | 1,780 |
| National Biodiversity Data Centre | – | – | – | – | – | 3 | 102 | 611 | 830 | 709 | 570 | 590 | 655 | 749 | 683 | 705 | 790 | 818 |
| Native Woodland Conservation Scheme | 4 | 0 | 121 | 90 | 294 | 150 | 650 | 1,882 | 862 | 426 | 410 | 415 | 611 | 423 | 257 | 106 | 97 | 145 |
| Native Woodland Establishment Scheme | – | – | – | – | – | – | – | 35 | 431 | 1,418 | 722 | 158 | 72 | 232 | 504 | 0 | – | – |
| Natterjack Toad Scheme | – | – | – | – | – | – | – | – | 25 | 40 | 50 | 50 | 50 | 50 | 50 | 50 | 50 | 38 |
| Neighbourwood | – | – | 72 | 83 | 59 | 120 | 80 | 30 | 231 | 268 | 72 | 141 | 174 | 59 | 2 | 0 | 67 | 52 |
| OSPAR Convention | 14 | 18 | 18 | 17 | 19 | 19 | 20 | 46 | 42 | 38 | 39 | 60 | 47 | 49 | 0 | 0 | – | – |
| Owenduff, Twelve Bens and Other Farm Plan Schemes | – | – | – | – | – | – | 333 | 83 | 525 | 830 | 1,219 | 1,498 | 1,275 | 1,064 | 307 | 67 | 56 | 30 |
| REPS (Rural Environment Protection Scheme) | 205,593 | 164,773 | 172,555 | 183,931 | 208,918 | 284,654 | 331,065 | 310,713 | 312,194 | 336,861 | 320,580 | 259,551 | 195,990 | 145,856 | 138,940 | 32,009 | 1,844 | 92 |
| Traditional Buildings Scheme | – | – | – | – | – | – | – | – | – | – | – | – | – | – | – | – | – | 752 |
| Total | 205,611 | 164,928 | 172,992 | 185,381 | 210,576 | 286,526 | 334,304 | 317,612 | 325,463 | 356,013 | 340,390 | 285,442 | 264,516 | 217,597 | 212,345 | 133,085 | 142,867 | 209,636 |
| – Programme not in operation or no payments made | ||||||||||||||||||
| Table 2.7 Environmental Transfers for Protection against Radiation, 2000-2017 | ||||||||||||||||||
| €000 | ||||||||||||||||||
| 2000 | 2001 | 2002 | 2003 | 2004 | 2005 | 2006 | 2007 | 2008 | 2009 | 2010 | 2011 | 2012 | 2013 | 2014 | 2015 | 2016 | 2017 | |
| Radiological Protection Institute of Ireland | 287 | 291 | 299 | 208 | 410 | 438 | 1,220 | 400 | 447 | 380 | 304 | 242 | 200 | 200 | 400 | – | – | – |
| Total | 287 | 291 | 299 | 208 | 410 | 438 | 1,220 | 400 | 447 | 380 | 304 | 242 | 200 | 200 | 400 | – | – | – |
| – Programme not in operation | ||||||||||||||||||
| Table 2.8 Environmental Transfers for Environmental Protection Research and Development, 2000-2017 | ||||||||||||||||||
| €000 | ||||||||||||||||||
| 2000 | 2001 | 2002 | 2003 | 2004 | 2005 | 2006 | 2007 | 2008 | 2009 | 2010 | 2011 | 2012 | 2013 | 2014 | 2015 | 2016 | 2017 | |
| COFORD Research Programme | – | – | – | – | – | – | 169.5 | 726.8 | 872.3 | 1284.8 | 789.8 | 192 | 0 | 1353.4 | 124.5 | 426.4 | 928.1 | 608.4 |
| Cleaner Greener Production Programme/Green Enterprise | – | 250 | 250 | 250 | 250 | 250 | 250 | 250 | 250 | 450 | 250 | 211 | 231 | 11 | 357 | 194 | 279 | 171 |
| ERTDI Research Programme | 1,287 | 1,611 | 2,255 | 3,023 | 3,409 | 3,258 | 3,234 | – | – | – | – | – | – | – | – | – | – | – |
| Food Institutional Research Measure (FIRM) | – | – | – | – | – | – | – | – | – | – | – | 0 | 0 | 478 | 0 | 120 | 179 | 179 |
| Research Stimulus Fund | – | – | – | – | – | – | – | – | – | – | – | 509 | 0 | 1890 | 170 | 621 | 1839 | 1080 |
| STRIVE Research Programme | – | – | – | – | – | – | – | 5,635 | 5,836 | 7,407 | 6,811 | 6,633 | 4,654 | 4,387 | 3,809 | 3,082 | 3,975 | 4,160 |
| Total | 1,287 | 1,861 | 2,505 | 3,273 | 3,659 | 3,508 | 3,653 | 6,611 | 6,958 | 9,141 | 7,851 | 7,545 | 4,885 | 8,118 | 4,461 | 4,443 | 7,200 | 6,199 |
| – Programme not in operation or no payments made | ||||||||||||||||||
| Table 2.9 Environmental Transfers for Other Environmental Protection Activities, 2000-2017 | ||||||||||||||||||
| €000 | ||||||||||||||||||
| 2000 | 2001 | 2002 | 2003 | 2004 | 2005 | 2006 | 2007 | 2008 | 2009 | 2010 | 2011 | 2012 | 2013 | 2014 | 2015 | 2016 | 2017 | |
| Aarhus Convention | – | – | – | – | – | – | – | 5 | 5 | 14 | 13 | 18 | 21 | 14 | 5 | 8 | 8 | 8 |
| Convention on Environmental Impact Assessment | – | – | – | – | – | – | – | – | 10 | 10 | 10 | 10 | 0 | – | – | – | – | – |
| EU LIFE: DfAuto | – | – | – | – | – | – | 232 | 232 | – | – | – | – | – | – | – | – | – | – |
| EU LIFE: Epicentre | – | 576 | 576 | – | – | – | – | – | – | – | – | – | – | – | – | – | – | – |
| Environment Fund NGO Grants | – | – | – | – | – | – | 166 | 166 | 574 | 390 | 461 | 473 | 392 | 422 | 437 | 413 | 413 | 430 |
| Environment Fund Project Grants | – | – | – | – | – | – | 20 | 76 | 119 | 173 | 227 | 231 | 173 | 111 | 22 | 13 | 5 | 5 |
| European Environmental Bureau | – | – | – | – | – | – | – | – | 20 | 0 | – | – | – | 20 | 20 | 10 | 10 | 10 |
| Global Environment Facility | 1,100 | 1,257 | 1,469 | 1,420 | 1,409 | 1,433 | 1,469 | 1,420 | 1,420 | 1,421 | 1,469 | 1,420 | 1,420 | 1,421 | 1,469 | 1,420 | 1,420 | 1,421 |
| Green Communities Programme | – | – | – | – | – | – | – | – | – | – | – | 39 | 38 | 38 | 35 | 9 | 0 | 0 |
| Green Home Programme | – | – | – | – | – | – | – | 50 | 50 | 50 | 50 | 63 | 63 | 38 | 34 | 9 | 0 | 0 |
| Green Schools Programme | – | – | – | – | – | – | 100 | 100 | 100 | 0 | 100 | 100 | 90 | 100 | 90 | 90 | 95 | 100 |
| GreenBusiness.ie/SMILE | 150 | 150 | 150 | 306 | 328 | 359 | 307 | 274 | 228 | 218 | ||||||||
| Local Agenda 21 Environmental Partnership Fund | 140 | 140 | 140 | 150 | 146 | 125 | 123 | 146 | 164 | 156 | 152 | 192 | 169 | 200 | 198 | 190 | 194 | 221 |
| OECD Environmental Compliance Indicators | – | – | – | – | – | – | – | – | – | – | – | – | 5 | 5 | – | – | – | – |
| UN Environment Fund | 317 | 317 | 317 | 317 | 317 | 317 | 317 | 317 | 317 | 317 | 317 | 317 | 361 | 361 | 358 | 507 | 508 | 478 |
| Total | 1,557 | 2,290 | 2,502 | 1,887 | 1,871 | 1,875 | 2,428 | 2,512 | 2,929 | 2,680 | 2,949 | 3,168 | 3,059 | 3,087 | 2,975 | 2,942 | 2,881 | 2,891 |
| – Programme not in operation or no payments made | ||||||||||||||||||
| Table 2.10 Environmental Transfers for the Management of Water, 2000-2017 | ||||||||||||||||||
| €000 | ||||||||||||||||||
| Programme | 2000 | 2001 | 2002 | 2003 | 2004 | 2005 | 2006 | 2007 | 2008 | 2009 | 2010 | 2011 | 2012 | 2013 | 2014 | 2015 | 2016 | 2017 |
| Rainwater Harvesting Scheme | – | – | – | – | – | – | – | – | – | – | – | 0 | 8 | 0 | 19 | 24 | 34 | 0 |
| Total | – | – | – | – | – | – | – | – | – | – | – | 0 | 8 | 0 | 19 | 24 | 34 | 0 |
| – Programme not in operation | ||||||||||||||||||
| Table 2.11 Environmental Transfers for the Management of Forest Resources, 2000-2017 | ||||||||||||||||||
| €000 | ||||||||||||||||||
| Programme | 2000 | 2001 | 2002 | 2003 | 2004 | 2005 | 2006 | 2007 | 2008 | 2009 | 2010 | 2011 | 2012 | 2013 | 2014 | 2015 | 2016 | 2017 |
| EU LIFE: CleanWood | – | – | – | – | – | – | – | 237 | 237 | 237 | 237 | – | – | – | – | – | – | – |
| EU LIFE: Tyre/Wood Block | – | – | – | – | – | – | 147 | 147 | 147 | 147 | – | – | – | – | – | – | – | – |
| Native Woodland Conservation Scheme | 4 | 0 | 121 | 90 | 294 | 150 | 650 | 1,882 | 862 | 426 | 410 | 415 | 611 | 423 | 257 | 106 | 97 | 145 |
| Total | 4 | 0 | 121 | 90 | 294 | 150 | 797 | 2,265 | 1,246 | 809 | 646 | 415 | 611 | 423 | 257 | 106 | 97 | 145 |
| – Programme not in operation | ||||||||||||||||||
| Table 2.12 Environmental Transfers for the Management of Wild Flora and Fauna, 2000-2017 | ||||||||||||||||||
| €000 | ||||||||||||||||||
| Programme | 2000 | 2001 | 2002 | 2003 | 2004 | 2005 | 2006 | 2007 | 2008 | 2009 | 2010 | 2011 | 2012 | 2013 | 2014 | 2015 | 2016 | 2017 |
| Conservation and Management of Fisheries | 129 | 176 | 316 | 952 | 180 | 706 | 933 | – | – | – | – | – | – | – | – | – | – | – |
| Environmentally Friendly Fishing Gear | – | – | – | – | – | – | – | 217 | 475 | 374 | – | – | – | – | – | – | – | – |
| Heritage Council Wildlife Grants | – | – | – | – | 257 | 282 | 243 | 254 | 288 | 253 | 16 | – | – | – | – | – | – | – |
| Lobster V-Notching Scheme | – | – | 52 | 52 | 58 | 118 | 45 | 55 | 60 | 61 | 85 | 63 | 71 | 86 | 253 | 320 | 336 | 342 |
| Marine Environment Protection Scheme | – | – | – | – | – | – | – | – | – | – | 325 | 279 | 178 | 141 | 315 | 296 | – | – |
| Salmon Conservation Fund | – | – | – | – | – | – | – | – | – | – | – | – | 641 | 195 | 595 | 267 | 557 | 252 |
| Salmon Hardship Scheme | – | – | – | – | – | – | – | 11,858 | 12,710 | 4,612 | – | – | – | – | – | – | – | – |
| Sea Fisheries Protection Authority (fisheries conservation) | – | – | – | – | – | – | – | 303 | 1,073 | 753 | 1,010 | 542 | 221 | 735 | 630 | 375 | 194 | 500 |
| Seafood Environmental Management Part A | – | – | – | – | – | – | – | – | – | – | 167 | 178 | 34 | 51 | 9 | 16 | – | – |
| Seafood Environmental Management Part B | – | – | – | – | – | – | – | – | – | – | 182 | 278 | 117 | – | – | – | – | – |
| Sustainable Fisheries Scheme | – | – | – | – | – | – | – | – | – | – | – | – | – | – | – | – | 515 | 444 |
| Whitefish Fleet Decommissioning Scheme | – | – | – | – | – | 4,104 | 11,863 | 0 | 21,000 | 16,983 | 7 | – | – | – | – | – | – | – |
| Total | 129 | 176 | 368 | 1,004 | 495 | 5,209 | 13,085 | 12,687 | 35,605 | 23,035 | 1,792 | 1,340 | 1,261 | 1,207 | 1,802 | 1,274 | 1,602 | 1,538 |
| – Programme not in operation or no payments made | ||||||||||||||||||
| Table 2.13A Environmental Transfers for the Production of Energy from Renewable Resources, 2000-2017 | |||||||||||||||||
| €000 | |||||||||||||||||
| Programme | 2001 | 2002 | 2003 | 2004 | 2005 | 2006 | 2007 | 2008 | 2009 | 2010 | 2011 | 2012 | 2013 | 2014 | 2015 | 2016 | 2017 |
| Bioenergy Scheme | – | – | – | – | – | – | 1,040 | 1,127 | 1,275 | 974 | 304 | 245 | 172 | 101 | 103 | 5 | 98 |
| Biomass Harvesting Equipment Scheme | – | – | – | – | – | – | 0 | 77 | 99 | 0 | – | – | – | – | – | – | – |
| Microgeneration Scheme | – | – | – | – | – | – | – | – | 410 | 280 | 30 | – | – | – | – | – | – |
| Ocean Energy Programme | – | – | – | – | – | – | – | 887 | 2,513 | 245 | 2,088 | 1,206 | 416 | 628 | 2,107 | 1,762 | 1,461 |
| Operation & Maintenance of Waste to Energy Facilities | – | – | – | – | – | – | – | – | – | – | 0 | 0 | 0 | 0 | 0 | 0 | 565 |
| PSO Levy: Electricity Generation from Renewable Sources | – | – | 6,568 | 16,086 | 12,356 | 210 | 0 | 0 | 0 | 64,075 | 43,226 | 36,447 | 54,584 | 43,088 | 94,300 | 180,900 | 277,600 |
| ReHeat Deployment Scheme | – | – | – | – | – | 50 | 927 | 3,984 | 1,811 | 1,748 | 331 | – | – | – | – | – | – |
| Renewable Energy Educational Support | – | – | – | – | 184 | 208 | 0 | 176 | 0 | – | – | – | – | – | – | – | – |
| Renewable Energy Information Office | – | – | 858 | 692 | 714 | 670 | – | – | – | – | – | – | – | – | – | – | – |
| Renewable Energy RD&D | 0 | 15 | 504 | 1,459 | 1,460 | 1,017 | 909 | 894 | 1,249 | 599 | 1,035 | 316 | 339 | 699 | 945 | 708 | 2,011 |
| Total | 0 | 15 | 7,930 | 18,237 | 14,714 | 2,155 | 2,876 | 7,146 | 7,357 | 67,921 | 47,015 | 38,214 | 55,511 | 44,516 | 97,455 | 183,375 | 281,735 |
| – Programme not in operation or no payments made | |||||||||||||||||
| Table 2.13B Environmental Transfers for Heat/Energy Saving and Management, 2000-2017 | |||||||||||||||||
| €000 | |||||||||||||||||
| Programme | 2001 | 2002 | 2003 | 2004 | 2005 | 2006 | 2007 | 2008 | 2009 | 2010 | 2011 | 2012 | 2013 | 2014 | 2015 | 2016 | 2017 |
| Accelerated Allowances for Energy Efficient Equipment | – | – | – | – | – | – | – | – | 1,600 | 600 | 1,300 | 1,000 | 700 | 900 | 1,100 | 900 | 3,100* |
| Better Energy Communities | – | – | – | – | – | – | – | – | – | – | – | 1,783 | 7,782 | 14,583 | 16,074 | 14,650 | 21,604 |
| Better Energy Homes | – | – | – | – | – | – | – | – | 16,260 | 45,362 | 57,673 | 28,922 | 13,132 | 9,896 | 14,325 | 17,030 | 16,330 |
| Better Energy Workplaces | – | – | – | – | – | – | – | – | – | – | 10,936 | 11,308 | 1,826 | – | – | – | – |
| CHP Deployment Scheme | – | – | – | 25 | 59 | 29 | 367 | 1,842 | 1,997 | 1,535 | 376 | – | – | – | – | – | – |
| Deep Retrofit Pilot Scheme | – | – | – | – | – | – | – | – | – | – | – | – | – | – | – | – | 752 |
| EU LIFE: WISER | – | – | – | – | – | – | – | – | – | – | – | – | – | 150 | 300 | 300 | 150 |
| EXEED Programme | – | – | – | – | – | – | – | – | – | – | – | – | – | – | – | 382 | 1,556 |
| Energy Efficiency Retrofit Fund | – | – | – | – | – | – | – | – | – | 7,561 | 746 | – | – | – | – | – | – |
| Energy in Education Programme | – | – | – | – | – | – | – | – | – | – | – | – | 100 | 105 | 57 | 34 | 0 |
| Greener Homes Scheme | – | – | – | – | – | 4,291 | 26,727 | 21,848 | 11,100 | 6,216 | 4,561 | 0 | – | – | – | – | – |
| Home Energy Saving Programme | – | – | – | – | – | – | 0 | 728 | 83 | 0 | – | – | – | – | – | – | – |
| House of Tomorrow | – | 498 | 419 | 811 | 2,629 | 3,646 | 7,820 | 8,573 | 1,558 | 211 | 0 | – | – | – | – | – | – |
| Industry RD&D | – | – | 239 | – | 27 | 16 | 428 | 72 | 79 | 15 | 0 | – | – | – | – | – | – |
| Industry and Business Programme | – | – | – | – | – | – | 2,010 | 3,046 | 5,229 | 867 | 1,398 | 987 | 1,290 | 1,059 | 784 | 1,063 | 1,485 |
| Local Authority Estate Energy Retrofit | – | – | – | – | – | – | – | – | – | 36,301 | 32,727 | 19,849 | 26,952 | 57,034 | 56,431 | 52,545 | 28,787 |
| Public Sector Energy Efficiency Programme | – | – | – | – | – | – | – | 0 | 4,676 | 211 | 0 | 0 | 0 | 316 | 383 | 448 | 5,429 |
| Public Sector Energy Programme | – | 2,064 | 3,618 | 1,808 | 1,508 | 1,173 | 508 | 859 | 481 | 151 | – | – | – | – | – | – | – |
| Schools/Education Programme | – | – | 14 | 18 | 10 | 10 | 1 | 90 | 38 | 60 | 96 | 118 | 231 | 240 | 369 | 322 | 318 |
| Warmer Homes Scheme | 83 | 87 | 222 | 291 | 383 | 667 | 823 | 2,147 | 3,078 | 5,062 | 3,704 | 4,124 | 4,913 | 5,876 | 142 | 17 | 4 |
| Warmth and Well-being Scheme | – | – | – | – | – | – | – | – | – | – | – | – | – | – | – | 314 | 2,614 |
| Total | 83 | 2,649 | 4,512 | 2,953 | 4,615 | 9,831 | 38,684 | 39,204 | 46,177 | 104,151 | 113,515 | 68,091 | 56,926 | 90,159 | 89,966 | 88,006 | 82,129 |
| – Programme not in operation or no payments made | |||||||||||||||||
| * The 2017 figure is provisional | |||||||||||||||||
| Table 2.13C Environmental Transfers for the Minimisation of the Intake of Fossil Resources as Raw Materials, 2000-2017 | ||||||||||||||||||
| €000 | ||||||||||||||||||
| Programme | 2000 | 2001 | 2002 | 2003 | 2004 | 2005 | 2006 | 2007 | 2008 | 2009 | 2010 | 2011 | 2012 | 2013 | 2014 | 2015 | 2016 | 2017 |
| EU LIFE: DEPOTEC | – | – | – | – | – | – | – | – | – | – | – | – | 389 | 389 | 389 | 389 | – | – |
| EU LIFE: Tyre/Wood Block | – | – | – | – | – | – | 147 | 147 | 147 | 147 | – | – | – | – | – | – | – | – |
| Total | – | – | – | – | – | – | 147 | 147 | 147 | 147 | – | – | 389 | 389 | 389 | 389 | – | – |
| – Programme not in operation | ||||||||||||||||||
| Table 2.14 Environmental Transfers for the Management of Minerals, 2000-2017 | ||||||||||||||||||
| €000 | ||||||||||||||||||
| Programme | 2000 | 2001 | 2002 | 2003 | 2004 | 2005 | 2006 | 2007 | 2008 | 2009 | 2010 | 2011 | 2012 | 2013 | 2014 | 2015 | 2016 | 2017 |
| EU LIFE: HEATSUN | – | – | 74 | 74 | 74 | 74 | 74 | – | – | – | – | – | – | – | – | – | – | – |
| Total | – | – | 74 | 74 | 74 | 74 | 74 | – | – | – | – | – | – | – | – | – | – | – |
| – Programme not in operation | ||||||||||||||||||
| Table 2.15 Environmental Transfers for Resource Management Research and Development, 2000-2017 | ||||||||||||||||||
| €000 | ||||||||||||||||||
| Programme | 2000 | 2001 | 2002 | 2003 | 2004 | 2005 | 2006 | 2007 | 2008 | 2009 | 2010 | 2011 | 2012 | 2013 | 2014 | 2015 | 2016 | 2017 |
| Cleaner Greener Production Programme/Green Enterprise | – | 250 | 250 | 250 | 250 | 250 | 250 | 250 | 250 | 450 | 250 | 211 | 231 | 11 | 357 | 194 | 279 | 171 |
| ERTDI Research Programme | 1,287 | 1,611 | 2,255 | 3,023 | 3,409 | 3,258 | 3,234 | – | – | – | – | – | – | – | – | – | – | – |
| STRIVE Research Programme | – | – | – | – | – | – | – | 5,635 | 5,836 | 7,407 | 6,811 | 6,633 | 4,654 | 4,387 | 3,809 | 3,082 | 3,975 | 4,160 |
| Total | 1,287 | 1,861 | 2,505 | 3,273 | 3,659 | 3,508 | 3,484 | 5,885 | 6,086 | 7,857 | 7,061 | 6,844 | 4,885 | 4,397 | 4,167 | 3,276 | 4,254 | 4,331 |
| – Programme not in operation | ||||||||||||||||||
| Table 2.16 Environmental Transfers for Other Resource Management Activities, 2000-2017 | ||||||||||||||||||
| €000 | ||||||||||||||||||
| Programme | 2000 | 2001 | 2002 | 2003 | 2004 | 2005 | 2006 | 2007 | 2008 | 2009 | 2010 | 2011 | 2012 | 2013 | 2014 | 2015 | 2016 | 2017 |
| EU LIFE: WISER | – | – | – | – | – | – | – | – | – | – | – | – | – | – | 150 | 300 | 300 | 150 |
| Environment Fund NGO Grants | – | – | – | – | – | – | 166 | 166 | 574 | 390 | 461 | 473 | 392 | 422 | 437 | 413 | 413 | 430 |
| Environment Fund Project Grants | – | – | – | – | – | – | 20 | 76 | 119 | 173 | 227 | 231 | 173 | 111 | 22 | 13 | 5 | 5 |
| Green Communities Programme | – | – | – | – | – | – | – | – | – | – | – | 39 | 38 | 38 | 35 | 9 | 0 | 0 |
| Green Home Programme | – | – | – | – | – | – | – | 50 | 50 | 50 | 50 | 63 | 63 | 38 | 34 | 9 | 0 | 0 |
| Green Schools Programme | – | – | – | – | – | – | 100 | 100 | 100 | 0 | 100 | 100 | 90 | 100 | 90 | 90 | 95 | 100 |
| GreenBusiness.ie/SMILE | – | – | – | – | – | – | – | – | 150 | 150 | 150 | 306 | 328 | 359 | 307 | 274 | 228 | 218 |
| Local Agenda 21 Environmental Partnership Fund | 140 | 140 | 140 | 150 | 146 | 125 | 123 | 146 | 164 | 156 | 152 | 192 | 169 | 200 | 198 | 190 | 194 | 221 |
| Total | 140 | 140 | 140 | 150 | 146 | 125 | 409 | 537 | 1,157 | 918 | 1,140 | 1,403 | 1,252 | 1,266 | 1,274 | 1,297 | 1,235 | 1,124 |
| – Programme not in operation or no payments made | ||||||||||||||||||
| Table 3 Environmental Transfers by Type of Transfer (Capital and Current), 2000-2017 | ||||||||||||||||||
| €000 | ||||||||||||||||||
| Type of Transfer | 2000 | 2001 | 2002 | 2003 | 2004 | 2005 | 2006 | 2007 | 2008 | 2009 | 2010 | 2011 | 2012 | 2013 | 2014 | 2015 | 2016 | 2017 |
| Capital | 320,551 | 400,514 | 380,940 | 332,176 | 274,051 | 259,794 | 322,094 | 472,121 | 824,830 | 666,796 | 708,474 | 383,545 | 241,212 | 196,608 | 213,316 | 239,764 | 275,979 | 329,491 |
| Current | 223,202 | 186,423 | 198,073 | 219,679 | 259,900 | 337,278 | 375,799 | 378,575 | 381,442 | 405,553 | 475,209 | 397,096 | 345,871 | 327,350 | 342,272 | 305,890 | 408,997 | 565,399 |
| Total | 543,752 | 586,936 | 579,013 | 551,855 | 533,950 | 597,072 | 697,892 | 850,696 | 1,206,271 | 1,072,349 | 1,183,683 | 780,641 | 587,083 | 523,958 | 555,588 | 545,654 | 684,976 | 894,890 |
| Table 4 Environmental Transfers by Institutional Sector of Beneficiary, 2000-2017 | ||||||||||||||||||
| €000 | ||||||||||||||||||
| Institutional Sector | 2000 | 2001 | 2002 | 2003 | 2004 | 2005 | 2006 | 2007 | 2008 | 2009 | 2010 | 2011 | 2012 | 2013 | 2014 | 2015 | 2016 | 2017 |
| S.11 Non-financial corporations | 223,514 | 182,995 | 194,770 | 232,446 | 263,588 | 341,945 | 389,060 | 476,765 | 813,157 | 713,914 | 735,960 | 396,475 | 325,973 | 290,419 | 270,865 | 246,339 | 348,897 | 528,464 |
| S.12 Financial corporations | – | – | – | – | – | – | – | 2 | 22 | 71 | 54 | 10 | 172 | 12 | 25 | 0 | – | – |
| S.13 General government | 311,542 | 395,432 | 374,619 | 305,129 | 253,479 | 239,352 | 281,813 | 308,141 | 330,554 | 309,882 | 330,359 | 266,312 | 188,252 | 165,911 | 187,802 | 198,586 | 233,880 | 273,703 |
| S.14 Households | – | 140 | 142 | 277 | 1,285 | 2,062 | 10,210 | 40,497 | 46,695 | 33,947 | 103,684 | 102,579 | 61,909 | 53,916 | 86,398 | 88,691 | 91,472 | 80,017 |
| S.15 Non-profit institutions serving households | 6,908 | 6,322 | 7,205 | 11,635 | 13,280 | 11,277 | 14,311 | 22,828 | 13,397 | 12,056 | 11,077 | 12,719 | 8,067 | 10,946 | 7,839 | 9,216 | 7,917 | 9,953 |
| S.2 Rest of the world | 1,788 | 2,048 | 2,277 | 2,368 | 2,318 | 2,436 | 2,498 | 2,463 | 2,447 | 2,479 | 2,549 | 2,546 | 2,709 | 2,754 | 2,659 | 2,823 | 2,810 | 2,754 |
| Total | 543,752 | 586,936 | 579,013 | 551,855 | 533,950 | 597,072 | 697,892 | 850,696 | 1,206,271 | 1,072,349 | 1,183,683 | 780,641 | 587,083 | 523,958 | 555,588 | 545,654 | 684,976 | 894,890 |
| – No transfers identified | ||||||||||||||||||
| Table 5 Environmental Transfers by NACE Section of Beneficiary, 2000-2017 | ||||||||||||||||||
| €000 | ||||||||||||||||||
| NACE Rev. 2 Section | 2000 | 2001 | 2002 | 2003 | 2004 | 2005 | 2006 | 2007 | 2008 | 2009 | 2010 | 2011 | 2012 | 2013 | 2014 | 2015 | 2016 | 2017 |
| A: Agriculture, forestry and fishing | 221,198 | 179,019 | 188,961 | 217,407 | 237,327 | 318,309 | 377,217 | 454,186 | 783,616 | 681,224 | 648,034 | 325,163 | 267,169 | 220,171 | 215,602 | 139,456 | 153,264 | 230,960 |
| B: Mining and quarrying | – | – | – | – | – | – | – | – | – | – | – | 44 | 71 | 80 | – | – | – | – |
| C: Manufacturing industries | – | 250 | 252 | 539 | 639 | 708 | 726 | 3,245 | 5,321 | 6,649 | 3,354 | 5,389 | 6,904 | 2,445 | 1,703 | 1,298 | 1,824 | 3,108 |
| D: Electricity, gas and air | – | 0 | 5 | 7,575 | 17,211 | 13,559 | 1,244 | 331 | 338 | 568 | 64,259 | 44,076 | 36,857 | 54,685 | 43,296 | 94,581 | 181,110 | 278,197 |
| E: Water, sewerage, and waste | 6,628 | 5,904 | 6,770 | 11,068 | 12,445 | 10,515 | 13,087 | 21,500 | 11,510 | 9,868 | 8,795 | 10,442 | 6,164 | 6,431 | 777 | 1,146 | 212 | 199 |
| F: Construction | – | 0 | 373 | 314 | 608 | 1,972 | 2,734 | 5,992 | 6,858 | 1,513 | 174 | 1 | 18 | – | – | – | – | – |
| G: Wholesale and retail | – | – | – | – | – | – | 4 | 303 | 607 | 1,031 | 408 | 1,149 | 752 | 182 | 137 | 106 | 167 | 326 |
| H: Transportation and storage | – | – | – | – | – | – | – | 1 | – | 36 | 192 | 474 | 280 | 6 | – | – | – | – |
| I: Accommodation and food services activities | – | 0 | 2 | 50 | 144 | 163 | 121 | 450 | 1,196 | 696 | 775 | 874 | 442 | 454 | 273 | 201 | 116 | 243 |
| J: Information and communication | – | – | – | – | – | – | – | 217 | 305 | 524 | 233 | 770 | 99 | 166 | 106 | 78 | 145 | 304 |
| K: Financial and insurance activities | – | – | – | – | – | – | – | 23 | 44 | 71 | 54 | 276 | 221 | 12 | 25 | 0 | – | – |
| L: Real estate | – | – | – | – | – | – | – | – | 232 | 13 | – | 69 | 68 | – | – | – | – | – |
| M: Professional, scientific and technical activities | 2,316 | 3,726 | 4,891 | 5,895 | 7,002 | 6,814 | 6,952 | 11,647 | 13,164 | 19,130 | 14,480 | 15,725 | 10,880 | 11,621 | 9,054 | 9,946 | 16,809 | 17,729 |
| N: Administrative and support services | – | – | – | – | – | – | – | 84 | 34 | 75 | 67 | 70 | 66 | 72 | 61 | 55 | 46 | 44 |
| O: Public administration | 311,542 | 395,432 | 373,907 | 303,997 | 253,033 | 238,845 | 281,227 | 307,708 | 329,607 | 306,997 | 325,919 | 262,810 | 185,990 | 162,926 | 183,756 | 193,929 | 224,410 | 261,068 |
| P: Education | – | – | 658 | 1,048 | 771 | 765 | 566 | 479 | 1,270 | 2,161 | 3,336 | 3,151 | 2,176 | 2,558 | 3,651 | 3,967 | 3,737 | 5,863 |
| Q: Human health and social work activities | – | – | 341 | 539 | 275 | – | 29 | 29 | 286 | 1,453 | 1,210 | 1,027 | 669 | 1,423 | 2,559 | 2,886 | 2,691 | 4,826 |
| R: Arts and recreation | – | – | – | – | – | – | – | 60 | 288 | 105 | 175 | 96 | 182 | – | – | – | – | – |
| S: Other services | 280 | 418 | 436 | 778 | 892 | 926 | 1,280 | 1,455 | 2,318 | 2,144 | 2,266 | 2,525 | 2,459 | 3,357 | 4,631 | 5,392 | 5,263 | 6,153 |
| U: Extra territorial | 1,788 | 2,048 | 2,277 | 2,368 | 2,318 | 2,436 | 2,498 | 2,463 | 2,447 | 2,479 | 2,549 | 2,546 | 2,709 | 2,754 | 2,659 | 2,823 | 2,810 | 2,754 |
| Households | – | 140 | 142 | 277 | 1,285 | 2,062 | 10,210 | 40,497 | 46,665 | 33,947 | 103,684 | 102,579 | 61,909 | 53,916 | 86,398 | 88,691 | 91,472 | 80,017 |
| Not assigned | – | – | – | – | – | – | – | 26 | 165 | 1,665 | 3,720 | 1,386 | 1,000 | 700 | 900 | 1,100 | 900 | 3,100 |
| Total | 543,752 | 586,936 | 579,013 | 551,855 | 533,950 | 597,072 | 697,892 | 850,696 | 1,206,271 | 1,072,349 | 1,183,683 | 780,641 | 587,083 | 523,958 | 555,588 | 545,654 | 684,976 | 894,890 |
| – No transfers identified | ||||||||||||||||||
| Table 6 Environmental Transfers by Type of Transfer, 2000-2017 | ||||||||||||||||||
| €000 | ||||||||||||||||||
| Type of Transfer | 2000 | 2001 | 2002 | 2003 | 2004 | 2005 | 2006 | 2007 | 2008 | 2009 | 2010 | 2011 | 2012 | 2013 | 2014 | 2015 | 2016 | 2017 |
| D.39 Subsidies on production | 205,593 | 165,487 | 174,500 | 201,472 | 236,398 | 307,168 | 342,599 | 324,554 | 327,148 | 355,646 | 396,132 | 326,405 | 290,376 | 263,520 | 250,800 | 225,469 | 336,302 | 509,719 |
| D.63 Social transfers in kind | – | 83 | 87 | 222 | 291 | 383 | 667 | 923 | 2,247 | 3,278 | 41,563 | 36,826 | 24,485 | 32,228 | 63,132 | 56,608 | 53,050 | 31,575 |
| D.73 Other current transfers within government | 15,821 | 18,805 | 21,209 | 15,617 | 20,892 | 27,291 | 30,035 | 38,777 | 36,891 | 39,538 | 34,965 | 31,275 | 24,804 | 24,866 | 21,509 | 16,967 | 12,444 | 17,101 |
| D.74 Current international cooperation | 1,788 | 2,048 | 2,277 | 2,368 | 2,318 | 2,436 | 2,498 | 2,463 | 2,447 | 2,479 | 2,549 | 2,546 | 2,709 | 2,754 | 2,659 | 2,823 | 2,810 | 2,754 |
| D.92 Investment grants | 320,551 | 400,457 | 380,903 | 332,142 | 273,072 | 254,042 | 304,998 | 459,281 | 782,045 | 645,171 | 697,522 | 379,015 | 236,626 | 194,197 | 209,226 | 232,914 | 266,017 | 310,768 |
| D.99 Other capital transfers | – | – | – | – | – | 4,104 | 11,863 | 11,858 | 33,710 | 21,595 | 7 | 45 | 3,497 | 3,982 | 4,173 | 4,022 | 4,390 | 4,251 |
| Tax rate relief | – | 56 | 37 | 34 | 979 | 1,649 | 5,233 | 12,839 | 21,785 | 3,042 | 10,345 | 3,230 | 3,586 | 1,712 | 3,190 | 5,750 | 9,062 | 15,623 |
| Accelerated depreciation allowances | – | – | – | – | – | – | – | – | – | 1,600 | 600 | 1,300 | 1,000 | 700 | 900 | 1,100 | 900 | 3,100 |
| Total | 543,752 | 586,936 | 579,013 | 551,855 | 533,950 | 597,072 | 697,892 | 850,696 | 1,206,271 | 1,072,349 | 1,183,683 | 780,641 | 587,083 | 523,958 | 555,588 | 545,654 | 684,976 | 894,890 |
| – No transfers identified | ||||||||||||||||||
| Table 7 Environmental Transfers by Source of Funding (National and EU), 2000-2017 | ||||||||||||||||||
| €000 | ||||||||||||||||||
| Source of Funding | 2000 | 2001 | 2002 | 2003 | 2004 | 2005 | 2006 | 2007 | 2008 | 2009 | 2010 | 2011 | 2012 | 2013 | 2014 | 2015 | 2016 | 2017 |
| National | 415,806 | 495,408 | 477,233 | 435,903 | 406,922 | 423,376 | 491,359 | 606,185 | 760,179 | 871,354 | 1,004,400 | 624,064 | 433,357 | 399,937 | 402,516 | 446,325 | 590,051 | 760,275 |
| EU | 127,947 | 91,528 | 101,780 | 115,951 | 127,028 | 173,696 | 206,533 | 244,510 | 446,093 | 200,995 | 179,282 | 156,577 | 153,726 | 124,021 | 153,073 | 99,328 | 94,925 | 134,615 |
| Total | 543,752 | 586,936 | 579,013 | 551,855 | 533,950 | 597,072 | 697,892 | 850,696 | 1,206,271 | 1,072,349 | 1,183,683 | 780,641 | 587,083 | 523,958 | 555,588 | 545,654 | 684,976 | 894,890 |
| Table 8 Environmental Subsidies and Similar Transfers by Source of Funding and Administering Body, 2000-2017 | |||||||||||||||||||
| €000 | |||||||||||||||||||
| Source of Funding | Programme Administration‡ | 2000 | 2001 | 2002 | 2003 | 2004 | 2005 | 2006 | 2007 | 2008 | 2009 | 2010 | 2011 | 2012 | 2013 | 2014 | 2015 | 2016 | 2017 |
| Department of Agriculture, Food and the Marine (DAFM) | BIM | 0 | 0 | 13 | 13 | 15 | 1,056 | 2,977 | 11,901 | 18,040 | 8,870 | 490 | 554 | 218 | 139 | 289 | 316 | 425 | 391 |
| COFORD | 0 | 0 | 0 | 0 | 0 | 0 | 170 | 727 | 872 | 1,285 | 790 | 192 | 0 | 1,353 | 125 | 426 | 928 | 608 | |
| DAFM | 93,252 | 88,204 | 88,083 | 102,321 | 111,235 | 144,660 | 168,439 | 199,055 | 319,082 | 471,225 | 465,674 | 164,916 | 109,125 | 96,038 | 60,640 | 40,611 | 63,531 | 101,847 | |
| Inland Fisheries Ireland | 0 | 0 | 0 | 0 | 0 | 0 | 0 | 0 | 0 | 0 | 0 | 0 | 641 | 195 | 595 | 267 | 557 | 252 | |
| Marine Institute | 0 | 0 | 0 | 0 | 0 | 0 | 0 | 0 | 0 | 500 | 375 | 322 | 248 | 167 | 165 | 280 | 2,220 | 2,762 | |
| Total | 93,252 | 88,204 | 88,096 | 102,334 | 111,250 | 145,716 | 171,586 | 211,683 | 337,994 | 481,880 | 467,328 | 165,983 | 110,231 | 97,892 | 61,812 | 41,899 | 67,662 | 105,859 | |
| Department of Communications, Climate Action and Environment (DCCAE) | DCCAE | 287 | 291 | 299 | 208 | 410 | 438 | 8,916 | 9,728 | 46,733 | 5,726 | 3,830 | 1,243 | 3,500 | 8,798 | 8,073 | 4,506 | 10,118 | 7,997 |
| EPA | 2,573 | 3,722 | 5,010 | 6,545 | 7,317 | 7,215 | 7,168 | 12,229 | 13,016 | 17,455 | 15,190 | 15,718 | 11,735 | 10,629 | 9,595 | 7,539 | 9,569 | 9,598 | |
| SEAI | 0 | 83 | 2,664 | 5,874 | 5,104 | 6,973 | 11,776 | 40,519 | 45,146 | 50,560 | 70,122 | 83,246 | 49,621 | 30,358 | 34,618 | 37,830 | 39,770 | 57,836 | |
| Total | 2,860 | 4,096 | 7,973 | 12,627 | 12,831 | 14,626 | 27,860 | 62,476 | 104,894 | 73,741 | 89,143 | 100,207 | 64,856 | 49,785 | 52,285 | 49,875 | 59,457 | 75,430 | |
| Department of Culture, Heritage and the Gaeltacht (DCHG) | DCHG | 0 | 0 | 0 | 0 | 0 | 0 | 0 | 0 | 0 | 0 | 0 | 45 | 3,497 | 3,982 | 4,173 | 4,022 | 4,390 | 4,251 |
| Heritage Council | 0 | 0 | 0 | 0 | 257 | 382 | 746 | 1,268 | 1,698 | 1,230 | 798 | 709 | 739 | 911 | 896 | 933 | 1,209 | 1,130 | |
| NPWS | 0 | 0 | 0 | 0 | 0 | 0 | 375 | 159 | 2,070 | 2,483 | 4,499 | 5,094 | 4,765 | 4,026 | 3,096 | 2,070 | 811 | 596 | |
| Total | 0 | 0 | 0 | 0 | 257 | 382 | 1,121 | 1,427 | 3,768 | 3,713 | 5,297 | 5,848 | 9,001 | 8,920 | 8,165 | 7,024 | 6,410 | 5,976 | |
| Department of Housing, Planning and Local Government (DHPLG) | DHPLG | 317,626 | 400,723 | 378,570 | 311,673 | 262,910 | 245,962 | 282,034 | 314,322 | 286,798 | 302,686 | 362,385 | 293,127 | 199,055 | 181,340 | 228,289 | 241,538 | 263,078 | 274,037 |
| Department of Transport, Tourism and Sport (DTTS) | DTTS | 0 | 0 | 0 | 0 | 0 | 0 | 0 | 0 | 580 | 776 | 799 | 603 | 714 | 586 | 632 | 606 | 660 | 659 |
| Environment Fund | DCCAE | 2,068 | 2,328 | 2,557 | 2,668 | 2,610 | 2,686 | 3,316 | 3,438 | 4,361 | 3,916 | 4,429 | 10,539 | 8,467 | 4,419 | 4,153 | 4,234 | 1,922 | 1,990 |
| EU | BIM | 0 | 0 | 39 | 39 | 44 | 3,166 | 8,931 | 229 | 16,204 | 13,160 | 276 | 244 | 182 | 139 | 289 | 316 | 425 | 396 |
| DAFM | 127,947 | 90,815 | 100,790 | 114,505 | 125,307 | 168,683 | 195,328 | 241,533 | 428,224 | 185,523 | 178,036 | 155,208 | 152,103 | 122,485 | 150,548 | 95,792 | 87,755 | 126,267 | |
| EU | 0 | 714 | 951 | 1,407 | 1,678 | 1,847 | 2,274 | 2,748 | 1,665 | 1,812 | 595 | 804 | 1,193 | 1,230 | 2,071 | 2,941 | 3,392 | 4,082 | |
| Marine Institute | 0 | 0 | 0 | 0 | 0 | 0 | 0 | 0 | 0 | 500 | 375 | 322 | 248 | 167 | 165 | 280 | 3,352 | 3,870 | |
| Total | 127,947 | 91,528 | 101,780 | 115,951 | 127,028 | 173,696 | 206,533 | 244,510 | 446,093 | 200,995 | 179,282 | 156,577 | 153,726 | 124,021 | 153,073 | 99,328 | 94,925 | 134,615 | |
| Exchequer (other) | Commission for Regulation of Utilities | 0 | 0 | 0 | 6,568 | 16,086 | 12,356 | 210 | 0 | 0 | 0 | 64,075 | 43,226 | 36,447 | 54,584 | 43,088 | 94,300 | 180,900 | 277,600 |
| Revenue | 0 | 56 | 37 | 34 | 979 | 1,649 | 5,233 | 12,839 | 21,785 | 4,642 | 10,945 | 4,530 | 4,585 | 2,412 | 4,090 | 6,850 | 9,962 | 18,723 | |
| Total | 0 | 56 | 37 | 6,602 | 17,065 | 14,005 | 5,442 | 12,839 | 21,785 | 4,642 | 75,020 | 47,756 | 41,033 | 56,996 | 47,178 | 101,150 | 190,862 | 296,323 | |
| ‡Abbreviations and acronyms are listed in the Background Notes | |||||||||||||||||||
As part of the implementation of the UN System of Environmental-Economic Accounting (SEEA)[1], Eurostat, the European statistical office, has developed a series of environmental accounts modules, including the Environmental Subsidies and Similar Transfers module. Eurostat has sought data under this module since 2015 and will continue to seek annual submissions. Data collection is currently voluntary but may eventually be established on a legal basis.
Ireland has submitted data for these voluntary collections and this release is based on those submissions. Eurostat has published guidelines to assist countries and to ensure that there is a consistent methodology followed in all member states. As the data collection process matures, the guidelines will be developed into a more formal manual based on both SEEA principles and the practical experience of member states.
We included preliminary data on potentially environmentally damaging subsidies (PEDS) in the 2016 release; however for 2017 a separate release will be issued in the coming months.
The UN SEEA Central Framework defines an environmental subsidy or similar transfer as a:
"current or capital transfer that is intended to support activities which protect the environment or reduce the use and extraction of natural resources".
This definition includes environmental subsidies and similar transfers that are current or capital transfers according to the SNA 2008[2] and its European version, the ESA 2010[3].
| Type of Transfer | ESA 2010 Definition |
| Other subsidies on production (D.39) | Current unrequited payments other than subsidies on products which general government or the institutions of the EU make to resident producers. |
| Social transfers in kind (D.63) | Goods and services provided for free or at prices that are not economically significant to individual households by government units and non-profit institutions. |
| Current transfers within general government (D.73) | Transfers between the different subsectors of general government (central government, local government, social security funds) with the exception of taxes, subsidies, investment grants and other capital transfers. |
| Current international cooperation (D.74) | Transfers in cash or in kind between general government and governments or international organisations in the rest of the world, except investment grants and other capital transfers. |
| Investment grants (D.92) | Capital transfers in cash or in kind made by governments or by the rest of the world to other institutional units to finance all or part of the costs of their acquiring fixed assets. |
| Other capital transfers (D.99) | Transfers other than investment grants and capital taxes which do not themselves redistribute income but redistribute saving or wealth among the different sectors or subsectors of the economy or the rest of the world. |
Although tax abatements are not covered in the definition of transfers above, we have included statistics on environment-related tax rate reliefs and accelerated depreciation allowances in this release as they are important for environmental policy making. An example of a tax rate relief is the waiving of the vehicle registration tax for purchasers of electric vehicles. An accelerated depreciation allowance incentivises purchases of fixed assets such as energy efficient equipment by permitting higher tax deductions in the early years of the asset’s life.
Environmental protection includes all activities and actions which have as their primary purpose the prevention, reduction and elimination of pollution as well as any other degradation of the environment. Resource management includes the preservation, maintenance and enhancement of the stock of natural resources.
Environmental subsidies and similar transfers can be classified by the environmental protection or natural resource domain towards which they are targeted. We use the CEPA (Classification of Environmental Protection Activities) and CReMA (Classification of Resource Management Activities) classifications.
CEPA is an internationally agreed classification of environmental protection activities by environmental domain and is included in the amended Regulation (EU) No 691/2011[4]:
CEPA 2000
01. Protection of ambient air and climate
02. Wastewater management
03. Waste management
04. Protection and remediation of soil, groundwater and surface water
05. Noise and vibration abatement
06. Protection of biodiversity and landscapes
07. Protection against radiation
08. Research and development
09. Other environmental protection activities
CReMA can be used to classify environmental subsidies and similar transfers for resource management. It is also included in the amended Regulation (EU) No 691/2011:
CReMA 2008
10. Management of water
11. Management of forest resources
12. Management of wild flora and fauna
13. Management of energy resources
13A. Production of energy from renewable sources
13B. Heat/energy saving and management
13C. Minimisation of the intake of fossil resources for raw materials for uses other than energy production
14. Management of minerals
15. Research and development activities for natural resources management
16. Other natural resource management activities
Activities and actions having a favourable impact on the environment but which have other goals were not included here. Programmes with more than one objective that are not wholly aimed at environmental protection or resource management were partially included. Where possible this was done by obtaining information on the amount of expenditure relating to the environmental objective under the programme. When this was not possible we applied a coefficient to the funding. To keep this process straightforward, easy to use and easy to understand we applied the coefficients[5] as follows:
| Coefficient | Description |
| 1.00 | Main objective or technical nature of the programme is environmental protection or resource management |
| 0.40 | One of the main objectives of the programme is environmental protection or resource management |
| 0.00 | The main objective of the programme is not related to environmental protection or resource management |
We applied the 0.40 coefficient to the following schemes: Chalara Scheme, Fallen Animals Scheme, Green Schools Travel Programme, Neighbourwood and Warmer Homes Scheme. The reason for each decision is outlined in the notes on individual programmes.
We have compiled data on the entities that receive environmental subsidies and similar transfers from the national government and from the EU. The beneficiaries are classified according to their institutional sector and their industry as follows:
(i) Institutional sector. An institutional sector is defined in ESA 2010 as an aggregation of institutional units with similar economic behaviour. The following institutional sectors are distinguished:
| Sector | Title |
| S.11 | Non-financial corporations |
| S.12 | Financial corporations |
| S.13 | General government |
| S.14 | Households |
| S.15 | Non-profit institutions serving households |
| S.2 | Rest of the world |
(ii) Industry. An industry is a group of producer units with the same principal economic activity. NACE[6] is the European reference classification for statistics related to economic activities.
| Section | Title |
| A | Agriculture, forestry and fishing |
| B | Mining and quarrying |
| C | Manufacturing |
| D | Electricity, gas, steam and air conditioning supply |
| E | Water supply; sewerage, waste management and remediation activities |
| F | Construction |
| G | Wholesale and retail trade; repair of motor vehicles and motorcycles |
| H | Transportation and storage |
| I | Accommodation and food service activities |
| J | Information and communication |
| K | Financial and insurance activities |
| L | Real estate activities |
| M | Professional, scientific and technical activities |
| N | Administrative and support service activities |
| O | Public administration and defence; compulsory social security |
| P | Education |
| Q | Human health and social work activities |
| R | Arts, entertainment and recreation |
| S | Other service activities |
| T | Activities of householders as employers and producers |
| U | Activities of extraterritorial organisations and bodies |
Allocation of funding to NACE sections and institutional sectors was straightforward for certain programmes but posed a challenge for others.
Agriculture, forestry and fishing transfers, international funding commitments, transfers to public bodies and transfers to households were in general quite simple to assign.
However identifying the sector, and in particular the NACE section, of the recipients of industry and commercial services grants (such as energy efficiency retrofit grants) was a more involved process. Details of grant recipients were sometimes published in the annual reports of the coordinating bodies. Otherwise we requested the data from the relevant organisations. The beneficiaries were assigned to NACE sections using the CSO’s Business Register.
| BIM | Bord Iascaigh Mhara (Sea Fisheries Board) |
| COFORD | Competitive Forestry Research for Development (formerly the Council for Forest Research and Development) |
| CRU | Commission for Regulation of Utilities |
| EPA | Environmental Protection Agency |
| IFI | Inland Fisheries Ireland |
| NPWS | National Parks and Wildlife Service |
| SEAI | Sustainable Energy Authority of Ireland |
Much of the information was collected from the publicly available annual accounts of government departments and organisations. CSO Government Finance Statistics were very useful as they sometimes provided more detail than the published annual reports. Local authority annual financial statements contain information on subsidies and grants received from central government for specific purposes.
The largest number of environmental transfers were run by the Department of Agriculture, Food and the Marine. We contacted the agriculture, forestry and marine divisions of the department directly in order to request data on relevant programmes along with a breakdown of the funding by national and EU contributions, current and capital amounts and information about the NACE section of the beneficiaries.
The EPA, the SEAI and BIM provided data on grant recipients that allowed for classification by institutional sector and NACE. Some of this information was published in their annual reports and some was obtained through direct requests for data to the relevant organisation.
Annual costs of tax expenditures are published on the Revenue website. Where further details were required we contacted the Revenue Statistics division directly.
Note on the Environment Fund: The Environment Fund was established under the Waste Management (Amendment) Act 2001. Revenue from the plastic bag levy and the landfill levy is paid into the Fund, which is then used to finance national and international environment-related organisations, programmes, projects and activities. The Environment Fund is managed by the Department of Communications, Climate Action and the Environment and in the programme descriptions that follow it is referred to as the national Environment Fund.
We are publishing significantly revised figures for two programmes in this release: the PSO Levy subsidy to production of energy from renewable resources, and the Rural Water Programme. The Commission for the Regulation of Utilities (CRU) publishes an annual decision paper on the amount of the subsidy to renewable energy from October 1st in a given year until September 30th the following year. In previous years we adjusted these figures to provide a total figure for the calendar year. However, to maintain consistency with other published data, we have decided to assign the figure published by the CRU to the calendar year in which the majority of the subsidy year lies. The Rural Water Programme is administered by the Department of Housing, Planning and Local Government. Previously we assigned a proportion of the total expenditure on the Rural Water Programme to the wastewater management element of the Programme. This year we received figures for wastewater expenditure for a number of years directly from the Department, which has allowed us to improve the accuracy of our figures and estimates. Both revisions resulted in a decrease in the value of the subsidy, compared with figures published in the 2016 release.
Aarhus Convention on Access to Information, Public Participation in Decision-making and Access to Justice in Environmental Matters
The contribution by the Irish government to the Aarhus Convention is a current transfer to an international organisation paid from the national Environment Fund. As it relates to environmental regulation and information it is classified under CEPA 09: Other environmental protection activities.
Accelerated Capital Allowances for Energy Efficient Equipment
This tax abatement scheme began in 2009 and is aimed at encouraging investment in energy-efficient equipment so it is classified as CReMA 13B: Heat/Energy saving and management.
Agri-Environment Options Scheme (AEOS)
The main objective of AEOS is to promote farming practices that are favourable to biodiversity. Subsidies, as well as some capital grants, have been made by the Department of Agriculture, Food and the Marine to farmers since 2011 for the implementation of measures such as maintaining traditional hay meadows or grassland. The scheme is co-funded by the EU and falls under CEPA 06: Protection of biodiversity and landscape.
Air Pollution Control (Local Authorities)
The Department of Housing, Planning, Community and Local Government subsidises the implementation of air pollution, noise pollution and water quality control measures by local authorities. We made the assumption of an even distribution of funds between the three areas and therefore included one-third of the total as a current transfer under CEPA 01: Protection of ambient air and climate. A further one-third was assigned to CEPA 05: Noise and vibration abatement (see Noise pollution control (Local authorities) below) while the water quality expenditure is not included as its primary purpose is health rather than environment protection.
Animal Carcase Disposal Scheme
This capital grant scheme was designed to facilitate the appropriate handling, storage and collection of fallen farm animals with funding specifically provided for the improvement of wastewater collection and treatment. The programme is classified under CEPA 02: Wastewater management and CEPA 03: Waste management. We have distributed the funding evenly between the two environmental domains. The scheme began in 2002 under the National Development Plan and ran until 2010. Payments were made by the Department of Agriculture to farmers.
Aran Islands Electric Vehicle Programme
The aim of this SEAI programme is to demonstrate the potential for electric vehicles charged by wind energy to meet transport requirements on the Aran Islands. It is a capital grant scheme and is classified as CEPA 01: Protection of ambient air and climate.
Basel Convention on the Control of Transboundary Movements of Hazardous Wastes and Their Disposal
This contribution by government to an international organisation is a current transfer paid from the national Environment Fund. It is classified under the environmental domain CEPA 03: Waste management.
Better Energy Communities
This SEAI capital grant programme began in 2012 and brings together various organisations and sectors within communities under the same retrofit programme. The aim of the programme is to deliver energy savings so it is classified under CReMA 13B: Heat/Energy saving and management.
Better Energy Homes
The SEAI Better Energy Homes Scheme was introduced in 2009 with the aim of encouraging home-owners to improve the energy efficiency of their homes by providing a capital grant to participants. The scheme operates nationally and is open to owners of dwellings built prior to 2006. It is classified under CReMA 13B: Heat/Energy saving and management.
Better Energy Workplaces
This SEAI capital grant programme for energy efficient retrofitting in public and private sector organisations ran from 2011-2013 and is classified under CReMA 13B: Heat/Energy saving and management.
Bioenergy Scheme
The Bioenergy Scheme was launched first as a pilot programme in 2007 and then as an EU co-funded scheme under the Rural Development Programme in 2010. The Department of Agriculture and the EU provide establishment grants to farmers to grow Willow and Miscanthus for the production of biomass suitable for use as a renewable source of energy. The scheme is classified as CReMA 13A: Production of energy from renewable resources.
Biomass Harvesting Equipment Scheme
The purpose of this Department of Agriculture scheme, which ran from 2007 to 2010, was to support the purchase of biomass harvesting and processing equipment by farmers. The scheme is classified as CReMA 13A: Production of energy from renewable resources.
Burren Farming for Conservation Programme/Burren Life Programme
The objective of this scheme is to implement farm plans that protect the environment in the Burren, in particular the habitats listed in Annex I of the EU Habitats Directive that occur within the Burren. The scheme is administered by the National Parks and Wildlife Service and participating farmers are funded by the Department of Agriculture, Food and the Marine and the EU. The Programme name changed to Burren Life Programme in 2015. It is classified under CEPA 06: Protection of biodiversity and landscape.
Capital Investment Plan (Wastewater)
Irish Water’s Capital Investment Plan began in 2014 and aims to continue the work of the Water Services Investment Programme. Here we include the wastewater investment portion of the plan under CEPA 02: Wastewater management.
Cartagena Biosafety Protocol
This contribution by government to an international organisation is a current transfer paid from the national Environment Fund. It is classified under the environmental domain CEPA 06: Protection of biodiversity and landscape as its purpose is to protect biodiversity from the potential risks posed by genetically modified organisms.
Cessation of Turf-Cutting Compensation Scheme
Turf-cutting is restricted on 53 raised bog Special Areas of Conservation (SACs) in Ireland. The Cessation of Turf-Cutting Compensation Scheme was introduced by the NPWS in 2011 to compensate households affected by the restriction. The objective is to protect biodiversity and habitats so the payments are included under CEPA 06: Protection of biodiversity and landscape.
Chalara (Reconstitution of Woodlands) Scheme
Ash dieback is a disease that affects ash trees. It is caused by the fungus Hymenoscyphus fraxineus (previously known as Chalara fraxinea). This Department of Agriculture scheme aims to restore forests affected by the disease and as many of these woodlands will have been afforested under the FEPS and NWE programmes (see below) we partially included the Chalara Scheme under the environmental domain CEPA 06: Protection of biodiversity and landscape. Partial inclusion of schemes is implemented by applying a coefficient to those programmes whose environmental protection or resource management objective(s) may not be the only motivation for the implementation of the programme. In the case of the Chalara Scheme much of the woodland restoration will involve the afforestation of cultivated forest for commercial timber production.
Chough, Goose and Wader Farm Plan Schemes
Under these NPWS Farm Plan Schemes, capital grant payments are made to farmers in Special Protection Areas to encourage them to protect the habitats of birds that are listed in Annex I of the EU Birds Directive[7]. These programmes are classified as CEPA 06: Protection of biodiversity and landscape.
CHP Deployment Scheme
The SEAI’s Combined Heat and Power (CHP) Deployment programme provided grants to enterprises for the deployment of small-scale CHP systems. The programme closed in 2011. It is classified under CReMA 13B: Heat/Energy saving and management.
Cleaner Greener Production Programme/Green Enterprise
The EPA launched the Cleaner Greener Production Programme (CGPP) in 2001 as a capital grant scheme to promote environmentally friendly practices in Irish industries. It has been funded under the EPA’s research programme and is therefore classified under CEPA 08: Environmental research and development and CReMA 15: Research and development activities for resource management. The funding was distributed evenly between the environmental protection and resource management classes. Data was provided by the EPA for the years 2010-2017. As no figures for 2001-2009 were available we estimated the total funding paid out under the scheme in those years based on EPA reports.
COFORD Research Programme
COFORD has funded research into forests and climate change and forest biodiversity under its thematic research area “Policy and public goods”. Data on environment research grant payments was obtained directly from the Department of Agriculture, Food and the Marine. The programme is assigned to CEPA 08: Environmental research and development.
Conservation and Management of Fisheries
Capital grants for the Conservation and Management of Fisheries were made by the Department of the Marine and Natural Resources up to and including 2006, with some of the expenditure being recouped from the EU. In 2007 the Sea Fisheries Protection Authority took over the role. The programme is classified under the resource management domain CReMA 12: Management of wild flora and fauna. The national and EU share of the payments was estimated for the years 2001 and 2003.
Contaminated Soil Forum
This was a contribution made by the Irish government in 2006 and 2009 to an international organisation and is a current transfer paid from the national Environment Fund. It is classified under the environmental domain CEPA 04: Protection and remediation of soil, groundwater and surface water.
Convention on Environmental Impact Assessment in a Transboundary Context
This current transfer from the Irish government to an international organisation was paid from 2008-2011 from the national Environment Fund. It sets out the obligation of countries to notify each other of all major projects under consideration that are likely to have a significant adverse environmental impact across boundaries. It is classified under the environmental domain CEPA 09: Other environmental protection activities.
Corncrake Farm Plan Scheme
The aim of the NPWS Corncrake Farm Plan Scheme is to encourage farmers to mow their meadows later in the year and to mow in a corncrake-friendly manner. This capital grant scheme is classified as CEPA 06: Protection of biodiversity and landscape.
Corncrake Grant Scheme
This capital grant scheme is aimed at landowners who have corncrakes on or near their meadows, to encourage them to mow their meadows later in the year and to mow in a corncrake-friendly manner. It is also run by the NPWS and is classified as CEPA 06: Protection of biodiversity and landscape.
Data Collection Scheme
The Data Collection Scheme supports policy and management of fisheries at National and EU level through compilation and analysis of scientific and economic data on fisheries. It is co-funded by the EU under the European Maritime and Fisheries Fund (EMFF). The Marine Institute has received the funding for scheme from the Department of Agriculture, Food and the Marine since it began in 2016.
Electric Vehicle Programme
Since 2011, the SEAI offers capital grants to householders towards the purchase of electric vehicles. The aim of the grant scheme is to reduce air pollutant emissions so the funding was assigned to CEPA 01: Protection of ambient air and climate.
Energy Efficiency Retrofit Fund
This SEAI capital grant programme was available to public and private sector organisations in 2010 and 2011 for the implementation of energy efficiency projects. It is classified under CReMA 13B: Heat/Energy saving and management.
Energy in Education Programme
This SEAI programme promotes energy efficiency in schools and is classified as a current transfer under CReMA 13B: Heat/Energy saving and management.
Environment Fund Project Grants
These projects, funded through the national Environment Fund, include the Young Environmentalist Awards, the Cork Environment Forum, the Green Awards and the SWAN and VOICE non-governmental organisations. They are classified as CEPA 09: Other environmental protection activities and CReMA 16: Other resource management activities, with the assumption of an even distribution of funding between the two classes. Not all grants paid from the national Environment Fund were included as there was a risk of double-counting, in particular with programmes that may have involved the Heritage Council or the Local Authorities.
Environment Fund NGO Grants
These payments are towards capacity-building, core funding and project funding for environmental non-government organisations in Ireland. They are classified as CEPA 09: Other environmental protection activities and CReMA 16: Other resource management activities, with the assumption of an even distribution of funding between the two classes.
Environmentally Friendly Fishing Gear
This BIM programme promoted the use of environmentally friendly fishing techniques through capital grants and is classified under CReMA 12: Management of Wild Flora and Fauna. It was co-funded by the EU.
ERTDI (Environmental Research, Technological Development and Innovation) Research Programme
ERDTI was the title of the EPA’s research programme up to and including 2006. In 2007 the new research programme STRIVE was launched. Both are classified under CEPA 08: Environmental research and development and CReMA 15: Research and development activities for resource management. We distributed the research funding evenly between the environmental protection and resource management classes.
EU LIFE programmes – general note: EU LIFE programmes are jointly funded by the EU LIFE programme and national organisations. We have included only the EU contribution to the funding in order to avoid possible double-counting with other national programmes such as agri-environment schemes. Information on the total EU funding provided over the lifetime of the project was readily available; however it proved difficult to obtain details of the annual expenditure. Therefore for most of the EU LIFE programmes that follow we have distributed the total funding evenly across the project lifetime.
EU LIFE programmes: AranLIFE
The AranLIFE project began in 2014. It aims to develop and demonstrate the best conservation management practices of local farmers on the designated Natura 2000 sites of the three islands (protected habitats for flora and fauna of European importance). It is classified under CEPA 06: Protection of biodiversity and landscape.
EU LIFE programmes: Blackwater SAMOK
This project worked towards the conservation and restoration of endangered fish, mammals and birds found in the Munster Blackwater River Special Area of Conservation. It is classified under CEPA 06: Protection of biodiversity and landscape.
EU LIFE programmes: Blanket Bog Project
Blanket bog is listed for protection in Annex I of the EU Habitats Directive, which means that EU member states must protect the best representative examples of blanket bog habitat in Special Areas of Conservation (SACs). This subsidy scheme is classified as CEPA 06: Protection of biodiversity and landscape.
EU LIFE programmes: BurrenLIFE
The overall objective of BurrenLIFE was to develop a new model for sustainable agriculture in the Burren in order to conserve the habitats of the region designated under the Habitats Directive. It was a subsidy to farmers and is classified as CEPA 06: Protection of biodiversity and landscape. This programme ran from 2005-2009. Its successor, the Burren Farming for Conservation/Burren Life programme, is currently in operation.
EU LIFE programmes: CAISIE
The full name of this programme is “Control of Aquatic Invasive Species and restoration of natural communities in Ireland”. It ran from 2009-2012 and is classified as CEPA 06: Protection of biodiversity and landscape.
EU LIFE programmes: CleanWood
This programme ran from 2006 to 2010 and aimed to demonstrate the environmental and competitive benefits of recovering waste wood for reuse. It is classified under CReMA 11: Management of forest resources.
EU LIFE programmes: DEPOTEC
This project aimed to use a depolymerisation process to recycle waste tyres into products that can be used for rubber manufacturing. It ran from 2011 to 2015 and is classified under CReMA 13C: Minimisation of the intake of fossil resources for raw materials for uses other than energy production.
EU LIFE programmes: DfAuto
The DfAuto project aimed to improve environmental compliance in the automotive sector. It is classified under CEPA 09: Other environmental protection activities.
EU LIFE programmes: Duck Slurry
This project aimed to develop a mechanism for the processing of duck slurry into a solid fertiliser, thus reducing water contamination. It is classified under the environmental domain CEPA 04: Protection and remediation of soil, groundwater and surface water.
EU LIFE programmes: Epicentre
This project aimed to support environmental performance improvements in organisations across the EU and is classified under CEPA 09: Other environmental protection activities.
EU LIFE programmes: GeoparkLIFE
GeoparkLIFE is a conservation programme established by the Burren and Cliffs of Moher Geopark that seeks a balance between the tourism interests and the conservation needs of the Geopark region. It is classified under CEPA 06: Protection of biodiversity and landscape.
EU LIFE programmes: Golden Eagle
This project aimed to start a re-introduction programme for the golden eagle in the Glenveagh National Park in Donegal and is classified under CEPA 06: Protection of biodiversity and landscape.
EU LIFE programmes: HEATSUN
The project aimed to address the issue of electrical and electronic waste management in the Dublin region and is classified under CEPA 03: Waste management.
EU LIFE programmes: KerryLIFE
The KerryLIFE project aims to promote agricultural and forestry practices that are compatible with the conservation of the pearl mussel. It is classified under CEPA 06: Protection of biodiversity and landscape.
EU LIFE programmes: MulkearLIFE
The objective of the MulkearLIFE programme was the restoration of the Lower Shannon Special Area of Conservation for the sea lamprey, the Atlantic salmon and the European otter. The project was coordinated by Inland Fisheries Ireland and is classified as CEPA 06: Protection of biodiversity and landscape.
EU LIFE programmes: Raised Bog Project
Coillte coordinated two EU LIFE projects on raised bog restoration, the first began in 2004 and the second in 2011. Both are classified as CEPA 06: Protection of biodiversity and landscape.
EU LIFE programmes: RaptorLIFE
This EU LIFE project was launched in 2015 and aims to restore habitats for the hen harrier, the merlin, the Atlantic salmon and the brook lamprey in Duhallow in County Cork. It is classified as CEPA 06: Protection of biodiversity and landscape.
EU LIFE programmes: Restoring Priority Woodland
This project aimed to restore natural woodland habitat by removing non-native trees and invasive exotic shrubs. It ran from 2006-2009 and is classified as CEPA 06: Protection of biodiversity and landscape.
EU LIFE programmes: Roseate Tern
The Royal Society for the Protection of Birds and Birdwatch Ireland were involved in this project to improve the conservation prospects of the roseate tern in the UK and Ireland. Three Special Protection Areas in Ireland and four in the UK were chosen for the project. Accordingly three-sevenths of the project funding was included here under CEPA 06: Protection of biodiversity and landscape.
EU LIFE programmes: Termoncarragh
The objective of this project was to enhance the habitat conditions for breeding and wintering at Termoncarragh Lake Special Protection Area. It is classified under CEPA 06: Protection of biodiversity and landscape.
EU LIFE programmes: Tyre/Wood Block
The objective of this programme was to demonstrate the environmental and competitive benefits of a pallet block that re-used tyre-derived waste materials, sawmilling residues and woodchip from discarded pallets. It is classified under CReMA 11: Management of forest resources and CReMA 13C: Minimisation of the intake of fossil resources for raw materials for uses other than energy production. The funding was distributed evenly between the two environmental domains.
EU LIFE programmes: Waterbirds
The objective of this programme was to restore and manage wetland bird habitats. It is classified under CEPA 06: Protection of biodiversity and landscape.
EU LIFE programmes: WISER LIFE
The objectives of the WISER LIFE project are to retrofit the Ballymun boiler house to meet best practice energy management standards and to create an environmentally educational experience for visitors to the building. The subsidy is classified as CReMA 13B: Heat/Energy saving and management and CReMA 16: Other resource management activities. We distributed the funding evenly between the two resource management classes.
European Environmental Bureau
This international funding commitment is classified under the environmental class CEPA 09: Other environmental protection activities. It is a current transfer paid from the national Environment Fund.
EXEED (Excellence in Energy Efficiency Design) Programme
EXEED is an SEAI grant programme that aims to incentivise and facilitate energy efficiency in businesses by providing funding for new assets and upgrades to existing assets that are managed to optimise energy efficiency. The grant is available to any organisation, in any sector of the economy. The first payments were made in 2016. It is classified as CReMA 13B: Heat/Energy saving and management.
Fallen Animals Scheme
This Department of Agriculture scheme was launched in 2001 with the objective of reducing the incidence of on-farm burials of fallen animals and implementing BSE testing. It provides for the subsidised collection and disposal of fallen bovine and other farm animals. As the scheme has objectives other than environmental protection or resource management (i.e. BSE testing) it is partially included here under the domain CEPA 03: Waste management through the application of a coefficient.
Farm Waste Management Scheme
The Farm Waste Management Scheme was introduced by the Department of Agriculture in 2001. It was amended in 2006 to specifically help farmers meet the requirements of the EU Nitrates Directive by providing grants for animal housing and storage facilities for silage and agricultural waste. The scheme is classified under CEPA 02: Wastewater management. It was co-funded by the EU. We estimated the EU contribution for the years 2005-2010 based on data from earlier and later years. A large increase in payments under this scheme from 2008-2010 is the reason for the peak in environmental transfers that can be observed in the tables and graphs during those years.
Food Institutional Research Measure (FIRM)
The Food Institutional Research Measure is funded by the Department of Agriculture, Food and the Marine and is the primary national funding mechanism for food research in higher education institutions and other public research institutes. Data on environment research grant payments was obtained directly from the Department of Agriculture, Food and the Marine. The programme is assigned to CEPA 08: Environmental research and development.
Forest Environment Protection Scheme (FEPS)
Under this scheme, which was introduced in 2007, capital grant and premium payments are made by the Department of Agriculture, Food and the Marine to farmers to encourage the establishment of woodland for biodiversity and habitat support and protection. FEPS is therefore classified under CEPA 06: Protection of biodiversity and landscape. Afforestation programmes cannot be classified as CReMA 11: Management of forest resources as this refers exclusively to the management of non-cultivated forest resources.
Geneva Convention on Long Range Transboundary Air Pollution
This ongoing contribution by government to an international organisation is a current transfer paid from the Environment Fund and is classified under the environmental domain CEPA 01: Protection of ambient air and climate.
GLAS (Green, Low-carbon Agri-environment Scheme)
GLAS was launched in 2014 with the first payments being made in 2015. It is funded by the Department of Agriculture, Food and the Marine and the EU under the Rural Development Programme. The scheme subsidises the implementation of farming practices that promote protection of biodiversity and help combat climate change so it is classified as CEPA 06: Protection of biodiversity and landscape and CEPA 01: Protection of ambient air and climate. As the majority of payments relate to practices that encourage biodiversity, 90% of the funding is classified as CEPA 06 while the remaining 10% is assigned to CEPA 01.
Global Environment Facility
This ongoing contribution by government to an international organisation is a current transfer paid from the Environment Fund. It is classified under the environmental domain CEPA 09: Other environmental protection activities. Through the Global Environment Facility, funds are made available to developing countries to help them meet the requirements of international environmental conventions and agreements.
Green Communities Programme
The Green Communities and Green Home programmes are run by the EPA and An Taisce as part of the National Waste Prevention Programme. The aims are to raise environmental awareness and to support positive environmental behaviour amongst households and community groups. The programmes are classified as CEPA 09: Other environmental protection activities and CReMA 16: Other resource management activities. The funding was distributed evenly between the environmental protection and resource management classes.
Green Healthcare Programme
The Green Healthcare programme is part of the National Waste Prevention Programme. It began in 2009 and is classified as CEPA 03: Waste management. Data were provided by the EPA for the years 2011-2015. We estimated the amount of funding provided under this programme for the years 2009-2010.
Green Home Programme
The EPA’s Green Home programme began in 2007 and provides householders with information on waste prevention, water conservation and energy conservation. It is classified as a social transfer in kind under CEPA 09: Other environmental protection activities and CReMA 16: Other resource management activities. The funding was distributed evenly between the classes. The EPA provided data on funding under this programme for the years 2011-2015. We estimated the amount of funding provided for the years 2007-2010.
Green Hospitality Awards
The Green Hospitality Award is an environmental certification introduced by the EPA in 2009 and aimed at the hospitality sector. It is classified under the environmental domain CEPA 03: Waste management. The EPA provided figures for the years 2011-2015. We made estimates of the amount of funding provided under this programme for 2007-2010.
Green Schools Programme
The Green Schools programme is run by An Taisce in partnership with local authorities throughout Ireland and has been supported by the Department of Communications, Climate Action and the Environment through the Environment Fund since 2006. It is assigned to CEPA 09: Other environmental protection activities and CReMA 16: Other resource management activities. The funding was distributed evenly between the classes.
Green Schools Travel Programme
Travel is one of the themes of the Green Schools programme (see previous entry). The Travel theme is funded separately from the other themes by the Department of Transport, Tourism and Sport. The programme has a number of objectives, including easing traffic congestion, improving children’s health and fitness and protecting the environment through reduced air pollutant and greenhouse gas emissions. The programme is partially included under domain CEPA 01: Protection of ambient air and climate through the application of a coefficient.
GreenBusiness.ie/SMILE
The Greenbusiness.ie project was launched by the EPA in 2008. It is aimed at helping enterprises to reduce their environmental impacts and in doing so, to reduce costs. SMILE (Saving Money through Industrial Linkages and Exchanges) is a system for identifying and delivering by-products from one industry for use as inputs in other industries. It is classified under CEPA 09: Other environmental protection activities and CReMA 16: Other resource management activities. The funding was distributed evenly between the classes. The EPA provided figures for the years 2011-2015 and estimates were made for 2008-2010.
Greener Homes Scheme
This SEAI capital grant programme ran from 2006 to 2011 with the aim of achieving wider deployment of renewable energy heating technologies in the residential sector. It is assigned to CReMA 13B: Heat/Energy saving and management.
Hen Harrier Farm Plan Scheme
The Hen Harrier is a threatened bird of prey that is listed in Annex I of the EU Birds Directive[7]. This NPWS scheme provides grants to farmers to conserve hen harrier habitats and is classified as CEPA 06: Protection of biodiversity and landscape.
Heritage Council Biodiversity Grants
The Heritage Council administers grant payments towards projects that enhance biodiversity at the local level in Ireland. These grants are classified as CEPA 06: Protection of biodiversity and landscape.
Heritage Council Wildlife Grants
From 2004-2010 the Heritage Council funded projects on Irish wildlife. These grants are classified as CReMA 12: Management of Wild Flora and Fauna.
Home Energy Saving Programme
This SEAI scheme was the pilot for the Better Energy Homes Scheme and is classified under CReMA 13B: Heat/Energy saving and management.
House of Tomorrow
House of Tomorrow was a capital grant programme run by the SEAI from 2001-2010 with the aim of encouraging energy efficient planning, design and construction practices in the Irish construction sector. It is classified under the resource management domain CReMA 13B: Heat/Energy saving and management.
Industry and Business Programme
The SEAI’s Industry and Business programme supports efforts across all business sectors to improve energy efficiency. It is classified under CReMA 13B: Heat/Energy saving and management.
Industry RD&D
This sustainable energy research, development and demonstration capital grant programme has been run by the SEAI since 2007. It is classified under CReMA 13B: Heat/Energy saving and management.
Landfill Remediation
The Department of Communications, Climate Action and the Environment provides capital for the remediation of former landfill sites. The programme is classified under the environmental domain CEPA 04: Protection and remediation of soil, groundwater and surface water.
Landfill Remediation (Environment Fund)
In 2011 and 2012 some of the capital for the landfill remediation programme (see previous entry) was sourced from the national Environment Fund. This expenditure is classified as CEPA 04: Protection and remediation of soil, groundwater and surface water.
Litter Management (Local Authorities)
The Department of Housing, Planning, Community and Local Government subsidises litter management measures by local authorities across Ireland. This funding is assigned to the domain CEPA 03: Waste management. Estimates were made for the years 2000-2008 based on total subsidies to local authorities for waste management.
Lobster V-Notching Scheme
The Lobster V-notching Scheme is an ongoing, EU co-funded capital grant scheme run by BIM that aims to protect female lobsters so that they can breed a number of times. As the programme objective is to preserve lobster stocks it is classified under CReMA 12: Management of Wild Flora and Fauna.
Local Agenda 21 Environmental Partnership Fund
The Local Agenda 21 Environmental Partnership Fund aims to promote, at local level, the objectives of the Agenda 21 action plan on sustainable development which was agreed at the UN Conference on Environment and Development in Rio de Janeiro in 1992. Capital grants are paid from the national Environment Fund. The programme is included here under CEPA 09: Other environmental protection activities and CReMA 16: Other resource management activities. The funding was distributed evenly between the classes.
Local Authority Estate Energy Retrofit
This capital transfer from the Department of Housing, Planning, Community and Local Government aims to make local authority dwellings more energy efficient and less costly to heat. It is classified as CReMA 13B: Heat/Energy saving and management.
Local Authority Waste Prevention Network
The Local Authority Waste Prevention Network is an EPA programme that aims to enable local authorities to implement resource efficiency programmes in partnership with businesses, public organisations and communities. The EPA provided data for the years 2011-2015. Estimates were made for the years 2005-2010. The funding was assigned to CEPA 03: Waste management.
Low Emission Slurry Scheme (LESS)
The principal objective of LESS is to promote the purchase of new equipment for the spreading of slurry by farmers, where this equipment results in lower emissions of nitrogen oxides to air. It is jointly funded by the European Union and the national exchequer and the first payments were made in 2017. It is classified under CEPA 01: Protection of ambient air and climate.
Marine Biodiversity Scheme
The objectives of the Marine Biodiversity Scheme are to reduce the impact of fisheries and aquaculture on the marine environment and to protect aquatic biodiversity and ecosystems. The EU and the Department of Agriculture, Food and the Marine co-fund projects on environment impact assessment, data collection, habitat mapping and habitat restoration under this capital grant scheme. It is classified as CEPA 06: Protection of biodiversity and landscape.
Marine Environment Protection Scheme
This BIM programme promoted an Environmental Management System for fishing operation and seafood produced in accordance with the system. It was co-funded by the EU and is classified under the resource management domain CReMA 12: Management of Wild Flora and Fauna.
Microgeneration Scheme
The SEAI’s Microgeneration programme provided funding to households and businesses to deploy small-scale electricity generators using renewable energy sources. It is classified as CReMA 13A: Production of energy from renewable resources.
National Biodiversity Data Centre
The National Biodiversity Data Centre was set up in 2007 and is funded by the Heritage Council. It is classified as CEPA 06: Protection of biodiversity and landscape. We included Heritage Council funding for maintaining biological records prior to 2007 under this programme. The National Biodiversity Data Centre works with other organisations such as the EPA and Inland Fisheries Ireland on projects such as monitoring native species like Irish butterflies, marine mammals and wild crops, as well as invasive species.
Native Woodland Conservation (NWC) Scheme
The aim of the NWC programme is to support the appropriate restoration of existing native woodlands as well as the ecosystems and habitats that native woodlands support. We distributed the funding evenly between CEPA 06: Protection of biodiversity and landscape and CReMA 11: Management of forest resources. Funding is provided by the Department of Agriculture, Food and the Marine.
Native Woodland Establishment (NWE) Scheme
Since 2007 the Department of Agriculture, Food and the Marine has made capital grant and premium payments to farmers to promote the establishment of native woodland species such as oak and ash with the objective of protecting their associated biodiversity and habitats. The NWE scheme is therefore classified under CEPA 06: Protection of biodiversity and landscape.
Natterjack Toad Grant Scheme
This NPWS scheme is aimed at getting farmers involved in natterjack toad conservation by digging ponds and is classified under CEPA 06: Protection of biodiversity and landscape.
Neighbourwood
Neighbourwoods are accessible, close-to-home woodland amenities. Grant payments are made to landowners, farmers and local authorities to provide access to local communities to their woodland. As this Department of Agriculture scheme has biodiversity as well as recreational objectives, it was partially included under CEPA 06: Protection of biodiversity and landscape.
Noise Pollution Control (Local Authorities)
The Department of Housing, Planning, Community and Local Government subsidises the implementation of air pollution, noise pollution and water quality control measures by local authorities. We included one-third of the total as a current transfer under CEPA 05: Noise and Vibration Abatement (see also Air pollution control (Local authorities)).
Ocean Energy Programme
This SEAI programme began in 2008 and funds research into the harnessing of ocean energy for use as a renewable energy source. It is classified as CReMA 13A: Production of energy from renewable resources.
OECD Environmental Compliance Indicators
This contribution by government to an international organisation is a current transfer paid from the national Environment Fund. It is classified under the environmental class CEPA 09: Other environmental protection activities.
On-farm Investment: Pollution Control
This capital grant scheme was run by the Department of Agriculture until 2006. Figures for 2004-2006 are estimated based on payments from previous years and total grants paid under the on-farm investment scheme in 2004-2006. The programme is assigned to CEPA 02: Wastewater management.
Operation and Aftercare of Landfill (Local Authorities)
The Department of Housing, Planning, Community and Local Government subsidises the operation, maintenance and aftercare of landfill by local authorities across Ireland. This funding is assigned to the domain CEPA 03: Waste management. Estimates were made for the years 2000-2008 based on total subsidies to local authorities for waste management.
Operation and Maintenance of Waste to Energy Facilities
The Department of Housing, Planning, Community and Local Government subsidises the operation and maintenance of waste to energy facilities by local authorities. This funding is assigned to the domain CReMA 13A: Production of energy from renewable resources.
Organic Farming Scheme
This EU co-funded Department of Agriculture, Food and the Marine scheme is classified under CEPA 04: Protection and remediation of soil, groundwater and surface water as per Eurostat methodological guidelines for the Environmental Subsidies and Similar Transfers data collection module. The EU and national contributions to the total funding were estimated for the years 2009-2010 based on later years.
OSPAR Convention for the Protection of the Marine Environment of the North-East Atlantic
This contribution by government to an international organisation is a current transfer paid from the national Environment Fund. It is classified under the environmental domain CEPA 06: Protection of biodiversity and landscape.
Owenduff, Twelve Bens and Other Farm Plan Schemes
The NPWS Farm Plan Scheme was launched in 2006. It is an agri-environment grant scheme that aims to encourage farmers to implement habitat- and species-specific protection measures. It is classified as CEPA 06: Protection of biodiversity and landscape.
Packaging Prevention Programme
The Packaging Prevention Programme aims to help Irish businesses reduce packaging. The programme is classified as CEPA 03: Waste management. The EPA provided data for the years 2011-2015. Estimates were made for the years 2007-2010.
PSO Levy: Electricity Generation from Renewable Sources
The PSO Levy is charged to electricity consumers in Ireland. Some of the funding is used to subsidise electricity generation from renewable sources and is classified under CReMA 13A: Production of energy from renewable resources.
Public Sector Energy Efficiency Programme
The Public Sector Energy Efficiency Programme provides capital grants to retrofit projects demonstrating energy-efficient technology upgrades to existing buildings and facilities. The programme is run by the SEAI and is classified as CReMA 13B: Heat/Energy saving and management.
Public Sector Energy Programme
SEAI capital funding towards the Energy Management Bureau, the Public Sector Design Studies Support Scheme and the Public Sector Model Solutions Investments Support Scheme is included under this heading. The schemes were in operation between 2002 and 2010. They are classified as CReMA 13B: Heat/Energy saving and management.
Radiological Protection Institute of Ireland
The RPII was funded by the Department of the Environment until it was merged with the EPA in 2014. Its main objective was to protect the Irish public from the health and safety risks posed by ionising radiation. A portion of the funding (approximately 10%) it received from the exchequer was included under CEPA 07: Protection against Radiation.
Rainwater Harvesting Scheme
The objective of this Department of Agriculture scheme is to conserve water by maximising the use of rainfall run-off. It offers capital grants towards rainwater harvesting facilities and equipment. It is classified under CReMA 10: Management of Water.
Recycling Facilities (Local Authorities)
The Department of Housing, Planning, Community and Local Government subsidises the operation and maintenance of waste treatment facilities by local authorities across Ireland. This funding is assigned to the domain CEPA 03: Waste management. Estimates were made for the years 2000-2008 based on total subsidies to local authorities for waste management.
ReHeat Deployment Scheme
The ReHeat Deployment programme aimed to increase the deployment of renewable heating technologies (e.g. solar thermal, bio-energy and heat pump) in the commercial and industrial sectors. This SEAI programme closed in 2011 and is classified under CReMA 13B: Heat/Energy saving and management.
Renewable Energy Educational Support
This SEAI programme provided information to Irish organisations interested in using renewable energy sources for energy production. It ran from 2005 to 2008 and is allocated to CReMA 13A: Production of energy from renewable resources.
Renewable Energy Information Office (REIO)/Electricity and Heat Infrastructure
The REIO and the Electricity and Heat Infrastructure grants both formed part of SEAI’s Alternative Energy programme and are classified under CReMA 13A: Production of energy from renewable resources.
Renewable Energy RD&D
The Renewable Energy Research, Development and Demonstration programme was launched by the SEAI in 2001. It is a capital grant programme and is classified as CReMA 13A: Production of energy from renewable resources.
REPS (Rural Environment Protection Scheme)
REPS was an agri-environment scheme that closed in 2015. It was co-funded by the Department of Agriculture, Food and the Marine and the EU and subsidised farming practices that were compatible with the protection of biodiversity. It is classified under the environmental domain CEPA 06: Protection of biodiversity and landscape.
Research Stimulus Fund
The Research Stimulus Fund (RSF) provides funding to Irish research institutes for 'public good' agricultural production related research. A number of environmental protection research projects are funded under the RSF, which is run by the Department of Agriculture, Food and the Marine. The programme is assigned to CEPA 08: Environmental research and development.
Rural Wastewater Programme (Capital)
The Department of Housing, Planning, Community and Local Government funds capital investment in rural wastewater facilities through the Rural Water Programme. The programme is assigned to CEPA 02: Wastewater management.
Salmon Conservation Fund
This programme for the rehabilitation of salmon stocks is funded through salmon fishing licences and prioritises rivers in special areas of conservation which have the greatest prospect of recovery. It is run by Inland Fisheries Ireland and is assigned to CReMA 12: Management of Wild Flora and Fauna.
Salmon Hardship Scheme
BIM ran this compensation scheme for drift-net salmon fishermen from 2007-2009. It is classified under the resource management domain CReMA 12: Management of Wild Flora and Fauna.
Schools/Education Programme
The SEAI runs energy workshops in schools throughout Ireland under this programme which is classified as a current transfer under CReMA 13B: Heat/Energy saving and management.
Sea Fisheries Protection Authority (fisheries conservation)
Capital grants for the Conservation and Management of Fisheries were made by the Department of the Marine and Natural Resources up to and including 2006, with some of the expenditure being recouped from the EU. In 2007 the Sea Fisheries Protection Authority took over the role. The programme is classified under the resource management domain CReMA 12: Management of wild flora and fauna.
Seafood Environmental Management Programme Part A
The Seafood Environmental Management & Certification Grant Aid Scheme encourages the implementation of a Seafood Environmental Management System (SEMS) on Irish fishing vessels. Part A involves financial payments to fishing collectives. The programme is run by BIM and is co-funded by the European Fisheries Fund. It is classified under the resource management domain CReMA 12: Management of Wild Flora and Fauna.
Seafood Environmental Management Programme Part B
Part B of this scheme concerns financial assistance to fishing vessel owners (operators). See Part A above for further details.
Stockholm Convention on Persistent Organic Pollutants
This current transfer is paid from the national Environment Fund. It is a contribution by government to an international organisation and is classified under the environmental domain CEPA 01: Protection of ambient air and climate.
Stop Food Waste Programme
In 2009 the EPA launched the Stop Food Waste programme aimed at food waste prevention and home composting. Data for 2011-2015 were provided by the EPA while estimates were made for 2009-2010. The programme is classified as a social transfer in kind CEPA 03: Waste management.
Street Cleaning (Local Authorities)
The Department of Housing, Planning, Community and Local Government subsidises street cleaning by local authorities across Ireland. This funding is assigned to the domain CEPA 03: Waste management. Estimates were made for the years 2000-2008 based on total subsidies to local authorities for waste management.
STRIVE (Sustainable Technology, Research and Innovation for the Environment) Research Programme
The EPA followed up the ERTDI research programme with STRIVE in 2007. It is classified under CEPA 08: Environmental research and development and CReMA 15: Research and development activities for resource management. The funding was distributed evenly between the classes.
Sustainable Fisheries Scheme
This programme is run by BIM and is co-funded by the European Fisheries Fund. It is classified under CReMA 12: Management of Wild Flora and Fauna.
Traditional Buildings Scheme
The Traditional Buildings Scheme is funded by the Department of Agriculture, Food and the Marine and is available to farmers participating in GLAS (see above). It is classified under CEPA 06: Protection of biodiversity and landscape.
UN Environment Fund
The annual contribution by government to the UN Environment Fund is a current transfer paid from the national Environment Fund. It is classified under the environmental class CEPA 09: Other environmental protection activities.
UN Framework Convention on Climate Change (UNFCCC)
This annual contribution by government to an international organisation is a current transfer paid from the national Environment Fund. It is classified under the environmental domain CEPA 01: Protection of ambient air and climate.
Vehicle Registration Tax Relief on Electric Vehicles
This scheme was introduced to promote the use of electric vehicles, thereby reducing air pollutant and greenhouse gas emissions in the transport sector. It is classified under the environmental domain CEPA 01: Protection of ambient air and climate.
Vienna Convention on the Protection of the Ozone Layer
This ongoing annual contribution by government to an international organisation is a current transfer paid from the Environment Fund. It is classified under the environmental domain CEPA 01: Protection of ambient air and climate.
Warmer Homes Scheme
The Warmer Homes scheme began in 2001. This SEAI programme supports energy efficiency improvements to privately owned homes experiencing fuel poverty and is classified as a social transfer in kind under CReMA 13B: Heat/Energy saving and management. It was partially included for its environmental objectives through the application of a coefficient.
Warmth and Wellbeing Scheme
The SEAI Warmth and Wellbeing Scheme aims to make homes warmer and healthier to live in. It does this by providing extensive energy efficiency upgrades to those in energy poverty who are living with chronic respiratory conditions. It is classified as a social transfer in kind under CReMA 13B: Heat/Energy saving and management. It was partially included for its environmental objectives through the application of a coefficient.
Waste Collection Services (Local Authorities)
The Department of Housing, Planning, Community and Local Government subsidises waste collection services by local authorities across Ireland. This funding is assigned to the domain CEPA 03: Waste management. Estimates were made for the years 2000-2008 based on total subsidies to local authorities for waste management.
Waste Management Planning and Regulations (Local Authorities)
The Department of Housing, Planning, Community and Local Government subsidises waste regulation, monitoring and enforcement activities and waste management planning activities by local authorities across Ireland. This funding is assigned to CEPA 03: Waste management. Estimates were made for the years 2000-2008 based on total subsidies to local authorities for waste management.
Waste Processing Facilities Scheme
The waste processing facilities scheme provides capital grants to farmers to invest in on-farm anaerobic digestion facilities. The funding is provided by the Department of Agriculture, Food and the Marine and is classified as CEPA 03: Waste management.
Wastewater Treatment Facilities (Local Authorities)
The Department of Housing, Planning, Community and Local Government subsidises the operation and maintenance of wastewater treatment facilities by local authorities across Ireland. This funding is assigned to the domain CEPA 02: Wastewater management. Estimates were made for the years 2000-2008 based on total subsidies to local authorities for wastewater management.
Water Services Investment Programme (Wastewater)
The Water Services Investment Programme (WSIP) was run by the Department of the Environment, Community and Local Government up to and including 2013 with the objective of funding major capital water and wastewater schemes. As water treatment and water quality are mainly health issues the part of the WSIP that relates to water schemes is not included here. The portion that relates to wastewater management is included under CEPA 02: Wastewater management.
Whitefish Fleet Decommissioning Scheme
The whitefish fleet decommissioning scheme ran from 2005-2010 and was a compensation programme funded by the EU and the Department of Agriculture, Food and the Marine. The objective of the scheme was to improve the management of fish stocks so the programme is assigned to CReMA 12: Management of Wild Flora and Fauna. The EU and national contributions were estimated for the years 2008-2009 based on the figures from later years.
Certain subsidies or other support measures that have social or economic objectives may incentivise behaviour that could be damaging to the environment. For example, transport fuel tax rebates encourage the consumption of fossil fuels. Such transfers are referred to as potentially environmentally damaging subsidies (PEDS). The CSO is developing a new, separate release on PEDS.
[1] United Nations System of Environmental-Economic Accounting 2012 Central Framework: http://unstats.un.org/unsd/envaccounting/seeaRev/SEEA_CF_Final_en.pdf
[2] System of National Accounts 2008: https://unstats.un.org/unsd/nationalaccount/sna2008.asp
[3] European System of Accounts 2010: http://ec.europa.eu/eurostat/web/esa-2010
[4] http://eur-lex.europa.eu/LexUriServ/LexUriServ.do?uri=OJ:L:2011:192:0001:0016:EN:PDF
[5] A similar system is used by the UN, OECD and the EU as described here: https://europa.eu/capacity4dev/public-environment-climate/minisite/tools-and-methods/short-guide-use-rio-markers
 Hide Background Notes
Scan the QR code below to view this release online or go to
http://www.cso.ie/en/releasesandpublications/er/esst/environmentalsubsidiesandsimilartransfers2017/
 Show Table 1 Environmental Transfers by Environmental Protection and Resource Management Domain, 2000-2017
 Hide Table 1 Environmental Transfers by Environmental Protection and Resource Management Domain, 2000-2017