
No link available
| 2018 | 2019 | Annual Change | |
| € million | € million | % | |
| Total Earnings | 71,517 | 76,456 | 6.9 |
| Total Other Labour Costs | 11,201 | 12,202 | 8.9 |
| Total Labour Costs | 82,718 | 88,658 | 7.2 |
| € | € | % | |
| Average Earnings | 38,871 | 40,283 | 3.6 |
| Average Other Labour Costs | 6,088 | 6,429 | 5.6 |
| Average Total Labour Costs | 44,959 | 46,712 | 3.9 |
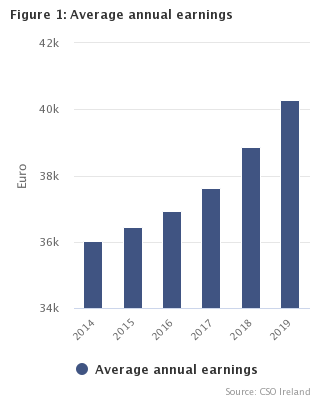
Average annual earnings increased by 3.6% to €40,283 in 2019, from €38,871 in 2018. This compares to an annual increase of 3.3% in 2018 from €37,637 in 2017. See Figure 1 and Table 5.
Key features of the annual results for 2019 include:
Total annual labour costs increase by 7.2% to €88.7 billion in 2019
The total cost of employing labour in 2019 was €88.7 billion, an increase of 7.2% from 2018. Total annual labour costs were €66.2 billion in 2014 and have increased each year between 2014 and 2019. See Figure 2, Table 1 and Table 4.
| Group | Other Labour Costs | Irregular Earnings | Overtime Earnings | Apprentice Earnings | Part-time Regular Earnings | Full-time Regular Earnings |
|---|---|---|---|---|---|---|
| 2014 | 8901899000 | 3036471000 | 1463052000 | 375935000 | 7069960000 | 45362784000 |
| 2015 | 9405691000 | 3034388000 | 1530884000 | 422469000 | 7292913000 | 47724290000 |
| 2016 | 10004418000 | 3338809000 | 1682113000 | 425184000 | 7673338000 | 49710689000 |
| 2017 | 10623117000 | 3558177000 | 1795179000 | 447121000 | 8231625000 | 52554397000 |
| 2018 | 11201064000 | 4060750000 | 1930348000 | 456469000 | 8638449000 | 56430662000 |
| 2019 | 12201825000 | 4419789000 | 1982861000 | 499884000 | 8965795000 | 60587948000 |
Full-time employee regular earnings comprised €60.6 billion (68.3%) of the €88.7 billion total labour costs, while part-time employee regular earnings were €9 billion (10.1%). The other components were: €12.2 billion (13.8%) other labour costs, €4.4 billion (5.0%) irregular earnings, €2 billion (2.2%) overtime earnings and €0.5 billion (0.6%) apprentice/trainee earnings. See Figure 3 and Table 1.
The Industry sector had the highest total annual labour costs of €13.4 billion in 2019 followed by the Wholesale and retail trade sector (€10.9 billion) and the Human health and social work sector (€10.6 billion). The Arts, entertainment, recreation and other services activities sector and the Accommodation and Food Services sector had the lowest total annual labour costs of €1.6 billion and €3.9 billion respectively. See Table 4.
Figure 4 outlines the annual growth of each component of the total annual labour costs from 2014 to 2019. Full-time regular earnings increased each year from 2014 to 2019, with a 7.4% rise in 2019. The changes in full-time regular earnings are strongly linked to the number of full-time employees employed. See Table 1.
Part-time regular earnings increased every year from 2014 to 2019, with a 3.8% rise in 2019. See Figure 4 and Table 1.
Total annual earnings of apprentices/trainees increased each year between 2014 and 2019, with an increase of 9.5% in 2019. See Figure 4 and Table 1.
Total annual overtime earnings were €1.5 billion in 2014 and has increased each year since with a 2.7% increase in 2019 reaching €2 billion. See Figure 4 and Table 1.
Total annual irregular earnings were €3 billion in 2014, decreasing by 0.1% in 2015 and increasing each year to 2019. Annual irregular earnings were €4.4 billion in 2019, an increase of 8.8% on 2018 and a 45.6% increase over the five-year period. See Figure 4 and Table 1.
Total annual other labour costs have increased each year from €8.9 billion in 2014 to €12.2 billion in 2019, a cumulative increase of 37.1%. See Figure 4, Table 1 and Table 3.
| Proportion of Total Annual Labour Costs 2019 (%) | |
| €60,588 millionFull-time Regular Earnings | 68.3 |
| €8,966 millionPart-time Regular Earnings | 10.1 |
| €500 millionApprentice/Trainee Earnings | 0.6 |
| €1,983 millionOvertime Earnings | 2.2 |
| €4,420 millionIrregular Earnings | 5.0 |
| €12,202 millionOther Labour Costs | 13.8 |
| 2014 - 2015 | 2015 - 2016 | 2016 - 2017 | 2017-2018 | 2018-2019 | |
| FT Regular Earnings | 5.20580740165951 | 4.16224020048486 | 5.72049880609206 | 7.37578585237391 | 7.36691198230751 |
| PT Regular Earnings | 3.15275813295615 | 5.2160320311536 | 7.27587869625846 | 4.94193109480537 | 3.79005371365067 |
| Apprentice Earnings | 12.3969140728917 | 0.639053254437867 | 5.1505174035748 | 2.10243793334824 | 9.50711938663745 |
| Overtime Earnings | 4.63399630920649 | 9.87654320987653 | 6.72373818441235 | 7.525623885918 | 2.72496503134229 |
| Irregular Earnings | -0.0691585707228687 | 10.0316372264698 | 6.57122319396189 | 14.1251194424147 | 8.84062253743105 |
| Other Labour Costs | 5.65946595670588 | 6.36528913318518 | 6.18427891727641 | 5.44097297399064 | 8.93394398764406 |
Average annual earnings up 3.6% to €40,283 in 2019
Average annual earnings for all employees, including regular, overtime and irregular earnings, were €40,283 in 2019, an increase of 3.6% on 2018. Average annual earnings were €48,946 for full-time employees in 2019, an annual increase of 2.8%, while part-time employees earned €18,305 on average in the year, up 3.7% from 2018. See Figure 5 and Table 5.
Average annual earnings have continued to recover since the downturn, rising by €4,246 (11.8%) from €36,037 in 2014 to €40,283 in 2019. Average annual earnings for full-time employees has increased by 9.2% in the five-year period, up from €44,829 in 2014 to €48,946 in 2019. Average annual earnings for part-time employees increased from €15,942 in 2014 to €18,305 in 2019, an increase of 14.8%. See Figure 5 and Table 5.
| All Employees | Full-time Employees | Part-time Employees | |
| 2014 | 36037.3874211656 | 44828.5386916269 | 15941.6755774261 |
| 2015 | 36457.3512050368 | 45061.4108903179 | 16239.5926819177 |
| 2016 | 36933.2912107602 | 45640.3265483131 | 16534.5884095924 |
| 2017 | 37636.6403602365 | 46399.4861637648 | 17055.1883053305 |
| 2018 | 38871.3677208407 | 47595.6469155248 | 17651.1455750286 |
| 2019 | 40283.0368506408 | 48946.2668936457 | 18304.985816624 |
Average annual total earnings rise in all 13 economic sectors
Average annual total earnings rose in all 13 economic sectors in 2019. The largest percentage increase was 8.3% in the Administrative and support services sector where average annual earnings rose from €29,623 to €32,071, followed by an increase of 5% from €61,269 to €64,345 in the Information and communication sector. The Public administration and defence sector recorded the lowest average annual earnings growth of 1.3% in the year increasing from €49,724 to €50,376. See Figure 6 and Table 5.
Average annual total earnings comprised of 91.6% regular earnings, 2.6% overtime earnings and 5.8% irregular earnings. Figure 6 illustrates these components of average annual total earnings across economic sectors in 2019.
Average annual total earnings vary widely across the economy with the highest averages in Information and communication sector at €64,345 and Financial, insurance and real estate sector at €60,409. The Financial, insurance and real estate sector had the highest average regular earnings of €54,517 while the Information and communication sector had the highest average irregular earnings of €9,886. The Industry sector recorded the highest average annual overtime earnings of €2,292 in 2019. The Accommodation and food services sector had average annual total earnings of €19,153, the lowest of the sectors. This comprised of €18,510 regular earnings, €229 overtime earnings and €414 irregular earnings. See Figure 6 and Table 5.
| Group | Irregular Earnings 2018 | Overtime Earnings 2018 | Regular Earnings 2018 | Irregular Earnings 2019 | Overtime Earnings 2019 | Regular Earnings 2019 |
|---|---|---|---|---|---|---|
| Industry | 2991.71044162271 | 2439.65708406879 | 40967.1325898564 | 3017.24454739881 | 2291.915966677 | 41794.4678761017 |
| Construction | 899.58168298976 | 1832.39037865807 | 37828.862092367 | 957.435675085053 | 2119.29359719244 | 38609.7303543399 |
| Wholesale & Retail | 1738.96130526284 | 669.544630151939 | 27482.2815204195 | 2083.01210649721 | 649.732878941278 | 28269.4880565705 |
| Transportation | 2304.70643173472 | 1561.21072812773 | 38282.2746129821 | 2050.91564152762 | 1570.73850234887 | 39505.2978392521 |
| Accommodation & Food | 493.379526954432 | 197.210395331908 | 17570.9904310433 | 413.920359871243 | 229.281183640062 | 18510.0031471116 |
| Information & Comm | 9006.57922370066 | 375.785988269029 | 51887.0718365967 | 9886.30447515512 | 447.451716319142 | 54011.4778167245 |
| Financial & Real Estate | 5433.3449697531 | 559.94022445596 | 52585.0880517549 | 5353.95884583029 | 538.056725397497 | 54516.9629447745 |
| Professional & Technical | 3362.06939539552 | 398.327906102563 | 43870.7951587216 | 3040.89597672746 | 428.501767317502 | 45786.2842223604 |
| Admin & Support Service | 1921.73283878849 | 713.952127245662 | 26987.7365005329 | 2311.48200295791 | 839.381974486331 | 28919.6990382641 |
| Public Admin & Defence | 2415.98122989637 | 2010.16260637292 | 45297.4861781751 | 2317.37055458491 | 1857.9197237579 | 46200.9338433051 |
| Education | 463.96618951331 | 216.729942609187 | 43372.6607060906 | 494.536164938965 | 186.450296813178 | 44063.6413428829 |
| Health & Social | 1601.82970454585 | 1340.25061323499 | 34334.687263672 | 1822.30044863793 | 1308.83215744896 | 35259.104811688 |
| Arts & Entertainment | 1066.22293008528 | 429.01901398136 | 23883.1202013719 | 1106.62465019997 | 359.744742672775 | 24852.1082232531 |
| All Sectors | 2207.13421929577 | 1049.19952735396 | 35615.0339741911 | 2328.68396344068 | 1044.72342419222 | 36909.6294630085 |
| Total | All Sectors | K-L | Financial, insurance and real estate activities |
| B-E | Industry | M | Professional, scientific and technical activities |
| F | Construction | N | Administrative and support service activities |
| G | Wholesale and retail trade; repair of motor vehicles and motorcycles | O | Public Administration and defence; compulsory social security |
| H | Transportation and storage | P | Education |
| I | Accommodation and food service activities | Q | Human health and social work activities |
| J | Information and communication | R-S | Arts, entertainment, recreation and other service activities |
Average annual hourly earnings up 3.5% to €23.88 in 2019
The average annual hourly earnings of all employees were €23.88 in 2019, an annual increase of 3.5%, while average annual weekly paid hours were 32.4, an increase of 0.1% in the year. The Education sector recorded the highest average annual hourly earnings of €36.51, yet also recorded the lowest number of average annual weekly paid hours of 23.6. The Information and communication sector and the Financial, insurance and real estate sector had the next highest earnings rate, with average annual hourly earnings of €33.35 and €33.29 and average annual weekly paid hours of 37.1 and 34.9 respectively.
The Industry sector had the highest average annual weekly paid hours of 38.3. The Information and communication sector and the Construction sector had the next highest hours, working an average of 37.1 and 37.0 hours per week in 2019. Figure 7 illustrates the components of average annual hourly earnings by economic sectors, while Figure 8 illustrates the components of average annual weekly paid hours. See Table 8 and Table 9.
| X Axis Label | Irregular Earnings | Overtime Earnings | Regular Earnings |
|---|---|---|---|
| Industry | 1.51670582663191 | 1.15209829571373 | 21.009206231995 |
| Construction | 0.49827459749207 | 1.10293588549934 | 20.0935147417366 |
| Wholesale & Retail | 1.30950647995804 | 0.408461099463386 | 17.7718975706899 |
| Transportation | 1.1100177624308 | 0.850131327899243 | 21.3814656360153 |
| Accommodation & Food | 0.289971501281839 | 0.160622707847633 | 12.9671645119586 |
| Information & Comm | 5.12451844367873 | 0.231934448174799 | 27.9965901250281 |
| Financial & Real Estate | 2.95032825012037 | 0.296499095868809 | 30.041870047619 |
| Professional & Technical | 1.71072912400225 | 0.241063968858737 | 25.7581747282692 |
| Admin & Support Service | 1.36837764346532 | 0.496906974289685 | 17.1202153289821 |
| Public Admin & Defence | 1.20612190420085 | 0.966991520038792 | 24.0462010672807 |
| Education | 0.403505935812907 | 0.15213002977746 | 35.9527615893949 |
| Health & Social | 1.11618815138849 | 0.801680616054673 | 21.5967652583236 |
| Arts & Entertainment | 0.763057903471023 | 0.248057070732164 | 17.1364315752804 |
| All Sectors | 1.38023606228346 | 0.619218823945445 | 21.8767348554647 |
| X Axis Label | Average Overtime Weekly Paid Hours | Average Regular Weekly Paid Hours |
|---|---|---|
| Industry | 1.60905495381265 | 36.6474959112119 |
| Construction | 1.18749305058949 | 35.7644700106208 |
| Wholesale & Retail | 0.737082796340721 | 29.8530102944776 |
| Transportation | 1.18194206164054 | 34.3496383768763 |
| Accommodation & Food | 0.338098713530563 | 27.1128986617737 |
| Information & Comm | 0.328118576441565 | 36.7721947498477 |
| Financial & Real Estate | 0.260311972253318 | 34.6377530247507 |
| Professional & Technical | 0.323618596489881 | 33.8599163435182 |
| Admin & Support Service | 0.69870317174022 | 31.7861720322926 |
| Public Admin & Defence | 1.09425843016804 | 35.8545924299196 |
| Education | 0.0662405656531716 | 23.5029563658649 |
| Health & Social | 0.840254127161466 | 30.5561008272337 |
| Arts & Entertainment | 0.494869551157612 | 27.3945516530151 |
| All Sectors | 0.759226464486655 | 31.6862262635295 |
Components of earnings
In order to change their wage bill, employers have three options available to them, namely: employment level and composition, hourly wage rate and weekly working hours of employees.
Total earnings = hourly wage rate x hours worked x employees
The total wage bill has increased each year from 2014 to 2019, as has each of the individual components.
Total annual earnings increased by 6.9% from €71.5 billion in 2018 to €76.5 billion in 2019; this was due to increases of 3.2% in employment, 3.5% in average hourly earnings and 0.1% in average weekly paid hours. See Figure 9 and Table 11.
| Total Earnings | Average Employment | Average Hourly Earnings | Average Weekly Paid Hours | |
| 2014 - 2015 | 4.70568256313945 | 3.49954461870337 | 0.16521512290448 | 0.998518144843473 |
| 2015 - 2016 | 4.70825907343004 | 3.35893850683556 | 0.776281160903584 | 0.525384204759347 |
| 2016 - 2017 | 5.97860391479887 | 3.99808811390123 | 1.69475387984385 | 0.205887833053864 |
| 2017 - 2018 | 7.40417378814086 | 3.99253998683756 | 2.84260881583229 | 0.426114793775922 |
| 2018 - 2019 | 6.90691989795292 | 3.16049931051024 | 3.50490079201655 | 0.122508933585973 |
Increase in total annual earnings of full-time employees from 2014 to 2019
Total annual earnings of full-time employees rose each year from 2014 to 2019 as did full-time employment. Full-time average weekly paid hours increased from 36.8 hours in 2014 to 37.1 hours in 2016, fell to 37.0 hours in 2017 and remained unchanged in 2018, before decreasing in 2019 to 36.8 hours. Average hourly earnings increased from 2014 to 2019. See Figure 10 and Table 11.
Full-time employment increased in 2019 by 4.4% while average hourly earnings increased by 3.4% to €25.61 and average weekly paid hours decreased by 0.6% to 36.8 hours. These contributed to total annual earnings increasing by 7.4% to €66.5 billion in the year. See Figure 10 and Table 11.
| Total Earnings | Average Employment | Average Hourly Earnings | Average Weekly Paid Hours | |
| 2014 - 2015 | 4.87807457790815 | 4.3360767278878 | 0.290868963427754 | 0.227941124500238 |
| 2015 - 2016 | 4.62437881338273 | 3.297291658584 | 0.799061452355212 | 0.481814545176746 |
| 2016 - 2017 | 5.80510049142324 | 4.07398305795859 | 1.90822818787651 | -0.240290177728275 |
| 2017 - 2018 | 7.81323164243695 | 5.10369905766111 | 2.58951493184414 | -0.0112620950666581 |
| 2018 - 2019 | 7.38213206898311 | 4.41903677959727 | 3.42760078919891 | -0.570354861457799 |
Increase in total annual earnings of part-time employees from 2014 to 2019
Total annual earnings and average weekly paid hours of part-time employees rose each year from 2014 to 2019. Part-time average hourly earnings increased each year from 2014 to 2019, except for 2015 which recorded a decrease. See Figure 11 and Table 11.
Employment for part-time employees decreased in the year to 2019 by 0.1%. All other components rose, with average hourly earnings up 3.0% to €16.66 and average weekly paid hours up 0.7% to 21.1 hours. These contributed to an increase in total annual earnings of 3.6% to €9.5 billion in the year. See Figure 11 and Table 11.
| Total Earnings | Average Employment | Average Hourly Earnings | Average Weekly Paid Hours | |
| 2014 - 2015 | 3.18191893305948 | 1.28903534130205 | -0.478255325182283 | 2.35832833040102 |
| 2015 - 2016 | 5.49366938274125 | 3.6115432001154 | 0.933896149944256 | 0.874459026979036 |
| 2016 - 2017 | 7.17643084630064 | 3.90493142188641 | 1.07539441777534 | 2.05109885918276 |
| 2017 - 2018 | 4.98773870286408 | 1.44302791663298 | 2.87412730118522 | 0.602833735625455 |
| 2018 - 2019 | 3.5700107083675 | -0.129431700492102 | 2.99168618501048 | 0.691852621321856 |
Average annual other labour costs 13.8% of average annual total labour costs in 2019
Average annual other labour costs accounted for 13.8% of average annual total labour costs in 2019. This represents a rise from 2014 when average annual other labour costs were 13.4% of average annual total labour costs. See Table 1.
Other labour costs are comprised of statutory social contributions (e.g. employer PRSI), non-statutory contributions (e.g. employer pension contributions), benefits in kind (BIK), other expenses (e.g. employer training expenses) and subsidies and refunds. Average annual statutory social contributions increased each year since 2014 and were €3,888 in 2019, an increase of 4.7% in the year and 16.6% over 5 years. Average annual non-statutory social contributions have seen fluctuations over the period from 2014 to 2019 (falling in 2015 and 2018 and rising in 2016 and 2017), culminating in a rise of 6.5% over the 5 years. Average annual other expenses have increased by 12.2% since 2014, while average annual BIK has had an upward trend over the period 2014 to 2019, increasing by 38.0% over the five years. See Figure 12 and Table 10.
| Statutory Social Contributions | Non-Statutory Social Contributions | Other Expenses | Benefits in Kind | |
| 2014 | 3332.78942085212 | 1693.60548039969 | 310.428811530349 | 326.725881628743 |
| 2015 | 3401.7529557374 | 1680.25545233627 | 314.310321898033 | 368.683306627357 |
| 2016 | 3477.50934735113 | 1745.95937604564 | 319.123354657199 | 393.020686802771 |
| 2017 | 3559.51189743405 | 1751.96436706564 | 325.24611796392 | 418.032437119771 |
| 2018 | 3711.4896876377 | 1664.25164909497 | 335.166627614345 | 441.774624339509 |
| 2019 | 3887.55736432804 | 1803.36280725062 | 348.18692654171 | 450.966516674948 |
| Table 1 Total labour costs components | ||||||||
| Total Labour Costs Components | 2014 | 2015 | 2016 | 2017 | 2018 | 2019 | Annual change (2018-2019) | Five year change (2014-2019) |
| €/M | €/M | €/M | €/M | €/M | €/M | % | % | |
| Full-time Regular Earnings | 45,362.8 | 47,724.3 | 49,710.7 | 52,554.4 | 56,430.7 | 60,587.9 | 7.4 | 33.6 |
| Part-time Regular Earnings | 7,070.0 | 7,292.9 | 7,673.3 | 8,231.6 | 8,638.4 | 8,965.8 | 3.8 | 26.8 |
| Apprentices/Trainees Earnings | 375.9 | 422.5 | 425.2 | 447.1 | 456.5 | 499.9 | 9.5 | 33.0 |
| Overtime Earnings | 1,463.1 | 1,530.9 | 1,682.1 | 1,795.2 | 1,930.3 | 1,982.9 | 2.7 | 35.5 |
| Irregular Earnings | 3,036.5 | 3,034.4 | 3,338.8 | 3,558.2 | 4,060.8 | 4,419.8 | 8.8 | 45.6 |
| Total Earnings | 57,308.2 | 60,004.9 | 62,830.1 | 66,586.5 | 71,516.7 | 76,456.3 | 6.9 | 33.4 |
| Other Labour Costs | 8,901.9 | 9,405.7 | 10,004.4 | 10,623.1 | 11,201.1 | 12,201.8 | 8.9 | 37.1 |
| Total Labour Costs | 66,210.1 | 69,410.6 | 72,834.6 | 77,209.6 | 82,717.7 | 88,658.1 | 7.2 | 33.9 |
| Table 2 Total annual earnings by economic sector | |||||||||
| NACE Principal Activity | 2014 | 2015 | 2016 | 2017 | 2018 | 2019 | Annual change (2018-2019) | Five year change (2014-2019) | |
| €/M | €/M | €/M | €/M | €/M | €/M | % | % | ||
| B-E | Industry | 8,858.3 | 9,312.7 | 9,728.2 | 10,211.9 | 10,465.1 | 10,905.0 | 4.2 | 23.1 |
| F | Construction | 2,517.6 | 2,818.2 | 3,307.8 | 3,616.8 | 4,287.5 | 4,563.4 | 6.4 | 81.3 |
| G | Wholesale and retail trade; repair of motor vehicles and motorcycles | 7,748.8 | 8,129.8 | 8,496.7 | 8,939.6 | 9,094.7 | 9,411.6 | 3.5 | 21.5 |
| H | Transportation and storage | 2,409.9 | 2,551.8 | 2,704.5 | 2,812.8 | 3,219.4 | 3,615.7 | 12.3 | 50.0 |
| I | Accommodation and food services | 2,449.1 | 2,512.8 | 2,737.4 | 3,037.6 | 3,322.2 | 3,475.5 | 4.6 | 41.9 |
| J | Information and communication | 3,185.2 | 3,481.5 | 3,677.8 | 3,979.8 | 4,462.7 | 4,937.6 | 10.6 | 55.0 |
| K-L | Financial, insurance and real estate | 4,782.3 | 4,788.9 | 5,109.8 | 5,158.9 | 5,335.4 | 5,860.3 | 9.8 | 22.5 |
| M | Professional, scientific and technical | 3,421.0 | 3,663.3 | 4,050.3 | 4,204.6 | 4,518.2 | 4,767.0 | 5.5 | 39.3 |
| N | Administrative and support services | 1,964.0 | 2,141.7 | 2,249.8 | 2,549.2 | 3,064.5 | 3,478.1 | 13.5 | 77.1 |
| O | Public administration and defence | 5,284.3 | 5,529.2 | 5,317.7 | 5,746.1 | 6,303.7 | 6,889.8 | 9.3 | 30.4 |
| P | Education | 5,706.0 | 5,752.5 | 5,846.8 | 6,361.5 | 7,000.8 | 7,572.9 | 8.2 | 32.7 |
| Q | Human health and social work | 7,840.6 | 8,084.1 | 8,257.9 | 8,634.4 | 9,015.0 | 9,545.2 | 5.9 | 21.7 |
| R-S | Arts, entertainment, recreation and other service activities | 1,141.0 | 1,238.6 | 1,345.3 | 1,333.2 | 1,427.6 | 1,434.2 | 0.5 | 25.7 |
| Total | 57,308.2 | 60,004.9 | 62,830.1 | 66,586.5 | 71,516.7 | 76,456.3 | 6.9 | 33.4 | |
| Table 3 Total annual other labour costs by economic sector | |||||||||
| NACE Principal Activity | 2014 | 2015 | 2016 | 2017 | 2018 | 2019 | Annual change (2018-2019) | Five year change (2014-2019) | |
| €/M | €/M | €/M | €/M | €/M | €/M | % | % | ||
| B-E | Industry | 1,920.3 | 2,005.0 | 2,180.3 | 2,210.2 | 2,234.6 | 2,474.1 | 10.7 | 28.8 |
| F | Construction | 326.1 | 351.8 | 420.4 | 450.3 | 534.4 | 569.7 | 6.6 | 74.7 |
| G | Wholesale and retail trade; repair of motor vehicles and motorcycles | 1,219.4 | 1,288.4 | 1,354.8 | 1,485.7 | 1,500.6 | 1,529.9 | 1.9 | 25.5 |
| H | Transportation and storage | 426.9 | 444.5 | 450.8 | 466.0 | 540.8 | 595.0 | 10.0 | 39.4 |
| I | Accommodation and food services | 258.3 | 268.8 | 287.1 | 325.2 | 356.1 | 376.1 | 5.6 | 45.6 |
| J | Information and communication | 697.7 | 815.2 | 870.2 | 948.9 | 1,014.3 | 1,071.7 | 5.7 | 53.6 |
| K-L | Financial, insurance and real estate | 1,204.8 | 1,199.7 | 1,247.0 | 1,321.7 | 1,362.4 | 1,521.8 | 11.7 | 26.3 |
| M | Professional, scientific and technical | 532.0 | 585.4 | 665.3 | 698.5 | 705.4 | 778.9 | 10.4 | 46.4 |
| N | Administrative and support services | 282.0 | 302.6 | 313.6 | 372.8 | 432.5 | 532.3 | 23.1 | 88.7 |
| O | Public administration and defence | 434.5 | 464.2 | 457.8 | 502.8 | 572.8 | 648.0 | 13.1 | 49.2 |
| P | Education | 581.9 | 595.4 | 627.5 | 679.2 | 741.3 | 807.0 | 8.9 | 38.7 |
| Q | Human health and social work | 840.0 | 889.3 | 908.7 | 959.3 | 1,005.3 | 1,089.7 | 8.4 | 29.7 |
| R-S | Arts, entertainment, recreation and other service activities | 178.0 | 195.3 | 221.0 | 202.6 | 200.4 | 207.6 | 3.6 | 16.6 |
| Total | 8,901.9 | 9,405.7 | 10,004.4 | 10,623.1 | 11,201.1 | 12,201.8 | 8.9 | 37.1 | |
| Table 4 Total annual labour costs by economic sector | |||||||||
| NACE Principal Activity | 2014 | 2015 | 2016 | 2017 | 2018 | 2019 | Annual change (2018-2019) | Five year change (2014-2019) | |
| €/M | €/M | €/M | €/M | €/M | €/M | % | % | ||
| B-E | Industry | 10,778.7 | 11,317.6 | 11,908.5 | 12,422.2 | 12,699.7 | 13,379.1 | 5.3 | 24.1 |
| F | Construction | 2,843.7 | 3,170.0 | 3,728.2 | 4,067.1 | 4,821.9 | 5,133.1 | 6.5 | 80.5 |
| G | Wholesale and retail trade; repair of motor vehicles and motorcycles | 8,968.3 | 9,418.2 | 9,851.5 | 10,425.4 | 10,595.3 | 10,941.4 | 3.3 | 22.0 |
| H | Transportation and storage | 2,836.8 | 2,996.2 | 3,155.3 | 3,278.7 | 3,760.2 | 4,210.7 | 12.0 | 48.4 |
| I | Accommodation and food services | 2,707.4 | 2,781.6 | 3,024.5 | 3,362.8 | 3,678.3 | 3,851.6 | 4.7 | 42.3 |
| J | Information and communication | 3,882.9 | 4,296.7 | 4,548.1 | 4,928.7 | 5,477.0 | 6,009.3 | 9.7 | 54.8 |
| K-L | Financial, insurance and real estate | 5,987.2 | 5,988.6 | 6,356.8 | 6,480.6 | 6,697.9 | 7,382.2 | 10.2 | 23.3 |
| M | Professional, scientific and technical | 3,952.9 | 4,248.7 | 4,715.6 | 4,903.1 | 5,223.7 | 5,545.9 | 6.2 | 40.3 |
| N | Administrative and support services | 2,246.0 | 2,444.3 | 2,563.4 | 2,922.0 | 3,497.0 | 4,010.4 | 14.7 | 78.6 |
| O | Public administration and defence | 5,718.8 | 5,993.4 | 5,775.5 | 6,248.9 | 6,876.5 | 7,537.9 | 9.6 | 31.8 |
| P | Education | 6,287.9 | 6,348.0 | 6,474.3 | 7,040.7 | 7,742.1 | 8,379.9 | 8.2 | 33.3 |
| Q | Human health and social work | 8,680.6 | 8,973.4 | 9,166.6 | 9,593.7 | 10,020.2 | 10,634.9 | 6.1 | 22.5 |
| R-S | Arts, entertainment, recreation and other service activities | 1,319.0 | 1,433.9 | 1,566.3 | 1,535.8 | 1,627.9 | 1,641.8 | 0.8 | 24.5 |
| Total | 66,210.1 | 69,410.6 | 72,834.6 | 77,209.6 | 82,717.7 | 88,658.1 | 7.2 | 33.9 | |
| Table 5 Average annual earnings by economic sector¹ | |||||||||
| NACE Principal Activity | 2014 | 2015 | 2016 | 2017 | 2018 | 2019 | Annual change (2018-2019) | Five year change (2014-2019) | |
| € | € | € | € | € | € | % | % | ||
| B-E | Industry | 44,092 | 43,991 | 44,558 | 45,211 | 46,399 | 47,104 | 1.5 | 6.8 |
| F | Construction | 37,811 | 37,031 | 38,271 | 38,391 | 40,561 | 41,686 | 2.8 | 10.2 |
| G | Wholesale and retail trade; repair of motor vehicles and motorcycles | 27,282 | 28,006 | 28,733 | 29,316 | 29,891 | 31,002 | 3.7 | 13.6 |
| H | Transportation and storage | 38,072 | 38,923 | 39,426 | 40,212 | 42,148 | 43,127 | 2.3 | 13.3 |
| I | Accommodation and food services | 16,479 | 16,605 | 17,198 | 17,608 | 18,262 | 19,153 | 4.9 | 16.2 |
| J | Information and communication | 53,432 | 55,966 | 55,910 | 56,758 | 61,269 | 64,345 | 5.0 | 20.4 |
| K-L | Financial, insurance and real estate | 53,612 | 53,036 | 54,763 | 55,687 | 58,578 | 60,409 | 3.1 | 12.7 |
| M | Professional, scientific and technical | 41,139 | 41,955 | 44,631 | 46,277 | 47,631 | 49,256 | 3.4 | 19.7 |
| N | Administrative and support services | 25,823 | 26,929 | 27,097 | 28,490 | 29,623 | 32,071 | 8.3 | 24.2 |
| O | Public administration and defence | 47,861 | 48,173 | 47,329 | 48,907 | 49,724 | 50,376 | 1.3 | 5.3 |
| P | Education | 41,303 | 41,941 | 41,643 | 42,673 | 44,053 | 44,745 | 1.6 | 8.3 |
| Q | Human health and social work | 35,015 | 35,251 | 35,505 | 36,313 | 37,277 | 38,390 | 3.0 | 9.6 |
| R-S | Arts, entertainment, recreation and other service activities | 24,642 | 24,619 | 24,587 | 24,566 | 25,378 | 26,318 | 3.7 | 6.8 |
| Total | 36,037 | 36,457 | 36,933 | 37,637 | 38,871 | 40,283 | 3.6 | 11.8 | |
| Full-time/Part-time Employees | |||||||||
| Full-time employees | 44,829 | 45,061 | 45,640 | 46,399 | 47,596 | 48,946 | 2.8 | 9.2 | |
| Part-time employees | 15,942 | 16,240 | 16,535 | 17,055 | 17,651 | 18,305 | 3.7 | 14.8 | |
| ¹ Average annual earnings are inclusive of overtime and irregular earnings. | |||||||||
| Table 6 Average annual other labour costs by economic sector¹ | |||||||||
| NACE Principal Activity | 2014 | 2015 | 2016 | 2017 | 2018 | 2019 | Annual change (2018-2019) | Five year change (2014-2019) | |
| € | € | € | € | € | € | % | % | ||
| B-E | Industry | 9,558 | 9,471 | 9,986 | 9,785 | 9,908 | 10,687 | 7.9 | 11.8 |
| F | Construction | 4,897 | 4,623 | 4,864 | 4,780 | 5,055 | 5,204 | 2.9 | 6.3 |
| G | Wholesale and retail trade; repair of motor vehicles and motorcycles | 4,293 | 4,438 | 4,581 | 4,872 | 4,932 | 5,039 | 2.2 | 17.4 |
| H | Transportation and storage | 6,744 | 6,780 | 6,572 | 6,662 | 7,080 | 7,098 | 0.2 | 5.2 |
| I | Accommodation and food services | 1,738 | 1,776 | 1,803 | 1,885 | 1,957 | 2,073 | 5.9 | 19.2 |
| J | Information and communication | 11,704 | 13,105 | 13,229 | 13,532 | 13,926 | 13,966 | 0.3 | 19.3 |
| K-L | Financial, insurance and real estate | 13,507 | 13,286 | 13,364 | 14,267 | 14,959 | 15,687 | 4.9 | 16.1 |
| M | Professional, scientific and technical | 6,397 | 6,705 | 7,331 | 7,688 | 7,437 | 8,048 | 8.2 | 25.8 |
| N | Administrative and support services | 3,708 | 3,805 | 3,777 | 4,167 | 4,181 | 4,908 | 17.4 | 32.4 |
| O | Public administration and defence | 3,935 | 4,045 | 4,074 | 4,279 | 4,519 | 4,738 | 4.9 | 20.4 |
| P | Education | 4,212 | 4,341 | 4,469 | 4,556 | 4,665 | 4,768 | 2.2 | 13.2 |
| Q | Human health and social work | 3,752 | 3,878 | 3,907 | 4,034 | 4,157 | 4,383 | 5.4 | 16.8 |
| R-S | Arts, entertainment, recreation and other service activities | 3,844 | 3,882 | 4,038 | 3,733 | 3,562 | 3,810 | 6.9 | -0.9 |
| Total | 5,598 | 5,715 | 5,881 | 6,004 | 6,088 | 6,429 | 5.6 | 14.8 | |
| ¹ Other labour costs include statutory employers' PRSI, other social costs, benefits in kind, etc. | |||||||||
| Table 7 Average annual total labour costs by economic sector | |||||||||
| NACE Principal Activity | 2014 | 2015 | 2016 | 2017 | 2018 | 2019 | Annual change (2018-2019) | Five year change (2014-2019) | |
| € | € | € | € | € | € | % | % | ||
| B-E | Industry | 53,651 | 53,462 | 54,544 | 54,996 | 56,306 | 57,790 | 2.6 | 7.7 |
| F | Construction | 42,708 | 41,654 | 43,135 | 43,170 | 45,616 | 46,891 | 2.8 | 9.8 |
| G | Wholesale and retail trade; repair of motor vehicles and motorcycles | 31,576 | 32,445 | 33,314 | 34,188 | 34,823 | 36,042 | 3.5 | 14.1 |
| H | Transportation and storage | 44,816 | 45,703 | 45,998 | 46,873 | 49,229 | 50,225 | 2.0 | 12.1 |
| I | Accommodation and food services | 18,217 | 18,382 | 19,001 | 19,493 | 20,219 | 21,226 | 5.0 | 16.5 |
| J | Information and communication | 65,136 | 69,071 | 69,139 | 70,290 | 75,196 | 78,311 | 4.1 | 20.2 |
| K-L | Financial, insurance and real estate | 67,119 | 66,323 | 68,128 | 69,954 | 73,537 | 76,096 | 3.5 | 13.4 |
| M | Professional, scientific and technical | 47,536 | 48,660 | 51,961 | 53,965 | 55,068 | 57,304 | 4.1 | 20.5 |
| N | Administrative and support services | 29,531 | 30,734 | 30,874 | 32,657 | 33,805 | 36,979 | 9.4 | 25.2 |
| O | Public administration and defence | 51,796 | 52,217 | 51,403 | 53,186 | 54,242 | 55,114 | 1.6 | 6.4 |
| P | Education | 45,515 | 46,282 | 46,112 | 47,229 | 48,718 | 49,513 | 1.6 | 8.8 |
| Q | Human health and social work | 38,766 | 39,128 | 39,412 | 40,347 | 41,434 | 42,773 | 3.2 | 10.3 |
| R-S | Arts, entertainment, recreation and other service activities | 28,487 | 28,501 | 28,626 | 28,299 | 28,941 | 30,128 | 4.1 | 5.8 |
| Total | 41,635 | 42,172 | 42,814 | 43,641 | 44,959 | 46,712 | 3.9 | 12.2 | |
| Table 8 Average annual hourly earnings by economic sector¹ | |||||||||
| NACE Principal Activity | 2014 | 2015 | 2016 | 2017 | 2018 | 2019 | Annual change (2018-2019) | Five year change (2014-2019) | |
| € | € | € | € | € | € | % | % | ||
| B-E | Industry | 22.27 | 22.06 | 22.30 | 22.73 | 23.22 | 23.68 | 2.0 | 6.3 |
| F | Construction | 19.54 | 19.54 | 19.85 | 20.13 | 20.94 | 21.69 | 3.6 | 11.0 |
| G | Wholesale and retail trade; repair of motor vehicles and motorcycles | 17.18 | 17.47 | 17.84 | 18.16 | 18.53 | 19.49 | 5.2 | 13.4 |
| H | Transportation and storage | 20.66 | 20.36 | 21.01 | 21.26 | 22.45 | 23.34 | 4.0 | 13.0 |
| I | Accommodation and food services | 12.18 | 12.23 | 12.47 | 12.70 | 13.03 | 13.42 | 3.0 | 10.1 |
| J | Information and communication | 28.32 | 29.66 | 29.72 | 30.12 | 32.29 | 33.35 | 3.3 | 17.8 |
| K-L | Financial, insurance and real estate | 29.71 | 29.40 | 29.81 | 30.84 | 32.19 | 33.29 | 3.4 | 12.0 |
| M | Professional, scientific and technical | 24.39 | 24.63 | 25.40 | 26.32 | 27.04 | 27.71 | 2.5 | 13.6 |
| N | Administrative and support services | 16.53 | 17.01 | 17.32 | 17.56 | 18.13 | 18.99 | 4.7 | 14.8 |
| O | Public administration and defence | 25.52 | 25.54 | 25.23 | 25.66 | 25.99 | 26.22 | 0.9 | 2.7 |
| P | Education | 33.98 | 34.15 | 33.84 | 34.56 | 35.82 | 36.51 | 1.9 | 7.4 |
| Q | Human health and social work | 22.27 | 22.04 | 22.13 | 22.50 | 22.84 | 23.51 | 3.0 | 5.6 |
| R-S | Arts, entertainment, recreation and other service activities | 16.81 | 17.10 | 16.85 | 16.71 | 17.22 | 18.15 | 5.4 | 7.9 |
| Total | 21.85 | 21.89 | 22.06 | 22.43 | 23.07 | 23.88 | 3.5 | 9.3 | |
| ¹ Earnings are inclusive of overtime and irregular earnings. | |||||||||
| Table 9 Average annual weekly paid hours by economic sector | |||||||||
| NACE Principal Activity | 2014 | 2015 | 2016 | 2017 | 2018 | 2019 | Annual change (2018-2019) | Five year change (2014-2019) | |
| Hours | Hours | Hours | Hours | Hours | Hours | % | % | ||
| B-E | Industry | 38.1 | 38.3 | 38.4 | 38.3 | 38.4 | 38.3 | -0.4 | 0.5 |
| F | Construction | 37.2 | 36.4 | 37.1 | 36.7 | 37.2 | 37.0 | -0.8 | -0.7 |
| G | Wholesale and retail trade; repair of motor vehicles and motorcycles | 30.5 | 30.8 | 31.0 | 31.1 | 31.0 | 30.6 | -1.4 | 0.2 |
| H | Transportation and storage | 35.4 | 36.8 | 36.1 | 36.4 | 36.1 | 35.5 | -1.6 | 0.2 |
| I | Accommodation and food services | 26.0 | 26.1 | 26.5 | 26.7 | 27.0 | 27.5 | 1.9 | 5.5 |
| J | Information and communication | 36.3 | 36.3 | 36.2 | 36.2 | 36.5 | 37.1 | 1.7 | 2.2 |
| K-L | Financial, insurance and real estate | 34.7 | 34.7 | 35.3 | 34.7 | 35.0 | 34.9 | -0.3 | 0.6 |
| M | Professional, scientific and technical | 32.4 | 32.8 | 33.8 | 33.8 | 33.9 | 34.2 | 0.9 | 5.4 |
| N | Administrative and support services | 30.0 | 30.4 | 30.1 | 31.2 | 31.4 | 32.5 | 3.4 | 8.1 |
| O | Public administration and defence | 36.1 | 36.3 | 36.1 | 36.7 | 36.8 | 36.9 | 0.4 | 2.5 |
| P | Education | 23.4 | 23.6 | 23.7 | 23.7 | 23.7 | 23.6 | -0.3 | 0.8 |
| Q | Human health and social work | 30.2 | 30.8 | 30.9 | 31.0 | 31.4 | 31.4 | - | 3.8 |
| R-S | Arts, entertainment, recreation and other service activities | 28.2 | 27.7 | 28.1 | 28.3 | 28.3 | 27.9 | -1.6 | -1.0 |
| Total | 31.7 | 32.0 | 32.2 | 32.3 | 32.4 | 32.4 | 0.1 | 2.3 | |
| Table 10 Average annual other labour costs components | ||||||||
| Other Labour Costs Components | 2014 | 2015 | 2016 | 2017 | 2018 | 2019 | Annual change (2018-2019) | Five year change (2014-2019) |
| € | € | € | € | € | € | % | % | |
| Statutory Social Contributions | 3,333 | 3,402 | 3,478 | 3,560 | 3,711 | 3,888 | 4.7 | 16.6 |
| Non Statutory Social Contributions | 1,694 | 1,680 | 1,746 | 1,752 | 1,664 | 1,803 | 8.4 | 6.5 |
| Other Expenses | 310 | 314 | 319 | 325 | 335 | 348 | 3.9 | 12.2 |
| Benefits in Kind | 327 | 369 | 393 | 418 | 442 | 451 | 2.1 | 38.0 |
| Average Other Labour Costs1 | 5,598 | 5,715 | 5,881 | 6,004 | 6,088 | 6,429 | 5.6 | 14.8 |
| 1Average Other Labour Costs differ from the sum of the components presented due to the inclusion of subsidy and refunds in the Other Labour Costs figure. | ||||||||
| Table 11 Wage bill components, all employees, full-time employees and part-time employees | |||||||||
| Wage Bill Components | 2014 | 2015 | 2016 | 2017 | 2018 | 2019 | Annual change (2018-2019) | Five year change (2014-2019) | |
| All Employees | % | % | |||||||
| Total earnings | €/M | 57,308.2 | 60,004.9 | 62,830.1 | 66,586.5 | 71,516.7 | 76,456.3 | 6.9 | 33.4 |
| Average employment | '000 | 1,590.2 | 1,645.9 | 1,701.2 | 1,769.2 | 1,839.8 | 1,898.0 | 3.2 | 19.4 |
| Average hourly earnings | € | 21.85 | 21.89 | 22.06 | 22.43 | 23.07 | 23.88 | 3.5 | 9.3 |
| Average weekly paid hours | Hours | 31.7 | 32.0 | 32.2 | 32.3 | 32.4 | 32.4 | 0.1 | 2.3 |
| Full-time Employees | |||||||||
| Total earnings | €/M | 49,445.3 | 51,857.3 | 54,255.4 | 57,405.0 | 61,890.1 | 66,458.9 | 7.4 | 34.4 |
| Average employment | '000 | 1,103.0 | 1,150.8 | 1,188.8 | 1,237.2 | 1,300.3 | 1,357.8 | 4.4 | 23.1 |
| Average hourly earnings | € | 23.43 | 23.50 | 23.68 | 24.14 | 24.76 | 25.61 | 3.4 | 9.3 |
| Average weekly paid hours | Hours | 36.8 | 36.9 | 37.1 | 37.0 | 37.0 | 36.8 | -0.6 | -0.1 |
| Part-time Employees | |||||||||
| Total earnings | €/M | 7,487.0 | 7,725.2 | 8,149.6 | 8,734.4 | 9,170.1 | 9,497.4 | 3.6 | 26.9 |
| Average employment | '000 | 469.6 | 475.7 | 492.9 | 512.1 | 519.5 | 518.8 | -0.1 | 10.5 |
| Average hourly earnings | € | 15.49 | 15.41 | 15.56 | 15.72 | 16.18 | 16.66 | 3.0 | 7.6 |
| Average weekly paid hours | Hours | 19.8 | 20.3 | 20.4 | 20.9 | 21.0 | 21.1 | 0.7 | 6.7 |
| Table 12 Registered annual employment by economic sector1,2 | |||||||||
| NACE Principal Activity | 2014 | 2015 | 2016 | 2017 | 2018 | 2019 | Annual change (2018-2019) | Five year change (2014-2019) | |
| % | % | ||||||||
| B-E | Industry | 197,900 | 209,200 | 218,800 | 226,500 | 225,300 | 232,300 | 3.1 | 17.4 |
| F | Construction | 64,600 | 75,900 | 86,600 | 93,800 | 105,100 | 110,700 | 5.3 | 71.3 |
| G | Wholesale and retail trade; repair of motor vehicles and motorcycles | 281,200 | 286,300 | 295,800 | 304,600 | 303,000 | 304,100 | 0.4 | 8.1 |
| H | Transportation and storage | 62,000 | 64,700 | 68,700 | 70,100 | 76,100 | 83,600 | 9.8 | 34.8 |
| I | Accommodation and food services | 145,500 | 149,200 | 157,900 | 169,700 | 180,700 | 182,400 | 0.9 | 25.4 |
| J | Information and communication | 59,500 | 62,400 | 65,900 | 70,000 | 72,300 | 76,900 | 6.5 | 29.3 |
| K-L | Financial, insurance and real estate | 89,200 | 89,900 | 93,400 | 92,500 | 90,700 | 97,300 | 7.3 | 9.0 |
| M | Professional, scientific and technical | 83,400 | 87,000 | 91,100 | 91,500 | 94,600 | 97,000 | 2.5 | 16.2 |
| N | Administrative and support services | 76,900 | 80,200 | 83,000 | 90,400 | 102,500 | 107,800 | 5.2 | 40.2 |
| O | Public administration and defence | 107,400 | 111,800 | 112,700 | 117,800 | 127,200 | 137,400 | 8.0 | 27.9 |
| P | Education | 135,500 | 137,400 | 139,800 | 147,600 | 157,700 | 169,300 | 7.4 | 25.0 |
| Q | Human health and social work | 223,500 | 229,400 | 233,100 | 238,600 | 241,700 | 250,000 | 3.4 | 11.9 |
| R-S | Arts, entertainment, recreation and other service activities | 46,200 | 50,100 | 53,400 | 54,100 | 56,000 | 54,500 | -2.7 | 17.9 |
| Total | 1,573,000 | 1,633,300 | 1,700,000 | 1,767,200 | 1,832,900 | 1,903,500 | 3.9 | 21.0 | |
| ¹ It should be noted that the Labour Force Survey (LFS) is the official source of estimates of employment. https://www.cso.ie/en/statistics/labourmarket/labourforcesurvey/ | |||||||||
| 2 Percentage change figures presented are calculated based upon unrounded data and thus may differ slightly to those calculated upon the rounded data presented in the table. | |||||||||
Introduction
The Earnings, Hours and Employment Costs Survey (EHECS) replaced the four-yearly Labour Costs Survey, and also replaced all other CSO short-term earnings inquiries. The EHECS results are comparable across sectors and include more detail on components of earnings and labour costs than was previously available.
Legislation
The survey information was collected by the Central Statistics Office (CSO) under the S.I. No 140 of 2013 Statistics (Labour Costs Surveys) Order 2013. The information collected is treated as strictly confidential in accordance with the Statistics Act 1993. The survey results meet the requirements for Labour Costs statistics set out in Council Regulation (EC) 530/1999.
Business Register
The CSO’s Business Register provides the register of relevant enterprises for the survey. An enterprise is defined as the smallest legally independent unit.
Business Classification
The business classification used for the EHECS is based on the Statistical Classification of Economic Activities in the European Community (NACE Rev.2). The NACE code of each enterprise included in the survey was determined from the predominant activity of the enterprise, based on information provided in this or other CSO inquiries.
Nace Classification
NACE Rev.2 is the latest classification system for economic activities, updated from NACE Rev 1.1. A major revision of NACE was conducted between 2000 and 2007, in order to ensure that the NACE classification system remained relevant for the economy. The main changes that affected the release was the reclassification of some industrial enterprises from industry to services (principally in the software and publishing sectors) and the inclusion of air conditioning supply, sewerage, water management and remediation activities in industry.
Coverage
The survey results relate to enterprises in the NACE Rev.2 Sections B-E (Industry), F (Construction), G (Wholesale & retail trade: repair of motor vehicles & motorcycles), H (Transportation & storage), I (Accommodation & food services activities), J (Information & communication), K-L (Financial, insurance & real estate activities), M (Professional, scientific & technical activities), N (Administrative & support services activities), O (Public administration & defence), P (Education), Q (Human health & social work activities) and R-S (Arts, entertainment, recreation & other service activities) with 3 or more employees. The data was collected at enterprise level.
NACE Rev.2 Sections A (Agriculture, forestry and fishing), T (Activities of households as employers) and U (Activities of extraterritorial organisations and bodies) are not covered in the survey as most employment in these sectors is not enterprise based.
All enterprises with 50 or more employees and a sample of those with 3 to 49 employees are surveyed each quarter. The sample is based on the proportion of companies in each NACE 2 digit economic sectors in the 3 to 49 size classes (3 to 9, 10 to 19 and 20 to 49).
Earnings in the public sector are calculated before the deduction of the pension levy that was introduced in March 2009. For Q1 and Q2 2011 and Q1 2016 temporary census field staff are included in all calculations due to the large numbers involved.
Data Collection
The survey is conducted by post and questionnaires are issued in the last week of each quarter. Some returns are received electronically. All returns are scrutinised for accuracy. Where appropriate, firms are queried by post or telephone regarding incompleteness, apparent inconsistencies, etc. Information about the survey is on the CSO website and all questionnaires and instructions are available electronically there.
Definitions
Registered Employment:
Registered employment refers to the employment of respondent enterprises at the end of the reference quarter. For non-respondent enterprises and enterprises not in the sample, registered employment refers to the employment from the Business Register. The Business Register base enterprise employment on data from the latest revenue P35 files. The Business Register has a lag of between 12 and 18 months between the current quarter and the latest revenue P35 file. For this reason the Business Register is not a suitable measure of short term trends in employment. Thus, sectoral registered employment is adjusted to reflect the trends of the Labour Force Survey (LFS) sectoral employment. The LFS is designed to measure short term changes in employment.
Average Employment
For respondent enterprises average employment refers to the average of the quarters opening employment and closing employment. This variable is used as the denominator in calculating average earnings per person and average paid hours per person.
All Employees
All persons who have a direct employment contract with an enterprise as employees, who receive wages or salaries. Persons not working for salary e.g. family members, directors, partners, outside pieceworker’s etc., are not considered employees but other persons engaged. These workers are included separately but not used in the calculation of derived variables. All employment figures are rounded to the nearest hundred.
Full-time Employees
Employees whose regular working hours are the same as the collectively agreed or customary hours worked in the enterprise, irrespective of the duration of the employment contract. Full-time employment often comes with benefits that are not typically offered to part-time, temporary, or flexible workers, such as annual leave, sick leave, and health insurance.
Part-time Employees
Employees whose regular working hours are less than the collectively agreed or customary hours worked in the enterprise. The definition of part-time varies from enterprise to enterprise but in general part-time employees work 80% or less of the regular hours of the enterprise.
Apprentices/Trainees
All persons, both full-time or part-time, whose wages or salaries are governed by the fact that they work either under an apprenticeship contract or as part of a training program.
Wages and Salaries
All wages and salaries payments are gross (i.e. before deduction of income tax and employees' PRSI contributions and levies such as the public sector pension levy). In the analysis, the total wages and salaries are divided into:
- Regular earnings: payments made regularly at each pay period during the year, excluding all irregular and overtime earnings.
- Overtime earnings: payment for hours worked in excess of normal hours.
- Total earnings excluding irregular earnings: regular earnings + overtime earnings.
- Irregular earnings: bonuses which are not paid regularly at each pay period. For example: end of quarter or year productivity bonus.
- Apprentice/Trainees earnings: total of apprentices & trainees' regular wages and salaries, overtime and irregular bonuses and allowances.
- Total earnings: total of regular earnings, overtime earnings and irregular earnings.
Other Labour Costs
Other labour costs are costs to the employer, in addition to wages and salaries, of employing labour. They include the below categories:
- Statutory social contributions: statutory employers’ PRSI including the social security contributions for apprentices/trainees.
- Non-statutory social contributions: payments made by enterprises on behalf of their employees which include pension fund contributions, life assurance premiums, income continuance insurance, redundancy payments as well as other employee related payments.
- Other expenses: other employee related payments e.g. study grants, etc.
– Benefits in kind (BIK); net cost of all goods and services made available to employees by the employer. For example, payments for private use of company cars, stock options & share purchase schemes, voluntary sickness insurance, staff housing and other free or subsidised benefits (e.g. canteen facilities, childcare provision, health costs). BIK is included as earnings by Eurostat for the Labour Costs Survey and the Labour Costs Index.
- Subsidies and refunds: amounts received by enterprises intended to refund part or all of the cost of wages and salaries and training costs. These may include training subsidies from SOLAS or Job Bridge as well as refunds from the Department of Social Protection (DSP) for sick and maternity leave. These are deducted from the firms’ labour costs in the analysis.
Paid Hours
- Regular paid hours: These are normal working hours of employees, usually specified in the contract of employment and should include paid leave e.g. paid sick leave and annual leave.
- Overtime paid hours: Hours worked in excess of contracted hours.
- Total paid hours: Sum of regular paid hours and overtime paid hours.
Derived Variables
Total annual earnings
- Total annual regular earnings: The sum of regular earnings in all enterprises in the year.
- Total annual overtime earnings: The sum of overtime earnings in all enterprises in the year.
- Total annual earnings excluding irregular earnings: The sum of regular earnings and overtime earnings in all enterprises in the year.
- Total annual irregular earnings: The sum of irregular earnings in all enterprises in the year.
- Total annual total earnings: The sum of regular earnings, overtime earnings and irregular earnings in all enterprises in the year.
Total annual other labour costs
The sum of other labour costs which includes statutory and non-statutory employers contributions to social security, redundancy payments, training and other costs and benefits in kind in all enterprises in the year. Subsidies and refunds are deducted.
Total annual labour costs
The sum of total annual earnings and total annual other labour costs.
Average annual earnings
- Average annual regular earnings: Total annual regular earnings divided by average employment.
- Average annual overtime earnings: Total annual overtime earnings divided by average employment.
- Average annual earnings excluding irregular earnings: Total annual earnings excluding irregular earnings divided by average employment.
- Average annual irregular earnings: Total annual irregular earnings divided by average employment.
- Average annual total earnings: Total annual total earnings divided by average employment.
Average annual other labour costs
- Average annual other labour costs divided by average annual employment.
Average annual total labour costs
- Average annual total labour costs divided by average annual employment.
Average hourly regular earnings
- Average hourly regular earnings: Total annual regular earnings divided by total annual paid hours.
- Average hourly overtime earnings: Total annual overtime earnings divided by total annual paid hours.
- Average hourly earnings excluding irregular earnings: Total annual earnings excluding irregular earnings divided by total annual paid hours.
- Average hourly irregular earnings: Total annual irregular earnings divided by total annual paid hours.
- Average hourly total earnings: Total annual total earnings divided by total annual paid hours.
Average weekly paid hours
- Average regular weekly paid hours: Regular paid hours for the year divided by the average employment divided by 52 (Number of weeks in year).
- Average overtime weekly paid hours: Overtime paid hours for the year divided by the average employment divided by 52 (Number of weeks in year).
- Average total weekly paid hours: Total paid hours for the year divided by the average employment divided by 52 (Number of weeks in year).
Unpaid hours including unpaid overtime and unpaid leave are excluded.
Methodology for production of annual results
Quarterly EHECS Dataset
All enterprises with 50 or more employees are surveyed quarterly as well as a sample of enterprises which have between 3 and 49 employees inclusive. For enterprises with 3 to 49 employees inclusive, a weighting factor (the reciprocal of the sampling fraction) is used to weight the estimates to the total population for both employees and enterprises. The CSO's Business Register forms the basis of the sampling frame used for weighting the sample data to the population. Decay factors are calculated for each size class and sector to adjust the non-sampled element of the register for the respondent non-relevant enterprises.
Imputation is carried out for non-respondents in the greater than 50 employees’ categories. Where an enterprise responded in the previous quarter ratio-imputation is used to estimate figures for the current quarter. For enterprises that did not respond in the previous four quarter a stratum average imputation method is used to estimate the missing variables. These estimates are based on respondent enterprises of a similar size and activity.
After imputation, all enterprises with 50 or more employees are accounted for and included in the final dataset. All enterprises employing between 3 and 49 employees are allocated a grossing factor to represent the entire population for their relevant industry sector and size class in the quarter. All enterprises' data are contained in the final quarterly dataset which is tabulated to produce the aggregates which are published in the Earnings and Labour Costs quarterly release.
Annual EHECS Dataset
The four quarterly datasets are merged to create an annual dataset. This annual dataset is summarised, using the weighting factor, to produce aggregates which are published in the Earnings and Labour Costs Annual release.
Interpretation of results
The series presented in this release and all estimates deriving from the EHECS survey are primarily of use as an indicator of trends in average earnings across different classifications. However, in interpreting the trends and in undertaking direct comparison of the average level of earnings across sectors, some caution in interpretation is warranted. For example, the results presented here are based on raw earnings levels. To get a true picture of differences in earnings levels of different employees, comparisons should take account of differences in the characteristics of employees, such as length of service, educational attainment level, nature of work, etc., none of which are available via EHECS. The additional information available from the Earnings Analysis using Administrative Data Sources (EAADS) and the National Employment Survey (NES) allows for a more detailed analysis of differences in earnings levels and should be referred to by users seeking more detailed information on earnings determinants than is available from EHECS.
Calculation of percentage rates of change
Percentage rates of change presented in this release may differ from the percentage rates of change calculated from the rounded values presented in the tables.
Earnings and Labour Costs Revisions implemented in June 2018 and June 2019
Earnings and Labour Costs data have been revised from 2008 to 2017. These revisions are reflected in both the Earnings and Labour Costs Annual 2017 and 2018 releases and related StatBank tables. These revisions arise as a result of the introduction of the new Labour Force Survey, new population estimates as a result of the 2016 Census of Population, changes in the composition of the NUTS regions in the Labour Force Survey and other minor updates to EHECS aggregation processes. The revisions primarily change the number of employees in NACE sectors over the period and thus mainly affect the total annual earnings and labour costs statistics. The revisions have minor impact on average earnings and labour costs statistics and do not change previously published trends in these averages.
The Labour Force Survey is the official source of employment data in Ireland. The new Labour Force Survey published revised employment estimates in January 2018. These updated sectoral employment trends provide the basis for the Earnings and Labour Costs Annual release to revise earnings, hours, employment and labour cost statistics.
 Hide Background Notes
Scan the QR code below to view this release online or go to
http://www.cso.ie/en/releasesandpublications/er/elca/earningsandlabourcostsannualdata2019/
 Show Table 1 Total labour costs components
 Hide Table 1 Total labour costs components