
| Table A: Environment Taxes by Type | |||||
| €m | |||||
| Type | 2015 | 2016 | 2017 | 2018 | 2019 |
| Energy | 3,043 | 3,135 | 3,258 | 3,176 | 3,016 |
| Transport | 1,887 | 1,924 | 1,929 | 1,917 | 1,977 |
| Pollution and Resource | 47 | 58 | 46 | 26 | 20 |
| Total | 4,977 | 5,117 | 5,232 | 5,119 | 5,013 |
| Annual % change | 6.3% | 2.8% | 2.2% | -2.2% | -2.1% |
| % of total taxes | 8.4% | 8.2% | 7.9% | 7.2% | 6.5% |
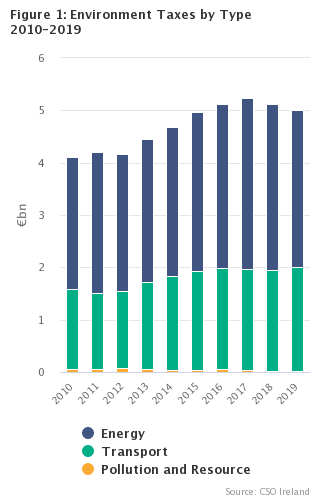
€5.0 billion of environment related taxes were collected in 2019, a drop of 2.1% on 2018. This is the second successive year where environment related taxes have decreased. The main reason for this fall in taxes paid relates to a decrease in the Public Service Obligation levy, mainly associated with an increased negative R-factor, a higher benchmark price and the expiry of the Peat PSO Scheme during 2019. Meanwhile, energy taxes (mainly taxes on transport fuels) accounted for 60% of total environment taxes in 2019 with another 39% coming from Transport taxes (including motor tax and vehicle registration tax).
|
An environment tax is defined by Regulation (EU) 691/2011 as: "A tax whose tax base is a physical unit (or a proxy of a physical unit) of something that has a proven, specific negative impact on the environment, and which is identified in the European System of Accounts as a tax." |
Figure 1 shows that environment taxes were €4.1 billion in 2010 and rose to €5.2 billion in 2017, before falling to €5.0 billion in 2019. As a percentage of total taxes, environment taxes were 9.2% in 2010. Environment taxes as a percentage of total taxes paid has been falling steadily since 2010, with environment taxes accounting for 6.5% of total taxes in 2019.
Energy taxes in 2010 were €2.5 billion, in 2019 they were €3.0 billion. Energy taxes as a percentage of total environment taxes was 60% in 2019 with the combined Carbon tax, Carbon Credits and the PSO levy accounting for 23.7% of energy taxes in 2019. Carbon credits, that is energy taxes accruing on foot of permits surrendered under the Emissions Trading Scheme, came to €79 million in 2019. In certain earlier years permits were issued by Government without obligation, accordingly when surrendered, a deduction equal to the value of the permit is recorded as Environment taxes.
In 2010 transport taxes (mainly vehicle registration and motor taxes) were €1.5 billion with vehicle registration tax accounting for 26%. Transport taxes then fell to €1.4 billion in 2011. They have risen since then to €2.0 billion in 2019.
Pollution and resource taxes increased from €61 million in 2010 to €67 million in 2012 before falling back to €20 million in 2019. In 2019 the Plastic bag and Landfill levies were €6 million and €12 million respectively.
NACE Sector Analysis
Table 2 shows environment taxes by NACE Rev. 2 sector of Payee. In 2010 estimated environment taxes levied on households were €2.7 billion, representing a 66% share of total environment taxes. Household environment taxes rose to €3.1 billion in 2015. In 2019 household environment taxes have fallen back €2.6 billion and represented a 52% share of total environment taxes.
Environment taxes levied on service industries were €1.0 billion in 2010, representing a 23.3% share of total environment taxes. In 2019 environment taxes paid by service industries were €1.6 billion and represented a 32.1% share of total environment taxes.
Environment taxes levied on industry were €0.4 billion in 2010. In 2019 environment taxes levied on industry were €0.7 billion. In 2010 the percentage share of total environment taxes levied on industry was 10.0% while in 2019 it was 14.5%.
Environment taxes levied on agriculture were €0.04 billion in 2010, representing a 1.0% share of total environment taxes. In 2019 environment taxes levied on agriculture were €0.06 billion and represented a 1.3% share of total environment taxes.
| X-axis label | Agriculture | Industry | Services | Households |
|---|---|---|---|---|
| 2010 | 0.0408893473379812 | 0.412448842528014 | 0.958328010719961 | 2.69219249373001 |
| 2011 | 0.05945561101908 | 0.43299009025605 | 0.972187296460479 | 2.73947564626439 |
| 2012 | 0.0549082276456495 | 0.418479601448416 | 0.944583245481094 | 2.75547086742484 |
| 2013 | 0.0576717421418595 | 0.486454674926529 | 1.06581925428824 | 2.83492009423815 |
| 2014 | 0.0573657644479013 | 0.522801190424851 | 1.10893126598495 | 2.99481328706222 |
| 2015 | 0.0809004266974859 | 0.500285620779692 | 1.25179038214315 | 3.14426258435967 |
| 2016 | 0.0741182898823389 | 0.562493705277295 | 1.35493057140082 | 3.12594334710622 |
| 2017 | 0.0728604383075923 | 0.628557165010303 | 1.5196820977929 | 3.01126878055587 |
| 2018 | 0.0675701427161372 | 0.700441533374075 | 1.54446373797801 | 2.80682830726511 |
| 2019 | 0.0638377417318774 | 0.72481855583272 | 1.60741875877233 | 2.61726964427307 |
| Table 1 Environment Taxes by Tax type, 2010-2019 | ||||||||||
| €m | ||||||||||
| Tax | 2010 | 2011 | 2012 | 2013 | 2014 | 2015 | 2016 | 2017 | 2018 | 2019 1 |
| Total | 4,104 | 4,204 | 4,173 | 4,445 | 4,684 | 4,977 | 5,117 | 5,232 | 5,119 | 5,013 |
| Annual % change | 6.7% | 2.4% | -0.7% | 6.5% | 5.4% | 6.3% | 2.8% | 2.2% | -2.2% | -2.1% |
| % of total taxes | 9.2% | 9.1% | 8.7% | 8.9% | 8.6% | 8.4% | 8.2% | 7.9% | 7.2% | 6.5% |
| Energy taxes | 2,520 | 2,692 | 2,634 | 2,721 | 2,840 | 3,043 | 3,135 | 3,258 | 3,176 | 3,016 |
| Duty on light hydrocarbon oil products | 993 | 991 | 911 | 854 | 810 | 771 | 725 | 679 | 596 | 562 |
| Duty on other hydrocarbon oil products | 1,106 | 1,128 | 1,124 | 1,182 | 1,234 | 1,350 | 1,454 | 1,554 | 1,559 | 1,603 |
| Electricity tax | 7 | 7 | 7 | 6 | 6 | 4 | 5 | 4 | 3 | 3 |
| National Oil Reserves Agency levy | 140 | 130 | 123 | 124 | 121 | 130 | 132 | 130 | 134 | 134 |
| Carbon tax | 235 | 301 | 363 | 387 | 386 | 419 | 434 | 435 | 430 | 435 |
| Carbon credits | 0 | -4 | 5 | 17 | 42 | 36 | 44 | 43 | 49 | 79 |
| Public Service Obligation levy | 39 | 140 | 102 | 151 | 242 | 333 | 342 | 412 | 406 | 201 |
| Transport taxes | 1,522 | 1,449 | 1,472 | 1,664 | 1,796 | 1,887 | 1,924 | 1,929 | 1,917 | 1,977 |
| Vehicle registration tax | 395 | 394 | 384 | 459 | 572 | 702 | 814 | 850 | 872 | 950 |
| Air travel tax | 103 | 44 | 34 | 34 | 11 | 0 | 0 | 0 | 0 | 0 |
| National Car Test (NCT) Levy | 0 | 0 | 0 | 21 | 34 | 40 | 38 | 37 | 37 | 37 |
| Motor tax (business) | 256 | 253 | 264 | 284 | 290 | 281 | 263 | 255 | 245 | 241 |
| Motor tax (households) | 761 | 749 | 781 | 853 | 869 | 843 | 789 | 766 | 736 | 723 |
| Vehicle and driving licence expenses | 7 | 9 | 10 | 13 | 20 | 20 | 20 | 21 | 26 | 26 |
| Pollution and Resource taxes | 61 | 63 | 67 | 59 | 48 | 47 | 58 | 46 | 26 | 20 |
| Plastic bag levy | 17 | 16 | 14 | 15 | 13 | 12 | 9 | 7 | 6 | 6 |
| Landfill levy | 43 | 46 | 52 | 43 | 34 | 34 | 48 | 37 | 19 | 12 |
| Fisheries protection | 1 | 1 | 1 | 1 | 1 | 1 | 1 | 1 | 1 | 1 |
| 1 Provisional | ||||||||||
| Table 2 Environment Taxes by NACE Sector of Payee, 2010-2019 | ||||||||||
| €m | ||||||||||
| NACE Rev. 2 | 2010 | 2011 | 2012 | 2013 | 2014 | 2015 | 2016 | 2017 | 2018 | 2019 |
| Total environment taxes | 4,104 | 4,204 | 4,173 | 4,445 | 4,684 | 4,977 | 5,117 | 5,232 | 5,119 | 5,013 |
| Agriculture, forestry and fishing (01-03) | 41 | 59 | 55 | 58 | 57 | 81 | 74 | 73 | 68 | 64 |
| Industry (05-43) | 412 | 433 | 418 | 486 | 523 | 500 | 562 | 629 | 700 | 725 |
| Mining and quarrying (05-09) | 17 | 22 | 17 | 16 | 16 | 12 | 26 | 50 | 83 | 95 |
| Food, beverages and tobacco (10-12) | 29 | 45 | 41 | 47 | 62 | 57 | 59 | 66 | 63 | 62 |
| Textiles and pharmaceuticals (13-21) | 12 | 31 | 21 | 36 | 41 | 36 | 40 | 36 | 39 | 35 |
| Plastic and non-metallic minerals (22-23) | 62 | 73 | 58 | 69 | 66 | 58 | 70 | 96 | 121 | 112 |
| Metals, machinery and equipment (24-33) | 124 | 164 | 185 | 226 | 233 | 226 | 249 | 261 | 279 | 309 |
| Electricity and gas (35) | 21 | 12 | 12 | 12 | 13 | 22 | 23 | 25 | 24 | 25 |
| Water and Waste (36-39) | 87 | 51 | 52 | 43 | 41 | 40 | 45 | 46 | 45 | 47 |
| Construction (41-43) | 59 | 35 | 31 | 38 | 51 | 50 | 50 | 50 | 45 | 41 |
| Services (45-96) | 958 | 972 | 945 | 1,066 | 1,109 | 1,252 | 1,355 | 1,520 | 1,544 | 1,607 |
| Wholesale and retail trade (45-47) | 167 | 171 | 164 | 220 | 223 | 270 | 282 | 320 | 314 | 312 |
| Transport, postal and warehousing (49-53) | 371 | 421 | 415 | 431 | 443 | 462 | 523 | 553 | 534 | 517 |
| Accommodation and food (55-56) | 26 | 26 | 23 | 28 | 35 | 49 | 55 | 63 | 60 | 55 |
| Information and computing (62-63) | 45 | 21 | 26 | 31 | 34 | 50 | 60 | 77 | 88 | 105 |
| Rental and leasing (77) | 111 | 93 | 64 | 50 | 38 | 45 | 44 | 51 | 58 | 65 |
| Public administration (84) | 106 | 106 | 98 | 83 | 88 | 99 | 112 | 121 | 113 | 112 |
| Other (58-61, 64-66, 68-75, 78-82, 85-88, 90-96) | 132 | 133 | 155 | 222 | 248 | 277 | 279 | 334 | 379 | 442 |
| Households and non-residents | 2,692 | 2,739 | 2,755 | 2,835 | 2,995 | 3,144 | 3,126 | 3,011 | 2,807 | 2,617 |
| Table 3 Energy Taxes by NACE Sector of Payee, 2010-2019 | ||||||||||
| €m | ||||||||||
| NACE Rev. 2 | 2010 | 2011 | 2012 | 2013 | 2014 | 2015 | 2016 | 2017 | 2018 | 2019 |
| Total energy taxes | 2,520 | 2,692 | 2,634 | 2,721 | 2,840 | 3,043 | 3,135 | 3,258 | 3,176 | 3,016 |
| Annual % change | 11.2% | 6.8% | -2.1% | 3.3% | 4.4% | 7.1% | 3.0% | 3.9% | -2.5% | -5.0% |
| Agriculture, forestry and fishing (01-03) | 39 | 56 | 49 | 53 | 51 | 73 | 65 | 64 | 58 | 54 |
| Industry (05-43) | 264 | 280 | 240 | 285 | 313 | 292 | 343 | 398 | 458 | 459 |
| Mining and quarrying (05-09) | 17 | 22 | 17 | 16 | 16 | 12 | 26 | 49 | 82 | 94 |
| Food, beverages and tobacco (10-12) | 28 | 43 | 39 | 45 | 60 | 55 | 58 | 60 | 56 | 54 |
| Textiles and pharmaceuticals (13-21) | 11 | 30 | 20 | 33 | 38 | 33 | 37 | 33 | 37 | 32 |
| Plastic and non-metallic minerals (22-23) | 62 | 72 | 57 | 68 | 65 | 57 | 69 | 94 | 120 | 111 |
| Metals, machinery and equipment (24-33) | 24 | 41 | 31 | 45 | 47 | 41 | 53 | 55 | 62 | 69 |
| Electricity and gas (35) | 21 | 12 | 12 | 11 | 13 | 22 | 23 | 25 | 24 | 25 |
| Water and Waste (36-39) | 87 | 51 | 51 | 42 | 41 | 40 | 44 | 45 | 44 | 45 |
| Construction (41-43) | 15 | 10 | 12 | 23 | 33 | 32 | 33 | 35 | 33 | 30 |
| Services (45-96) | 712 | 770 | 763 | 858 | 915 | 1,050 | 1,118 | 1,233 | 1,189 | 1,135 |
| Wholesale and retail trade (45-47) | 148 | 146 | 137 | 182 | 193 | 239 | 239 | 265 | 244 | 221 |
| Transport, postal and warehousing (49-53) | 334 | 390 | 388 | 378 | 395 | 406 | 470 | 507 | 494 | 481 |
| Accommodation and food (55-56) | 23 | 25 | 22 | 27 | 33 | 48 | 53 | 61 | 58 | 52 |
| Information and computing (62-63) | 3 | 5 | 13 | 16 | 19 | 29 | 28 | 33 | 31 | 27 |
| Rental and leasing (77) | 8 | 12 | 12 | 18 | 15 | 21 | 14 | 12 | 11 | 11 |
| Public administration (84) | 104 | 97 | 87 | 80 | 83 | 90 | 105 | 116 | 109 | 108 |
| Other (58-61, 64-66, 68-75, 78-82, 85-88, 90-96) | 92 | 94 | 103 | 155 | 177 | 218 | 208 | 238 | 242 | 235 |
| Households and non-residents | 1,506 | 1,586 | 1,582 | 1,526 | 1,562 | 1,627 | 1,610 | 1,564 | 1,471 | 1,369 |
| Table 4 Transport Taxes by NACE Sector of Payee, 2010-2019 | ||||||||||
| €m | ||||||||||
| NACE Rev. 2 | 2010 | 2011 | 2012 | 2013 | 2014 | 2015 | 2016 | 2017 | 2018 | 2019 |
| Total transport taxes | 1,522 | 1,449 | 1,472 | 1,664 | 1,796 | 1,887 | 1,924 | 1,929 | 1,917 | 1,977 |
| Annual % change | -0.1% | -4.8% | 1.6% | 13.0% | 7.9% | 5.1% | 2.0% | 0.3% | -0.6% | 3.1% |
| Agriculture, forestry and fishing (01-03) | 2 | 3 | 5 | 4 | 6 | 7 | 9 | 9 | 9 | 10 |
| Industry (05-43) | 142 | 144 | 169 | 194 | 203 | 201 | 212 | 227 | 240 | 265 |
| Mining and quarrying (05-09) | 0 | 0 | 0 | 0 | 0 | 0 | 0 | 0 | 1 | 2 |
| Food, beverages and tobacco (10-12) | 0 | 0 | 0 | 0 | 0 | 0 | 0 | 5 | 7 | 8 |
| Textiles and pharmaceuticals (13-21) | 1 | 1 | 1 | 2 | 2 | 2 | 2 | 2 | 2 | 3 |
| Plastic and non-metallic minerals (22-23) | 0 | 0 | 0 | 0 | 0 | 0 | 1 | 1 | 1 | 1 |
| Metals, machinery and equipment (24-33) | 98 | 119 | 151 | 177 | 184 | 182 | 193 | 204 | 216 | 239 |
| Electricity and gas (35) | 0 | 0 | 0 | 0 | 0 | 0 | 0 | 0 | 0 | 0 |
| Water and Waste (36-39) | 0 | 0 | 0 | 0 | 0 | 0 | 0 | 1 | 1 | 2 |
| Construction (41-43) | 42 | 22 | 17 | 13 | 16 | 15 | 15 | 14 | 12 | 11 |
| Services (45-96) | 232 | 193 | 173 | 197 | 185 | 192 | 224 | 277 | 350 | 467 |
| Wholesale and retail trade (45-47) | 17 | 24 | 26 | 36 | 28 | 30 | 42 | 54 | 69 | 91 |
| Transport, postal and warehousing (49-53) | 36 | 30 | 25 | 51 | 48 | 54 | 51 | 45 | 40 | 36 |
| Accommodation and food (55-56) | 2 | 0 | 1 | 1 | 1 | 1 | 1 | 2 | 2 | 2 |
| Information and computing (62-63) | 40 | 15 | 13 | 14 | 14 | 20 | 29 | 40 | 54 | 75 |
| Rental and leasing (77) | 100 | 80 | 51 | 30 | 22 | 24 | 29 | 38 | 46 | 54 |
| Public administration (84) | 2 | 9 | 11 | 4 | 6 | 9 | 7 | 5 | 4 | 3 |
| Other (58-61, 64-66, 68-75, 78-82, 85-88, 90-96) | 34 | 35 | 47 | 62 | 66 | 55 | 66 | 93 | 134 | 205 |
| Households and non-residents | 1,146 | 1,109 | 1,125 | 1,268 | 1,402 | 1,487 | 1,479 | 1,416 | 1,318 | 1,235 |
| Table 5 Pollution and Resource Taxes by NACE Sector of Payee, 2010-2019 | ||||||||||
| €m | ||||||||||
| NACE Rev. 2 | 2010 | 2011 | 2012 | 2013 | 2014 | 2015 | 2016 | 2017 | 2018 | 2019 |
| Total pollution and resource taxes | 61 | 63 | 67 | 59 | 48 | 47 | 58 | 46 | 26 | 20 |
| Annual % change | 7.6% | 3.3% | 5.7% | -11.3% | -19.9% | -0.7% | 23.4% | -21.8% | -42.6% | -25.2% |
| Agriculture, forestry and fishing (01-03) | 0 | 0 | 1 | 0 | 0 | 0 | 1 | 0 | 0 | 0 |
| Industry (05-43) | 6 | 9 | 9 | 8 | 7 | 7 | 8 | 4 | 2 | 1 |
| Mining and quarrying (05-09) | 0 | 0 | 0 | 0 | 0 | 0 | 0 | 0 | 0 | 0 |
| Food, beverages and tobacco (10-12) | 1 | 1 | 2 | 1 | 1 | 1 | 1 | 0 | 0 | 0 |
| Textiles and pharmaceuticals (13-21) | 0 | 0 | 1 | 1 | 1 | 1 | 1 | 0 | 0 | 0 |
| Plastic and non-metallic minerals (22-23) | 1 | 1 | 1 | 1 | 0 | 0 | 1 | 1 | 0 | 0 |
| Metals, machinery and equipment (24-33) | 2 | 4 | 3 | 3 | 2 | 3 | 3 | 2 | 1 | 1 |
| Electricity and gas (35) | 0 | 0 | 0 | 0 | 0 | 0 | 0 | 0 | 0 | 0 |
| Water and Waste (36-39) | 0 | 0 | 0 | 0 | 0 | 0 | 0 | 0 | 0 | 0 |
| Construction (41-43) | 2 | 3 | 2 | 2 | 2 | 2 | 2 | 1 | 0 | 0 |
| Services (45-96) | 14 | 9 | 9 | 11 | 9 | 9 | 13 | 10 | 6 | 5 |
| Wholesale and retail trade (45-47) | 1 | 1 | 1 | 2 | 2 | 1 | 1 | 1 | 0 | 0 |
| Transport, postal and warehousing (49-53) | 1 | 1 | 2 | 2 | 1 | 1 | 1 | 1 | 0 | 0 |
| Accommodation and food (55-56) | 1 | 0 | 0 | 0 | 0 | 0 | 0 | 0 | 0 | 0 |
| Information and computing (62-63) | 1 | 1 | 0 | 1 | 1 | 2 | 4 | 5 | 3 | 3 |
| Rental and leasing (77) | 3 | 2 | 1 | 1 | 1 | 1 | 1 | 1 | 0 | 0 |
| Public administration (84) | 0 | 0 | 0 | 0 | 0 | 0 | 0 | 0 | 0 | 0 |
| Other (58-61, 64-66, 68-75, 78-82, 85-88, 90-96) | 7 | 4 | 5 | 5 | 4 | 4 | 5 | 3 | 2 | 2 |
| Households and non-residents | 40 | 44 | 48 | 40 | 31 | 30 | 37 | 32 | 18 | 13 |
This release contains an analysis of environment taxes by category of tax and economic sector of the payee.
The starting point to produce Environment taxes is the National Tax List prepared by the CSO for the National Accounts and submitted to Eurostat under the European System of Accounts transmission programme. A number of different data sources are used to allocate revenues to payee sectors. These include the Supply-Use tables and Personal Consumption Expenditure data from the National Accounts along with specific information about individual taxes.
Environment taxes 2019 show revisions when compared with corresponding figures in the 2018 Environment taxes release. These revisions arise due to the incorporation of the 2016 Supply and Use Table and annual revisions to taxes in our National Accounts, including specific revisions to taxes paid in relation to Carbon Credits and the National Car Test levy from 2012 and 2013 forward respectively. In the 2019 release the National Car Test levy now includes the Commercial Vehicle levy, while an updated method for calculating Carbon Credits within the National Accounts has led to a revision of the Carbon Credits figures.
Business Energy Use statistics from 2009 forward have been incorporated for the first time in the estimation of 2019 Environment taxes release. They replace previously compiled returns based on CO2 Emissions data from 2009 forward. Accordingly, this methodological improvement has introduced a significant discontinuity in the Environment taxes between 2008 and 2009. While all NACE divisions are affected the biggest changes have occurred in construction, wholesale and retail, transport and public services.
An environment tax is defined by Regulation (EU) 691/2011 as:
“A tax whose tax base is a physical unit (or a proxy of a physical unit) of something that has a proven, specific negative impact on the environment, and which is identified in ESA as a tax.”
Once a tax base has been included in the list of environment tax bases, any tax levied on that base is considered an environment tax, irrespective of the motivation behind it. A list of Environment tax bases was agreed by Eurostat, the EU Commission, the OECD and the IEA and has been periodically revised. Table 1 contains national level data for each tax.
Energy taxes (including fuel for transport): This category includes taxes on energy production and energy products, including taxes on fuels for transport and stationary purposes. By definition Carbon taxes are included as an Energy tax rather than a Pollution tax, largely to aid international comparability. In Ireland’s case, taxes on transport fuels make up the bulk of energy taxes.
Transport taxes: This category includes taxes related to the ownership and use of motor vehicles. In Ireland this mainly relates to Vehicle Registration Tax (VRT) and Motor tax.
Pollution taxes: This category includes taxes levied on emissions to air and water, management of solid waste and noise. Carbon taxes are not included in this category.
Resource taxes: Included are taxes linked to the extraction or use of natural resources. Taxes on land are generally not included, nor are taxes designed to capture the resource rent from the extraction of natural resources.
Payees are classified by household and industry according to NACE Revision (Rev.) 2 classification - the European Union’s Statistical Classification of Economic Activity in the European Communities. The tax payer is considered to be the unit using the tax base (e.g. user of electricity or transport fuel) or undertaking the activity being taxed (e.g. disposing of waste). This principle (often called the "polluter pays principle") holds regardless of where the tax is collected. Taxes on transport fuels are, for efficiency reasons, collected from mineral oil tax warehouses. The tax has been allocated to the unit purchasing the fuel for final use.
For further information on the NACE Rev. 2 classification of industrial activity, use the following link:
https://www.cso.ie/en/methods/classifications/nacecoder/
All NACE Rev.2 sectors are covered in Tables 2 to 5 using abbreviated titles as follows:
| Abbreviated Titles | Full Titles |
| Agriculture, forestry and fishing (01-03) | Agriculture, forestry and fishing (01-03) |
| Industry (05-43) | Industry (05-43) |
| Mining and quarrying (05-09) | Mining and quarrying (05-09) |
| Food, beverages and tobacco (10-12) | Food, beverages and tobacco products (10-12) |
| Textiles and pharmaceuticals (13-21) | Textiles, wood, leather, petroleum, chemical and pharmaceutical products (13-21) |
| Plastic and non-metallic minerals (22-23) | Rubber, plastic and non-metallic mineral products (22-23) |
| Metals, machinery and equipment (24-33) | Metals, computers, electronic, electrical, machinery and equipment, transport and other manufacturing, repair and installation (24-33) |
| Electricity and gas (35) | Electricity, gas, steam and air conditioning supply (35) |
| Water and Waste (36-39) | Water collection/treatment/supply, sewerage, waste collection, treatment, disposal, materials recovery, remediation and other waste management (36-39) |
| Construction (41-43) | Construction (41-43) |
| Services (45-96) | Services (45-96) |
| Wholesale and retail trade (45-47) | Wholesale and retail trade including motor vehicles and their repair (45-47) |
| Transport, postal and warehousing (49-53) | Transport, postal, courier activities including warehousing and support (49-53) |
| Accommodation and food (55-56) | Accommodation; food and beverage service activities (55-56) |
| Information and computing (62-63) | Computer programming, consultancy, information services activities (62-63) |
| Rental and leasing (77) | Rental and leasing (77) |
| Public administration (84) | Public administration and defence; compulsory social security (84) |
| Other Services (58-61, 64-66, 68-75, 78-82, 85-88, 90-96) | Other Services (58-61, 64-66, 68-75, 78-82, 85-88, 90-96) |
The method used to allocate environment taxes to tax payers varies depending on the tax in question, using Supply-Use tables in some instances and more detailed sources where such are available.
Energy taxes
The largest component of energy taxes relates to taxes levied on fuel purchases. The overall environment taxes reported in the National Tax List is split according to fuel type excise data available from the Revenue Commissioners. Separately, Personal Consumption Expenditure is also available for each fuel type within the National Accounts. The household component of tax revenue associated with each fuel type is estimated by combining these two sources. The residual (i.e. non-household) component of tax revenue is then allocated across all NACE Rev. 2 sectors. Transport fuels are allocated according to NACE sector analysis of Business Energy Use statistics. For non-transport fuels and other non-fuel Energy taxes including the Carbon tax, Electricity tax and the National Oil Reserves Agency Levy, allocation of the respective tax to payee NACE Rev. 2 sector is accomplished using Supply-Use tables.
Transport taxes
Revenues from transport taxes are predominantly derived from two sources, Motor tax and Vehicle Registration Tax (VRT). The National Tax List splits motor tax into household and business components with the business portion further allocated to payee NACE Rev. 2 sector using Supply-Use. VRT is payable by consumers on purchase or private import of a motor vehicle. The rate of tax varies by type of vehicle and CO2 emissions rating. The Supply-Use tables are used to allocate the tax revenues to tax payers with non-applicable sectors (e.g. the motor trade itself) excluded.
Transport taxes also include an “Air travel tax” which was payable by all passengers travelling by air during the period 2009 to 2014. This revenue is allocated to business and private travel using data from the CSO’s Household Travel Survey. The remaining business travel portion is then allocated using the Supply-Use tables.
Pollution and Resource taxes
There are four taxes classified as Pollution or Resource taxes, namely a Landfill levy, a Plastic bag levy, a Fisheries levy and a Petroleum Act levy. Revenue raised from the landfill levy (a “per tonne” levy on waste disposed of via landfill) is allocated using the Supply-Use tables excluding not-applicable industries (e.g. intermediaries). The Plastic bag levy is levied on shoppers; accordingly, it is allocated entirely to households.
The Fisheries levy is a very small resource tax levied on fishing. The bulk of this tax is allocated to households (arising from rod-licences) with the residual allocated to NACE 03 (fishing sector).
The National Tax List excludes most of the Petroleum Act levy as a “resource rent”, with the amount remaining being paid by the mining and quarrying industries.
The manual, "Environment taxes - a statistical guide", published by Eurostat is the relevant source for defining what tax bases are to be considered within the remit of environment taxes. All taxes levied on these bases are thereafter considered to be environment type taxes regardless of the reason why the tax was originally introduced. The 2013 update of the manual lists the following environment tax bases:
Energy taxes (including fuel for transport)
— Energy products for transport purposes
Unleaded and Leaded Petrol, Diesel and other energy products for transport purposes (e.g. LPG, natural gas, kerosene or fuel oil)
— Energy products for stationary purposes
Light fuel oil, Heavy fuel oil, Natural gas, Coal, Coke, Biofuels, Electricity consumption and production, District heat consumption and production and other energy products for stationary use
— Greenhouse gases
Carbon content of fuels and emissions of greenhouse gases (including proceeds from emission permits recorded as taxes in the National Accounts)
Transport (excluding fuel for transport)
— Motor vehicles import or sale (one off taxes)
— Registration or use of motor vehicles, recurrent (e.g. yearly taxes)
— Road use (e.g. motorway taxes)
— Congestion charges and city tolls (if taxes in national accounts)
— Other means of transport (ships, airplanes, railways, etc.)
— Flights and flight tickets
— Vehicle insurance (excludes general insurance taxes)
Pollution
— Measured or estimated emissions to air
Measured or estimated NOx emissions, measured or estimated SOx emissions and other measured or estimated emissions to air (excluding CO2)
— Ozone depleting substances (e.g. CFCs or halons)
— Measured or estimated effluents to water
Measured or estimated effluents of oxydisable matter (BOD, COD) and other measured or estimated effluents to water
— Waste management
Collection, treatment or disposal, and individual products (e.g. packaging, beverage containers, batteries, tyres, lubricants)
— Noise (e.g. aircraft take-off and landings)
Resources
— Water abstraction
— Harvesting of biological resources (e.g. timber, hunted and fished species)
— Extraction of raw materials (e.g. minerals, oil and gas)
— Landscape changes and cutting of trees
— Energy products for transport purposes
Table 1 presents the total environment taxes from 2010, broken down by category of environment tax and individual tax type. Tables 2 to 5 present the environment tax categories broken down by economic activity of the payee.
 Hide Background Notes
Scan the QR code below to view this release online or go to
http://www.cso.ie/en/releasesandpublications/er/eaet/environmenttaxes2019/
 Show Table 1 Environment Taxes by Tax type, 2010-2019
 Hide Table 1 Environment Taxes by Tax type, 2010-2019