
| CPI and HICP | |||||||
| CPI | HICP | ||||||
| % monthly change | % annual change | % monthly change | % annual change | ||||
| Apr 2016 | 0.2 | -0.1 | 0.3 | -0.2 | |||
| May 2016 | 0.5 | 0.0 | 0.5 | -0.2 | |||
| Jun 2016 | 0.7 | 0.4 | 0.7 | 0.1 | |||
| Jul 2016 | -0.2 | 0.5 | -0.3 | 0.1 | |||
| Aug 2016 | -0.2 | -0.1 | -0.2 | -0.4 | |||
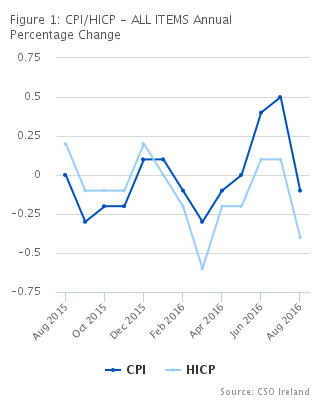
Prices on average, as measured by the CPI, were 0.1% lower in August compared with August 2015.
The most notable changes in the year were decreases in Transport (-4.6%), Furnishings, Household Equipment & Routine Household Maintenance (-3.8%), Communications (-3.0%) and Housing, Water, Electricity, Gas & Other Fuels (-1.5%). There were increases in Miscellaneous Goods & Services (+5.1%), Education (+3.8%), Restaurants & Hotels (+2.5%) and Alcoholic Beverages & Tobacco (+1.8%).
Consumer Prices in August, as measured by the CPI, decreased by 0.2% in the month. During August of last year, prices rose by 0.4% in the month. The most significant monthly price changes were decreases in Transport (-1.6%) and Communications (-1.4%). There were increases in Clothing & Footwear (+4.8%) and Restaurants & Hotels (+0.2%).
Contributions to the overall CPI – annual change
Table 17 shows the contribution of each 2-digit COICOP1 division to the overall change in the CPI. A detailed breakdown of the individual components of each of the 12 COICOP divisions is presented in Tables 4 to 15.
The divisions which caused the largest downward contribution to the CPI in the year were Transport (-0.62%), Housing, Water, Electricity, Gas & Other Fuels (-0.23%) and Furnishings, Household Equipment & Routine Household Maintenance (-0.18%).
The divisions which caused the largest upward contribution to the CPI in the year were Miscellaneous Goods & Services (+0.58%), Restaurants & Hotels (+0.45%) and Education (+0.10%).
The main factors contributing to the annual change were as follows:
Contributions to the overall CPI – monthly change
The divisions which caused the largest downward contribution to the CPI in the month were Transport (-0.24%) and Housing, Water, Electricity, Gas & Other Fuels (-0.09%). The division which caused the largest upward contribution in the month was Clothing & Footwear (+0.19%).
The main factors contributing to the monthly change were as follows:
CPI sub-indices
The sub index for Services rose by 2.1% in the year to August, while Goods decreased by 3.1%. Services, excluding mortgage interest repayments, increased by 2.7% in the year since August 2015.
The CPI excluding tobacco decreased by 0.3% in the month of August and fell by 0.3% in the year. The CPI excluding mortgage interest decreased by 0.2% in the month and rose by 0.2% in the year.
Harmonised Index of Consumer Prices
Prices on average, as measured by the EU Harmonised Index of Consumer Prices (HICP), decreased by 0.4% compared with August 2015.
The most notable changes in the year were decreases in Transport (-5.0%), Furnishings, Household Equipment & Routine Household Maintenance (-3.8%) and Communications (-3.0%). There were increases in Education (+3.8%), Restaurants & Hotels (+2.6%) and Alcoholic Beverages & Tobacco (+1.8%).
The HICP decreased by 0.2% in the month. This compares to an increase of 0.3% recorded in August of last year.
The most significant monthly price changes were decreases in Transport (-1.8%) and Communications (-1.4%). There were increases in Clothing & Footwear (+4.8%) and Restaurants & Hotels (+0.3%).
1 Classification of Individual Consumption by Purpose Adapted to the Needs of Harmonised Indices of Consumer Prices (2000).
2 See background notes for more detail.
| Contributions to change | annual % change |
|---|---|
| Food & Non-Alcoholic Beverages | -0.9 |
| Alcoholic Beverages & Tobacco | 1.8 |
| Clothing & Footwear | -0.9 |
| Housing, Water, Electricity, Gas, etc. | -1.5 |
| Furnishings, Household Equipment, etc. | -3.8 |
| Health | 1.4 |
| Transport | -4.6 |
| Communications | -3 |
| Recreation & Culture | -1 |
| Education | 3.8 |
| Restaurants & Hotels | 2.5 |
| Miscellaneous Goods & Services | 5.1 |
| ALL ITEMS | -0.1 |
| Table 1 Consumer Price Index (All Items) | ||||||||||
| Period | Consumer Price Index (CPI) | Percentage changes | ||||||||
| Dec. 2011=100 | Dec. 2006=100 | 1 month | 3 months | 12 months | ||||||
| 2009 | Year | 97.9 | 102.2 | -4.5 | ||||||
| 2010 | Year | 96.9 | 101.2 | -1.0 | ||||||
| 2011 | Year | 99.4 | 103.8 | 2.6 | ||||||
| 2012 | Year | 101.1 | 105.6 | 1.7 | ||||||
| 2013 | Year | 101.6 | 106.1 | 0.5 | ||||||
| 2014 | Year | 101.8 | 106.3 | 0.2 | ||||||
| 2015 | Year | 101.5 | 106.0 | -0.3 | ||||||
| 2013 | January | 100.7 | 105.2 | -0.5 | -0.8 | 1.2 | ||||
| February | 101.5 | 105.9 | 0.8 | 0.4 | 1.1 | |||||
| March | 101.9 | 106.4 | 0.4 | 0.7 | 0.5 | |||||
| April | 101.9 | 106.4 | 0.0 | 1.2 | 0.5 | |||||
| May | 101.8 | 106.3 | -0.1 | 0.3 | 0.4 | |||||
| June | 101.9 | 106.4 | 0.1 | 0.0 | 0.7 | |||||
| July | 101.8 | 106.3 | -0.1 | -0.1 | 0.7 | |||||
| August | 101.9 | 106.3 | 0.1 | 0.1 | 0.2 | |||||
| September | 101.8 | 106.2 | -0.1 | -0.1 | 0.2 | |||||
| October | 101.6 | 106.0 | -0.2 | -0.2 | 0.1 | |||||
| November | 101.4 | 105.9 | -0.2 | -0.5 | 0.3 | |||||
| December | 101.4 | 105.9 | 0.0 | -0.4 | 0.2 | |||||
| 2014 | January | 100.9 | 105.3 | -0.5 | -0.7 | 0.2 | ||||
| February | 101.4 | 105.9 | 0.5 | 0.0 | -0.1 | |||||
| March | 102.1 | 106.6 | 0.7 | 0.7 | 0.2 | |||||
| April | 102.2 | 106.7 | 0.1 | 1.3 | 0.3 | |||||
| May | 102.2 | 106.7 | 0.0 | 0.8 | 0.4 | |||||
| June | 102.3 | 106.8 | 0.1 | 0.2 | 0.4 | |||||
| July | 102.1 | 106.6 | -0.2 | -0.1 | 0.3 | |||||
| August | 102.3 | 106.8 | 0.2 | 0.1 | 0.4 | |||||
| September | 102.1 | 106.5 | -0.2 | -0.2 | 0.3 | |||||
| October | 101.8 | 106.2 | -0.3 | -0.3 | 0.2 | |||||
| November | 101.5 | 106.0 | -0.3 | -0.8 | 0.1 | |||||
| December | 101.1 | 105.6 | -0.4 | -1.0 | -0.3 | |||||
| 2015 | January | 100.3 | 104.7 | -0.8 | -1.5 | -0.6 | ||||
| February | 100.9 | 105.3 | 0.6 | -0.6 | -0.5 | |||||
| March | 101.5 | 106.0 | 0.6 | 0.4 | -0.6 | |||||
| April | 101.5 | 105.9 | 0.0 | 1.2 | -0.7 | |||||
| May | 101.9 | 106.4 | 0.4 | 1.0 | -0.3 | |||||
| June | 102.2 | 106.6 | 0.3 | 0.7 | -0.1 | |||||
| July | 101.9 | 106.4 | -0.3 | 0.4 | -0.2 | |||||
| August | 102.3 | 106.8 | 0.4 | 0.4 | 0.0 | |||||
| September | 101.8 | 106.3 | -0.5 | -0.4 | -0.3 | |||||
| October | 101.6 | 106.0 | -0.2 | -0.3 | -0.2 | |||||
| November | 101.3 | 105.7 | -0.3 | -1.0 | -0.2 | |||||
| December | 101.2 | 105.7 | -0.1 | -0.6 | 0.1 | |||||
| 2016 | January | 100.4 | 104.8 | -0.8 | -1.2 | 0.1 | ||||
| February | 100.8 | 105.2 | 0.4 | -0.5 | -0.1 | |||||
| March | 101.2 | 105.6 | 0.4 | 0.0 | -0.3 | |||||
| April | 101.4 | 105.9 | 0.2 | 1.0 | -0.1 | |||||
| May | 101.9 | 106.4 | 0.5 | 1.1 | 0.0 | |||||
| June | 102.6 | 107.1 | 0.7 | 1.4 | 0.4 | |||||
| July | 102.4 | 106.9 | -0.2 | 1.0 | 0.5 | |||||
| August | 102.2 | 106.7 | -0.2 | 0.3 | -0.1 | |||||
| Table 2 Consumer Price Index Subindices - August 2016 | ||||||||||
| Subindices | Consumer Price Index (CPI) | Percentage changes | ||||||||
| Weights | ||||||||||
| 2016 | Dec. 2011=100 | Dec. 2006=100 | 1 month | 3 months | 12 months | |||||
| CPI excluding Tobacco | 97.575 | 101.6 | 105.3 | -0.3 | 0.2 | -0.3 | ||||
| CPI excluding Housing | 88.548 | 102.7 | 107.3 | -0.3 | 0.2 | -0.4 | ||||
| CPI excluding Mortgage Interest | 96.234 | 104.6 | 109.0 | -0.2 | 0.3 | 0.2 | ||||
| CPI excluding Mortgage Interest and Local Property Tax | 95.702 | 104.3 | 108.7 | -0.3 | 0.3 | 0.1 | ||||
| CPI excluding Energy Products | 91.796 | 103.5 | 105.4 | 0.1 | 0.4 | 0.8 | ||||
| CPI excluding Energy and Unprocessed Food | 86.703 | 103.9 | 106.4 | 0.0 | 0.4 | 0.8 | ||||
| Notes: CPI excluding Housing excludes rents, mortgage interest, maintenance & repair of the dwelling, refuse collection, sewage collection and | ||||||||||
| insurance connected with the dwelling. | ||||||||||
| CPI excluding Mortgage Interest and Local Property Tax excludes the items mortgage interest and miscellaneous goods & services (part of | ||||||||||
| COICOP 12.70) which predominantly comprises the local property tax. | ||||||||||
| CPI excluding Energy Products excludes fuels & lubricants for personal transport equipment and electricity, gas & other fuels. | ||||||||||
| CPI excluding Energy and Unprocessed Food excludes fuels & lubricants for personal transport equipment, electricity, gas & other fuels, meat, | ||||||||||
| vegetables, fruit and fish. | ||||||||||
| Table 3 Consumer Price COICOP Division Indices - August 2016 | |||||||||||
| COICOP Division | Consumer Price Index (CPI) | Percentage changes | |||||||||
| Weights | |||||||||||
| 2016 | Dec. 2011=100 | Dec. 2006=100 | 1 month | 3 months | 12 months | ||||||
| 01 | Food and Non-Alcoholic Beverages | 11.189 | 95.8 | 97.7 | 0.1 | -0.4 | -0.9 | ||||
| 02 | Alcoholic Beverages and Tobacco | 5.188 | 114.8 | 126.7 | 0.0 | 0.4 | 1.8 | ||||
| 03 | Clothing and Footwear | 4.357 | 84.8 | 61.1 | 4.8 | -4.5 | -0.9 | ||||
| 04 | Housing, Water, Electricity, Gas and Other Fuels | 15.237 | 98.5 | 105.8 | -0.6 | -1.5 | -1.5 | ||||
| 05 | Furnishings, Household Equipment and Routine Household Maintenance | 4.796 | 86.2 | 75.5 | 0.2 | -1.1 | -3.8 | ||||
| 06 | Health | 2.832 | 102.9 | 119.7 | 0.0 | 0.2 | 1.4 | ||||
| 07 | Transport | 13.546 | 98.2 | 107.0 | -1.6 | 3.4 | -4.6 | ||||
| 08 | Communications | 3.234 | 91.3 | 96.7 | -1.4 | -1.5 | -3.0 | ||||
| 09 | Recreation and Culture | 7.470 | 97.6 | 96.3 | -0.3 | -0.4 | -1.0 | ||||
| 10 | Education | 2.681 | 119.4 | 157.4 | 0.0 | 0.0 | 3.8 | ||||
| 11 | Restaurants and Hotels | 17.637 | 111.8 | 113.7 | 0.2 | 1.9 | 2.5 | ||||
| 12 | Miscellaneous Goods and Services | 11.833 | 117.0 | 140.2 | -0.5 | 0.0 | 5.1 | ||||
| ALL ITEMS | 100.000 | 102.2 | 106.7 | -0.2 | 0.3 | -0.1 | |||||
| Of which: | |||||||||||
| Goods | 41.863 | 91.4 | 89.9 | 0.0 | -1.2 | -3.1 | |||||
| Services | 58.137 | 111.1 | 121.9 | -0.4 | 1.2 | 2.1 | |||||
| Energy Products | 8.204 | 89.1 | 119.7 | -2.9 | -1.3 | -8.4 | |||||
| Utilities and Local Charges | 3.780 | 111.4 | 126.8 | -2.6 | -8.5 | -9.8 | |||||
| Alcohol | 10.701 | 109.4 | 111.1 | 0.0 | 0.2 | -0.3 | |||||
| Tobacco | 2.425 | 122.8 | 156.6 | 0.1 | 0.9 | 7.5 | |||||
| Mortgage Interest | 3.766 | 62.8 | 67.6 | 0.0 | -1.3 | -6.4 | |||||
| Services excluding Mortgage Interest | 54.371 | 116.8 | 128.5 | -0.3 | 1.4 | 2.7 | |||||
| Notes: See Background Notes for definition of COICOP divisions, goods, services and utilities and local charges. | |||||||||||
| Restaurants and Hotels (COICOP 11) includes alcoholic beverages consumed on licensed premises. | |||||||||||
| Alcohol constitutes part of COICOP 02 (off-licence sales) and part of COICOP 11 (alcohol consumed on licensed premises) giving a combined | |||||||||||
| index for alcohol. | |||||||||||
| Table 4 COICOP Division 01 Food and Non-Alcoholic Beverages - August 2016 | ||||||
| Description | Weights | Index | Percentage changes | |||
| 2016 | Dec. 2011=100 | 1 month | 12 months | |||
| 01.1 Food | 10.0546 | 95.7 | 0.1 | -0.9 | ||
| 01.1.1 Bread & Cereals | 1.8073 | 92.7 | -0.9 | -2.6 | ||
| Rice | 0.0492 | 104.4 | -0.3 | -0.6 | ||
| Flours & other cereals | 0.0613 | 114.4 | -0.3 | -0.8 | ||
| Bread | 0.6007 | 93.6 | -0.4 | -0.1 | ||
| Other bakery products | 0.5619 | 87.0 | -1.9 | -4.0 | ||
| Pizza & quiche | 0.1373 | 77.6 | 3.3 | -11.4 | ||
| Pasta products & couscous | 0.0966 | 92.1 | -0.9 | -1.2 | ||
| Breakfast cereals | 0.2570 | 104.9 | -2.5 | -2.3 | ||
| Other cereal products | 0.0433 | 94.7 | 1.5 | -0.5 | ||
| 01.1.2 Meat | 2.3983 | 94.6 | 0.5 | -1.8 | ||
| Beef & veal | 0.4127 | 106.8 | 2.5 | 0.4 | ||
| Pork | 0.1443 | 91.8 | 3.5 | 0.0 | ||
| Lamb & goat | 0.1400 | 92.8 | -3.1 | -2.1 | ||
| Poultry | 0.4551 | 91.6 | 0.0 | -1.8 | ||
| Edible offal | 0.0064 | 104.2 | -0.2 | 1.2 | ||
| Dried, salted or smoked meat | 0.8567 | 91.7 | 0.1 | -3.1 | ||
| Other meat preparations | 0.3831 | 93.3 | 0.4 | -2.0 | ||
| 01.1.3 Fish | 0.3950 | 100.9 | 1.3 | 0.7 | ||
| Fresh or chilled fish | 0.1533 | 112.2 | 5.3 | 5.2 | ||
| Frozen fish | 0.0602 | 77.3 | -2.2 | -4.8 | ||
| Fresh or chilled seafood | 0.0459 | 92.9 | 0.8 | -2.1 | ||
| Dried, smoked or salted fish & seafood | 0.0448 | 100.2 | -0.3 | 1.9 | ||
| Other preserved or processed fish & seafood-based preparations | 0.0908 | 103.7 | -1.8 | -2.4 | ||
| 01.1.4 Milk, cheese & eggs | 1.3909 | 95.9 | 0.0 | -1.5 | ||
| Fresh whole milk | 0.4057 | 97.7 | 0.0 | -0.5 | ||
| Fresh low fat milk | 0.1517 | 101.8 | -0.2 | 0.4 | ||
| Yoghurt | 0.2420 | 95.6 | 0.6 | -1.2 | ||
| Cheese & curd | 0.3196 | 91.0 | 0.1 | -2.0 | ||
| Other milk products | 0.1266 | 94.8 | -0.5 | -2.3 | ||
| Eggs | 0.1453 | 97.2 | 0.0 | -5.0 | ||
| 01.1.5 Oils & fats | 0.2922 | 102.8 | 0.7 | 0.6 | ||
| Butter | 0.1310 | 102.6 | 1.1 | 0.0 | ||
| Margarine & other vegetable fats | 0.0933 | 101.4 | 0.8 | -0.1 | ||
| Olive oil | 0.0263 | 103.2 | -1.9 | 2.8 | ||
| Other edible oils | 0.0416 | 106.0 | 0.8 | 2.8 | ||
| 01.1.6 Fruit | 0.7670 | 92.2 | -0.6 | 1.2 | ||
| Fresh or chilled fruit | 0.6402 | 90.9 | -0.3 | 2.2 | ||
| Dried fruit & nuts | 0.1077 | 96.3 | -2.3 | -4.3 | ||
| Preserved fruit & fruit-based products | 0.0192 | 113.0 | -4.0 | -2.7 | ||
| 01.1.7 Vegetables | 1.5327 | 100.7 | 0.3 | 3.2 | ||
| Fresh or chilled vegetables other than potatoes & other tubers | 0.6567 | 96.1 | -0.4 | -0.8 | ||
| Frozen vegetables other than potatoes & other tubers | 0.0395 | 91.0 | -0.9 | -1.8 | ||
| Dried vegetables, other preserved or processed vegetables | 0.2780 | 96.8 | -0.6 | -0.9 | ||
| Potatoes | 0.3375 | 107.0 | 0.9 | 19.2 | ||
| Crisps | 0.2210 | 106.0 | 2.9 | -1.9 | ||
| 01.1.8 Sugar, jam, honey, chocolate & confectionery | 1.1206 | 95.6 | 0.8 | -2.5 | ||
| Sugar | 0.1029 | 95.6 | -0.5 | -0.4 | ||
| Jams, marmalades & honey | 0.1248 | 98.6 | 1.1 | 1.2 | ||
| Chocolate | 0.4784 | 101.6 | 1.8 | -4.0 | ||
| Confectionery products | 0.2008 | 93.2 | 0.9 | -2.3 | ||
| Edible ices & ice cream | 0.2051 | 82.8 | -0.7 | -2.7 | ||
| Artifical sugar substitutes | 0.0085 | 96.6 | -3.9 | -2.1 | ||
| 01.1.9 Food products n.e.c. | 0.3506 | 96.8 | -0.3 | -1.5 | ||
| Sauces & condiments | 0.0943 | 94.4 | -0.2 | -4.0 | ||
| Salt, spices & culinary herbs | 0.0167 | 94.2 | 0.9 | -1.9 | ||
| Baby food | 0.0415 | 110.5 | 0.1 | 2.7 | ||
| Ready-made meals | 0.1039 | 88.3 | -0.6 | 0.0 | ||
| Other food products n.e.c. | 0.0942 | 103.9 | -0.4 | -2.1 | ||
| 01.2 Non-alcoholic beverages | 1.1347 | 95.9 | -0.7 | -1.9 | ||
| 01.2.1 Coffee, tea & cocoa | 0.1968 | 95.8 | -1.5 | -1.1 | ||
| Coffee | 0.0824 | 94.0 | -2.7 | -3.9 | ||
| Tea | 0.1041 | 96.3 | -0.6 | 1.5 | ||
| Cocoa & powdered chocolate | 0.0103 | 104.2 | -1.9 | -4.1 | ||
| 01.2.2 Mineral waters, soft drinks, fruit & vegetable juices | 0.9379 | 96.1 | -0.4 | -1.9 | ||
| Mineral or spring waters | 0.1335 | 95.3 | -0.3 | -3.1 | ||
| Soft drinks | 0.5575 | 93.6 | -1.1 | -2.7 | ||
| Fruit & vegetable juices | 0.2469 | 102.2 | 0.8 | 0.2 | ||
| Total | 11.1893 | 95.8 | 0.1 | -0.9 | ||
| Table 5 COICOP Division 02 Alcoholic Beverages and Tobacco - August 2016 | ||||||
| Description | Weights | Index | Percentage changes | |||
| 2016 | Dec. 2011=100 | 1 month | 12 months | |||
| 02.1 Alcoholic Beverages | 2.7634 | 108.0 | -0.1 | -3.1 | ||
| 02.1.1 Spirits | 0.3616 | 119.8 | -0.7 | 0.2 | ||
| 02.1.2 Wine | 1.3964 | 110.2 | 0.1 | -5.3 | ||
| 02.1.3 Beer | 1.0054 | 100.8 | -0.1 | -1.3 | ||
| 02.2 Tobacco | 2.4248 | 122.8 | 0.1 | 7.5 | ||
| Cigarettes | 2.3052 | 122.4 | 0.1 | 7.6 | ||
| Other tobacco products | 0.1195 | 131.3 | 0.1 | 7.5 | ||
| Total | 5.1882 | 114.8 | 0.0 | 1.8 | ||
| Table 6 COICOP Division 03 Clothing and Footwear - August 2016 | ||||||
| Description | Weights | Index | Percentage changes | |||
| 2016 | Dec. 2011=100 | 1 month | 12 months | |||
| 03.1 Clothing | 3.5763 | 85.2 | 4.8 | -0.4 | ||
| 03.1.2 Garments | 3.3516 | 84.5 | 5.1 | -0.4 | ||
| 03.1.3 Other articles of clothing & clothing accessories | 0.1513 | 95.3 | 4.3 | 2.3 | ||
| 03.1.4 Cleaning, repair & hire of clothing | 0.0733 | 103.0 | 0.0 | 1.2 | ||
| Dry cleaning & laundry | 0.0568 | 102.9 | 0.0 | 1.1 | ||
| Dress hire & repair of clothing | 0.0165 | 103.4 | 0.0 | 1.6 | ||
| 03.2 Footwear | 0.7812 | 83.3 | 4.3 | -3.6 | ||
| 03.2.1 Shoes & other footwear | 0.7726 | 83.1 | 4.4 | -3.7 | ||
| 03.2.2 Repair & hire of footwear | 0.0086 | 104.0 | 0.2 | 1.9 | ||
| Total | 4.3575 | 84.8 | 4.8 | -0.9 | ||
| Table 7 COICOP Division 04 Housing, Water, Electricity, Gas and Other Fuels - August 2016 | ||||||
| Description | Weights | Index | Percentage changes | |||
| 2016 | Dec. 2011=100 | 1 month | 12 months | |||
| 04.1/04.2 Actual rentals for housing & mortgage interest | 9.7883 | 96.6 | 0.4 | 2.5 | ||
| 04.1.1 Actual rentals paid by tenants (Rents) | 6.0223 | 136.8 | 0.6 | 8.4 | ||
| Private Rents | 5.2395 | 141.4 | 0.7 | 8.9 | ||
| Local Authority Rents | 0.7828 | 108.9 | 0.0 | 5.5 | ||
| 04.2.1 Mortgage Interest | 3.7660 | 62.8 | 0.0 | -6.4 | ||
| 04.3 Maintenance & repair of the dwelling | 0.6237 | 102.1 | 0.1 | 0.2 | ||
| 04.3.1 Materials for the maintenance & repair of the dwelling | 0.2387 | 99.2 | 0.1 | -1.2 | ||
| 04.3.2 Services for the maintenance & repair of the dwelling | 0.3850 | 103.9 | 0.0 | 1.1 | ||
| 04.4 Water supply & miscellaneous services relating to the dwelling | 0.7383 | 126.2 | 0.0 | -29.5 | ||
| 04.5 Electricity, gas & other fuels | 4.0867 | 96.2 | -3.3 | -6.1 | ||
| 04.5.1 Electricity | 2.2314 | 106.2 | -3.9 | -6.1 | ||
| 04.5.2 Gas | 0.7070 | 106.3 | -0.7 | -2.4 | ||
| Natural gas | 0.6714 | 106.8 | -0.7 | -2.5 | ||
| Bottled gas | 0.0356 | 95.8 | -0.5 | -2.3 | ||
| 04.5.3 Liquid fuels (Home Heating Oil) | 0.6552 | 63.8 | -6.5 | -13.0 | ||
| 04.5.4 Solid fuels | 0.4931 | 113.5 | 0.0 | -0.4 | ||
| Total | 15.2371 | 98.5 | -0.6 | -1.5 | ||
| Table 8 COICOP Division 05 Furnishings, Household Equipment and Routine Household Maintenance - August 2016 | ||||||
| Description | Weights | Index | Percentage changes | |||
| 2016 | Dec. 2011=100 | 1 month | 12 months | |||
| 05.1 Furniture & furnishings, carpets & other floor coverings | 1.1793 | 70.7 | -0.4 | -7.0 | ||
| 05.1.1 Furniture & furnishings | 1.1756 | 70.3 | -0.4 | -7.0 | ||
| 05.1.2 Carpets & other floor coverings | 0.0036 | 96.9 | 1.7 | 2.2 | ||
| 05.2 Household textiles | 0.4116 | 77.1 | 2.9 | -5.0 | ||
| 05.3 Household appliances | 0.4827 | 91.7 | 0.3 | -2.8 | ||
| 05.3.1 Major household appliances whether electric or not | 0.4082 | 91.2 | 0.1 | -3.1 | ||
| 05.3.2 Small electric household appliances | 0.0484 | 90.3 | 1.5 | -1.7 | ||
| 05.3.3 Repair of household appliances | 0.0262 | 101.4 | 0.0 | 0.0 | ||
| 05.4 Glassware, tableware & household utensils | 0.5301 | 86.6 | 0.9 | -2.5 | ||
| 05.5 Tools & equipment for house & garden | 0.2162 | 88.0 | -0.1 | -3.4 | ||
| 05.5.1 Major tools & equipment | 0.1225 | 80.1 | 0.1 | -5.2 | ||
| 05.5.2 Small tools & miscellaneous accessories | 0.0937 | 95.1 | -0.4 | -1.0 | ||
| 05.6 Goods & services for routine household maintenance | 1.9762 | 95.7 | 0.0 | -2.2 | ||
| 05.6.1 Non-durable household goods | 1.1121 | 90.6 | 0.0 | -5.5 | ||
| 05.6.2 Domestic services & household services | 0.8641 | 101.3 | 0.0 | 2.0 | ||
| Total | 4.7961 | 86.2 | 0.2 | -3.8 | ||
| Table 9 COICOP Division 06 Health - August 2016 | ||||||
| Description | Weights | Index | Percentage changes | |||
| 2016 | Dec. 2011=100 | 1 month | 12 months | |||
| 06.1 Medical products, appliances & equipment | 0.9934 | 100.4 | -0.2 | 0.2 | ||
| 06.1.1 Pharmaceutical products | 0.8092 | 99.8 | -0.1 | 0.2 | ||
| Prescribed drugs | 0.2175 | 94.7 | -0.6 | -0.3 | ||
| Other medicines | 0.5917 | 101.6 | 0.0 | 0.4 | ||
| 06.1.2 Other medical products | 0.0229 | 106.7 | 0.0 | 1.2 | ||
| 06.1.3 Therapeutic appliances & equipment | 0.1614 | 100.9 | 0.0 | 0.4 | ||
| 06.2 Out-patient services | 1.6383 | 103.4 | 0.1 | 2.3 | ||
| 06.2.1/3 Medical & paramedical services | 1.0990 | 103.9 | 0.2 | 3.1 | ||
| Doctors' fees | 0.9112 | 103.9 | 0.0 | 3.2 | ||
| Other medical & paramedical services | 0.1878 | 103.6 | 0.6 | 1.9 | ||
| 06.2.2 Dental services | 0.5393 | 102.5 | 0.0 | 0.9 | ||
| 06.3 Hospital services | 0.2000 | 101.0 | 0.0 | 0.0 | ||
| Total | 2.8318 | 102.9 | 0.0 | 1.4 | ||
| Table 10 COICOP Division 07 Transport - August 2016 | ||||||
| Description | Weights | Index | Percentage changes | |||
| 2016 | Dec. 2011=100 | 1 month | 12 months | |||
| 07.1 Purchase of vehicles | 3.8138 | 88.6 | 0.0 | -3.2 | ||
| 07.1.1 Motor cars | 3.7298 | 88.5 | -0.1 | -3.3 | ||
| 07.1.2 Motor cycles | 0.0127 | 108.3 | 0.0 | 3.0 | ||
| 07.1.3 Bicycles | 0.0713 | 87.4 | -0.9 | -4.0 | ||
| 07.2 Operation of personal transport equipment | 7.1654 | 92.8 | -1.0 | -6.5 | ||
| 07.2.1 Spare parts & accessories for personal transport equipment | 0.3915 | 96.6 | 0.0 | -1.7 | ||
| 07.2.2 Fuels & lubricants for personal transport equipment | 4.1170 | 83.5 | -2.5 | -10.5 | ||
| Petrol | 2.8127 | 86.4 | -2.7 | -10.5 | ||
| Diesel | 1.2871 | 77.0 | -2.2 | -10.8 | ||
| Motor oil | 0.0172 | 105.5 | 0.0 | 1.0 | ||
| 07.2.3 Maintenance & repair of personal transport equipment | 0.7101 | 98.9 | 0.2 | 0.4 | ||
| 07.2.4 Other services in respect of personal transport equipment | 1.9469 | 118.5 | 1.5 | -0.8 | ||
| Motor tax | 1.4402 | 121.8 | 0.0 | 0.0 | ||
| Other vehicle costs | 0.5067 | 108.9 | 5.7 | -2.7 | ||
| 07.3 Transport services | 2.5670 | 131.6 | -4.9 | -1.7 | ||
| 07.3.1 Passenger transport by railway | 0.2855 | 119.8 | 0.0 | 2.1 | ||
| 07.3.2 Passenger transport by road | 1.1757 | 115.1 | -0.2 | 0.3 | ||
| Bus fares | 0.7331 | 121.9 | -0.3 | 0.4 | ||
| Taxi fares | 0.4426 | 104.1 | 0.0 | 0.0 | ||
| 07.3.3 Passenger transport by air | 1.0088 | 139.9 | -9.4 | -13.8 | ||
| 07.3.4 Passenger transport by sea & inland waterway | 0.0491 | 126.9 | 8.7 | 2.3 | ||
| 07.3.5 Combined passenger transport | 0.0301 | 123.5 | 0.0 | 0.0 | ||
| 07.3.6 Other purchased transport services | 0.0179 | 103.2 | 0.0 | 0.6 | ||
| Total | 13.5462 | 98.2 | -1.6 | -4.6 | ||
| Table 11 COICOP Division 08 Communications - August 2016 | ||||||
| Description | Weights | Index | Percentage changes | |||
| 2016 | Dec. 2011=100 | 1 month | 12 months | |||
| 08.1 Postal services | 0.1459 | 131.0 | 3.1 | 3.1 | ||
| 08.2/3.0 Telephone & telefax equipment and telephone & telefax services | 3.0879 | 89.9 | -1.6 | -3.3 | ||
| Total | 3.2337 | 91.3 | -1.4 | -3.0 | ||
| Table 12 COICOP Division 09 Recreation and Culture - August 2016 | ||||||
| Description | Weights | Index | Percentage changes | |||
| 2016 | Dec. 2011=100 | 1 month | 12 months | |||
| 09.1 Audio-visual, photographic & information processing equipment | 0.7286 | 64.6 | -0.9 | -9.4 | ||
| 09.1.1 Equipment for the reception, recording & reproduction of sound & pictures | 0.2617 | 65.7 | -1.1 | -8.2 | ||
| 09.1.2 Photographic & cinematographic equipment & optical instruments | 0.0570 | 55.7 | -0.4 | -8.5 | ||
| 09.1.3 Information processing equipment | 0.1194 | 40.8 | 0.7 | -30.0 | ||
| 09.1.4 Recording media | 0.2651 | 80.5 | -1.5 | -2.2 | ||
| 09.1.5 Repair of audio-visual, photographic & information processing equipment | 0.0253 | 98.7 | -0.1 | 0.7 | ||
| 09.2 Other major durables for recreation & culture | 0.0090 | 95.9 | 0.0 | 2.1 | ||
| 09.3 Other recreational items & equipment, gardens & pets | 1.3673 | 83.6 | -1.4 | -6.5 | ||
| 09.3.1 Games, toys & hobbies | 0.8695 | 77.9 | -1.3 | -8.2 | ||
| 09.3.2 Equipment for sport, camping & open-air recreation | 0.0925 | 77.8 | 0.0 | -7.4 | ||
| 09.3.3 Gardens, plants & flowers | 0.1564 | 68.1 | -4.9 | -10.5 | ||
| 09.3.4/5 Pets & related products including veterinary & other services for pets | 0.2489 | 112.1 | -0.4 | 2.1 | ||
| 09.4 Recreational & cultural services | 2.7009 | 108.4 | -0.2 | 1.4 | ||
| 09.4.1 Recreational & sporting services | 0.7696 | 99.5 | 0.1 | 3.1 | ||
| Sports admittance | 0.0963 | 98.3 | 0.3 | -0.5 | ||
| Sports participation | 0.1826 | 97.3 | 0.2 | 1.0 | ||
| Club & society subscriptions | 0.4907 | 100.6 | 0.0 | 4.6 | ||
| 09.4.2 Cultural services | 1.9312 | 112.0 | -0.4 | 0.7 | ||
| Cinema | 0.1732 | 103.7 | 0.5 | 0.5 | ||
| Nightclubs | 0.1159 | 96.3 | 0.0 | -0.7 | ||
| Cultural admittance | 0.3608 | 117.1 | -1.3 | 1.7 | ||
| Television services | 1.2042 | 113.9 | 0.0 | 0.6 | ||
| Other entertainment | 0.0770 | 102.0 | -2.3 | -1.3 | ||
| 09.5 Newspapers, books & stationery | 1.4345 | 106.8 | 0.1 | 0.9 | ||
| 09.5.1 Books | 0.3823 | 110.1 | 0.8 | 2.2 | ||
| 09.5.2 Newspapers & periodicals | 0.9145 | 106.3 | 0.0 | 0.5 | ||
| 09.5.3/4 Miscellaneous printed matter and stationery & drawing materials | 0.1376 | 99.1 | -1.3 | 0.4 | ||
| 09.6 Package holidays | 1.2302 | 108.8 | 0.6 | 2.6 | ||
| Total | 7.4703 | 97.6 | -0.3 | -1.0 | ||
| Table 13 COICOP Division 10 Education - August 2016 | ||||||
| Description | Weights | Index | Percentage changes | |||
| 2016 | Dec. 2011=100 | 1 month | 12 months | |||
| 10.1 Pre-primary & primary education | 0.1514 | 101.8 | 0.0 | 0.4 | ||
| 10.2 Secondary education | 0.3971 | 109.4 | 0.0 | 1.9 | ||
| 10.4 Tertiary education | 1.7538 | 127.2 | 0.0 | 5.1 | ||
| 10.5 Education not definable by level | 0.3782 | 103.6 | 0.0 | 1.4 | ||
| Total | 2.6805 | 119.4 | 0.0 | 3.8 | ||
| Table 14 COICOP Division 11 Restaurants and Hotels - August 2016 | ||||||
| Description | Weights | Index | Percentage changes | |||
| 2016 | Dec. 2011=100 | 1 month | 12 months | |||
| 11.1 Catering services | 15.4833 | 107.3 | 0.0 | 1.1 | ||
| 11.1.1 Restaurants, cafes & the like | 14.7115 | 107.7 | 0.1 | 1.2 | ||
| Licenced premises | 8.3182 | 109.6 | 0.0 | 0.9 | ||
| Spirits | 2.0221 | 110.5 | 0.0 | 1.3 | ||
| Wine | 1.3207 | 109.1 | 0.1 | 1.0 | ||
| Beer | 4.5943 | 109.7 | 0.1 | 0.7 | ||
| Soft drinks & mineral water | 0.3810 | 105.6 | 0.1 | 0.9 | ||
| Restaurants, cafes, fast food & take-away food | 6.3934 | 105.1 | -0.1 | 1.4 | ||
| 11.1.2 Canteens | 0.7718 | 103.2 | 0.0 | 1.0 | ||
| 11.2 Accommodation services | 2.1533 | 146.0 | 1.5 | 12.0 | ||
| Total | 17.6366 | 111.8 | 0.2 | 2.5 | ||
| Table 15 COICOP Division 12 Miscellaneous Goods and Services - August 2016 | ||||||
| Description | Weights | Index | Percentage changes | |||
| 2016 | Dec. 2011=100 | 1 month | 12 months | |||
| 12.1 Personal care | 3.1513 | 91.0 | -0.8 | -2.3 | ||
| 12.1.1 Hairdressing salons & personal grooming establishments | 0.8646 | 100.0 | 0.1 | 1.1 | ||
| Hairdressing | 0.6550 | 100.1 | 0.1 | 0.7 | ||
| Health & beauty treatments | 0.1956 | 99.1 | 0.0 | 2.5 | ||
| Other personal grooming | 0.0140 | 105.8 | 0.0 | 1.6 | ||
| 12.1.2 Electric appliances for personal care | 0.1161 | 91.1 | 0.1 | -1.8 | ||
| 12.1.3 Other appliances, articles & products for personal care | 2.1705 | 87.4 | -1.2 | -3.6 | ||
| Hygiene products | 0.4568 | 88.3 | -2.3 | -4.0 | ||
| Hair products | 0.2592 | 94.9 | 1.4 | -2.9 | ||
| Cosmetics & skincare products | 0.9340 | 83.6 | -2.3 | -4.0 | ||
| Toilet accessories | 0.5205 | 89.7 | 0.2 | -3.2 | ||
| 12.3 Personal effects n.e.c. | 0.7070 | 68.8 | 0.7 | -7.8 | ||
| 12.3.1 Jewellery, clocks & watches | 0.2803 | 89.8 | 0.2 | -4.4 | ||
| 12.3.2 Other personal effects | 0.4267 | 55.1 | 0.9 | -9.8 | ||
| 12.4 Social protection | 0.7533 | 105.4 | 0.0 | 2.2 | ||
| Childcare | 0.6122 | 105.3 | 0.0 | 2.2 | ||
| Other social protection | 0.1411 | 105.7 | 0.0 | 1.9 | ||
| 12.5 Insurance | 5.6104 | 140.6 | -0.8 | 12.8 | ||
| 12.5.2 Insurance connected with the dwelling | 0.6130 | 106.3 | 0.0 | 10.6 | ||
| 12.5.3 Insurance connected with health | 3.3933 | 142.5 | -0.9 | 6.7 | ||
| 12.5.4 Insurance connected with transport | 1.6041 | 159.3 | -0.9 | 27.6 | ||
| Motor insurance | 1.5867 | 160.1 | -0.9 | 28.0 | ||
| Motor cycle insurance | 0.0135 | 108.7 | 0.0 | 5.8 | ||
| Motor car insurance | 1.5732 | 160.6 | -0.9 | 28.2 | ||
| Travel insurance | 0.0174 | 94.5 | 0.0 | -1.3 | ||
| 12.6 Financial services n.e.c. | 0.4029 | 115.2 | 0.0 | -0.1 | ||
| 12.7 Other services n.e.c. | 1.2078 | 149.9 | 0.1 | 0.9 | ||
| Total | 11.8327 | 117.0 | -0.5 | 5.1 | ||
| Table 16 Consumer Price Index Goods and Services by COICOP Division - August 2016 | |||||||||||
| COICOP Division | Weights 2016 | Index | Percentage changes | ||||||||
| Dec. 2011=100 | |||||||||||
| Overall | Goods | Services | Goods | Services | Goods | Services | Overall | ||||
| 12 months | 12 months | 12 months | |||||||||
| 01 | Food and Non Alcoholic Beverages | 11.189 | 11.189 | - | 95.8 | - | -0.9 | - | -0.9 | ||
| 02 | Alcoholic Beverages and Tobacco | 5.188 | 5.188 | - | 114.8 | - | 1.8 | - | 1.8 | ||
| 03 | Clothing and Footwear | 4.357 | 4.276 | 0.082 | 84.5 | 103.1 | -0.9 | 1.2 | -0.9 | ||
| 04 | Housing, Water, Electricity, Gas and Other Fuels | 15.237 | 1.423 | 13.814 | 82.1 | 100.8 | -6.7 | -0.9 | -1.5 | ||
| 05 | Furnishings, Household Equipment and Routine Household Maintenance | 4.796 | 3.904 | 0.892 | 82.3 | 101.6 | -5.1 | 1.9 | -3.8 | ||
| 06 | Health | 2.832 | 0.993 | 1.838 | 100.4 | 103.7 | 0.2 | 2.1 | 1.4 | ||
| 07 | Transport | 13.546 | 8.322 | 5.224 | 86.2 | 122.5 | -7.3 | -0.4 | -4.6 | ||
| 08 | Communications | 3.234 | 0.123 | 3.111 | 53.5 | 93.1 | -16.5 | -2.5 | -3.0 | ||
| 09 | Recreation and Culture | 7.470 | 3.451 | 4.019 | 86.9 | 108.1 | -4.3 | 1.8 | -1.0 | ||
| 10 | Education | 2.681 | - | 2.681 | - | 119.4 | - | 3.8 | 3.8 | ||
| 11 | Restaurants and Hotels | 17.637 | - | 17.637 | - | 111.8 | - | 2.5 | 2.5 | ||
| 12 | Miscellaneous Goods & Services | 11.833 | 2.994 | 8.839 | 82.7 | 130.9 | -4.5 | 8.4 | 5.1 | ||
| ALL ITEMS | 100.000 | 41.863 | 58.137 | 91.4 | 111.1 | -3.1 | 2.1 | -0.1 | |||
| Table 17 Contributions to the change in the All Items CPI - August 2016 | |||||||
| COICOP Division | Percentage contributions | ||||||
| 1 month | 3 months | 12 months | |||||
| 01 | Food and Non-Alcoholic Beverages | 0.00 | -0.05 | -0.11 | |||
| 02 | Alcoholic Beverages and Tobacco | 0.00 | 0.02 | 0.09 | |||
| 03 | Clothing and Footwear | 0.19 | -0.19 | -0.04 | |||
| 04 | Housing, Water, Electricity, Gas and Other Fuels | -0.09 | -0.23 | -0.23 | |||
| 05 | Furnishings, Household Equipment and Routine Household Maintenance | 0.01 | -0.05 | -0.18 | |||
| 06 | Health | 0.00 | 0.01 | 0.04 | |||
| 07 | Transport | -0.24 | 0.45 | -0.62 | |||
| 08 | Communications | -0.04 | -0.05 | -0.10 | |||
| 09 | Recreation and Culture | -0.02 | -0.03 | -0.08 | |||
| 10 | Education | 0.00 | 0.00 | 0.10 | |||
| 11 | Restaurants and Hotels | 0.04 | 0.36 | 0.45 | |||
| 12 | Miscellaneous Goods and Services | -0.07 | -0.01 | 0.58 | |||
| All Items % change | -0.2 | 0.3 | -0.1 | ||||
| Goods | 0.01 | -0.47 | -1.29 | ||||
| Services | -0.22 | 0.69 | 1.19 | ||||
| Energy Products | -0.23 | -0.11 | -0.77 | ||||
| Tobacco | 0.00 | 0.02 | 0.18 | ||||
| Mortgage Interest | 0.00 | -0.05 | -0.25 | ||||
| Notes: For the percentage contributions, the sum of the 2-digit COICOP divisions may not equal the All Items % | |||||||
| change due to rounding differences. | |||||||
| Table 18 EU Harmonised Index of Consumer Prices (HICP) - Ireland | |||||||
| Period | HICP 2015=100 | Percentage changes | |||||
| Monthly index | Moving 12-month average index | 1 month | 12 months | Moving 12-month average | |||
| 2013 | January | 98.8 | 99.3 | -0.6 | 1.5 | 1.9 | |
| February | 99.6 | 99.4 | 0.8 | 1.2 | 1.9 | ||
| March | 100.0 | 99.5 | 0.4 | 0.6 | 1.8 | ||
| April | 99.9 | 99.5 | -0.1 | 0.5 | 1.7 | ||
| May | 99.8 | 99.6 | -0.1 | 0.4 | 1.5 | ||
| June | 99.9 | 99.6 | 0.1 | 0.7 | 1.4 | ||
| July | 99.9 | 99.7 | 0.0 | 0.8 | 1.3 | ||
| August | 100.0 | 99.7 | 0.1 | 0.1 | 1.1 | ||
| September | 99.9 | 99.7 | -0.1 | 0.0 | 0.9 | ||
| October | 99.7 | 99.7 | -0.2 | -0.1 | 0.7 | ||
| November | 99.6 | 99.7 | -0.1 | 0.3 | 0.6 | ||
| December | 99.7 | 99.7 | 0.1 | 0.3 | 0.5 | ||
| 2014 | January | 99.1 | 99.8 | -0.6 | 0.3 | 0.4 | |
| February | 99.7 | 99.8 | 0.6 | 0.1 | 0.3 | ||
| March | 100.2 | 99.8 | 0.5 | 0.2 | 0.3 | ||
| April | 100.2 | 99.8 | 0.0 | 0.3 | 0.3 | ||
| May | 100.2 | 99.8 | 0.0 | 0.4 | 0.3 | ||
| June | 100.4 | 99.9 | 0.2 | 0.5 | 0.3 | ||
| July | 100.3 | 99.9 | -0.1 | 0.4 | 0.2 | ||
| August | 100.6 | 100.0 | 0.3 | 0.6 | 0.3 | ||
| September | 100.4 | 100.0 | -0.2 | 0.5 | 0.3 | ||
| October | 100.1 | 100.0 | -0.3 | 0.4 | 0.4 | ||
| November | 99.8 | 100.1 | -0.3 | 0.2 | 0.4 | ||
| December | 99.4 | 100.0 | -0.4 | -0.3 | 0.3 | ||
| 2015 | January | 98.7 | 100.0 | -0.7 | -0.4 | 0.2 | |
| February | 99.3 | 100.0 | 0.6 | -0.4 | 0.2 | ||
| March | 100.0 | 100.0 | 0.7 | -0.2 | 0.2 | ||
| April | 99.9 | 99.9 | -0.1 | -0.3 | 0.1 | ||
| May | 100.4 | 99.9 | 0.5 | 0.2 | 0.1 | ||
| June | 100.8 | 100.0 | 0.4 | 0.4 | 0.1 | ||
| July | 100.5 | 100.0 | -0.3 | 0.2 | 0.1 | ||
| August | 100.8 | 100.0 | 0.3 | 0.2 | 0.0 | ||
| September | 100.3 | 100.0 | -0.5 | -0.1 | 0.0 | ||
| October | 100.0 | 100.0 | -0.3 | -0.1 | 0.0 | ||
| November | 99.7 | 100.0 | -0.3 | -0.1 | -0.1 | ||
| December | 99.6 | 100.0 | -0.1 | 0.2 | 0.0 | ||
| 2016 | January | 98.7 | 100.0 | -0.9 | 0.0 | 0.0 | |
| February | 99.1 | 100.0 | 0.4 | -0.2 | 0.0 | ||
| March | 99.4 | 99.9 | 0.3 | -0.6 | 0.0 | ||
| April | 99.7 | 99.9 | 0.3 | -0.2 | 0.0 | ||
| May | 100.2 | 99.9 | 0.5 | -0.2 | 0.0 | ||
| June | 100.9 | 99.9 | 0.7 | 0.1 | -0.1 | ||
| July | 100.6 | 99.9 | -0.3 | 0.1 | -0.1 | ||
| August | 100.4 | 99.9 | -0.2 | -0.4 | -0.1 | ||
| Table 19 EU Harmonised Consumer Price COICOP Division Indices - August 2016 Ireland | |||||||||||
| COICOP Division | HICP | Percentage changes | Percentage contributions | ||||||||
| Year 2015=100 | 1 month | 12 months | 1 month | 12 months | |||||||
| 01 | Food and Non-Alcoholic Beverages | 98.7 | 0.0 | -1.0 | 0.01 | -0.12 | |||||
| 02 | Alcoholic Beverages and Tobacco | 101.4 | 0.0 | 1.8 | 0.00 | 0.10 | |||||
| 03 | Clothing and Footwear | 96.5 | 4.8 | -0.9 | 0.20 | -0.05 | |||||
| 04 | Housing, Water, Electricity, Gas and Other Fuels | 100.4 | -0.8 | 0.1 | -0.10 | 0.02 | |||||
| 05 | Furnishings, Household Equipment and Routine Household Maintenance | 96.3 | 0.3 | -3.8 | 0.01 | -0.19 | |||||
| 06 | Health | 100.9 | 0.0 | 0.7 | 0.00 | 0.04 | |||||
| 07 | Transport | 99.5 | -1.8 | -5.0 | -0.26 | -0.67 | |||||
| 08 | Communications | 97.6 | -1.4 | -3.0 | -0.05 | -0.10 | |||||
| 09 | Recreation and Culture | 99.2 | -0.3 | -1.0 | -0.02 | -0.08 | |||||
| 10 | Education | 102.9 | 0.0 | 3.8 | 0.00 | 0.11 | |||||
| 11 | Restaurants and Hotels | 104.2 | 0.3 | 2.6 | 0.05 | 0.49 | |||||
| 12 | Miscellaneous Goods and Services | 100.7 | -0.4 | 0.6 | -0.03 | 0.04 | |||||
| All Items HICP | 100.4 | -0.2 | -0.4 | -0.2 | -0.4 | ||||||
| Notes: For the percentage contributions, the sum of the 2-digit COICOP divisions may not equal the All Items HICP due to rounding differences. | |||||||||||
Consumer Price Index
Definition
The Consumer Price Index is designed to measure the change in the average level of prices (inclusive of all indirect taxes) paid for consumer goods and services by all private and institutional households in the country and by foreign tourists holidaying in Ireland.
Consumer Price Index (CPI)
Approximately 53,000 prices are collected for a representative basket consisting of 634 item headings in a fixed panel of retail and service outlets throughout the country during the week containing the second Tuesday of each month up to and including the third Tuesday of each month. The dates to which the August index relates are Monday, 8th to Tuesday, 16th August 2016.
Scope of the Index
Price Collection
Personal visits are made to retail outlets by some 80 price collectors on a monthly basis. Approximately 50,000 price quotations are gathered in this way. In addition, 128 special inquiries covering items such as utility charges and services are conducted by post, telephone and e-mail in conjunction with internet price collection. Most prices are collected monthly, some quarterly and others annually. The CSO supplies general specifications to price collectors and price collectors are free initially to select a brand and in certain cases, size. This allows for a wide variety of different brands of the same item to be priced throughout the country. Once selected, the same item/brand is priced on a monthly basis in order to ensure matched price quotations. If an item disappears, substitution can occur but that price is excluded until matched prices are available for the same comparable item for two consecutive months. The CSO wishes to put on record its appreciation of the co-operation and assistance it receives from retail outlets and other business concerns.
Classification
The classification used in the CPI is based on a version of the Classification of Individual Consumption by Purpose Adapted to the Needs of Harmonised Indices of Consumer Prices (2000) (COICOP). This replaced the former national classification which was used up to December 2001. The COICOP classification breaks consumer expenditure into twelve different divisions covering a comprehensive range of consumer goods and services.
Annual Update of CPI Weights
For 2016, the CPI COICOP class (4-digit) level weights were updated with a reference period of December 2015. The weights were based primarily on the 2014 National Accounts Household Final Monetary Consumption Expenditure (HFMCE) data. The expenditure data were price updated at CPI COICOP class level to December 2015 using the price movement of the corresponding CPI COICOP class indices.
CPI Item Weights
The CPI measures in index form the monthly changes in the cost of purchasing a fixed representative ‘basket’ of consumer goods and services (i.e. Laspeyres formula). Identical items are priced in the same outlet on each occasion so that changes in the cost of this constant basket reflect only pure price changes. The current basket of goods and services consists of 634 representative items which were predominantly selected as part of the December 2011 rebase. The exception was two new items, water supply and sewage collection, which were introduced in January 2015. The representative share of each item in the basket is proportional to the average amount purchased by all households in the State and foreign tourists in Ireland based primarily on the 2009/2010 Household Budget Survey (HBS) and estimates of expenditure by foreign tourists across a range of consumer goods and services. When the new COICOP class (4-digit) level weights were introduced with the January 2013 index, the CPI item weights were also updated. The CPI item weights were calculated on a pro rata basis using proportions from the December 2011 rebase. A similar approach was taken when updating the 2016 item weights.
Methodological Details
A full methodological description of the new series is available in the Consumer Price Index Introduction of Updated Series (Base: December 2011=100) which is published on the CSO website.
Rebase
The index has been rebased with effect from December 2011, the eleventh series since the foundation of the State.
The rebase of the current CPI resulted in a number of methodological changes:
Goods and Services
Goods
Goods are defined as non service items usually purchased and transportable from a retail outlet.
Services
Services include the following: rents, mortgage interest, services for the maintenance & repair of the dwelling, water supply & miscellaneous services relating to the dwelling, electricity, gas, repair of household appliances, tool hire, domestic services & household services, out-patient services, hospital services, maintenance/repair and other services in respect of personal transport equipment, transport services, postal services, telephone & telefax services, repair of audio-visual, photographic & information processing equipment, veterinary & other services for pets, recreational & cultural services, package holidays, education, catering services, accommodation services, hairdressing salons & personal grooming establishments, social protection, insurance, financial services n.e.c. and other services n.e.c.
Utilities and Local Charges
Includes electricity, natural gas, refuse collection, sewage collection, water supply and telephone services – landline.
Mortgage Interest and the Local Property Tax in the CPI
Mortgage interest was first included in the CPI at the November 1975 rebase. The use of mortgage interest in the CPI reflects a user-cost approach to measuring owner-occupied housing. This approach has involved measuring changes in average mortgage interest costs over time. The household charge was introduced to the CPI in April 2012 and subsequently became the local property tax in July 2013. The local property tax is included in the basket under the item 'miscellaneous goods and services', which is part of COICOP 12.7.0. The inclusion of the local property tax is consistent with the user-cost approach utilised for owner-occupied housing. In the interest of transparency, an index excluding both mortgage interest and the local property tax is provided in Table 2 of the release to allow for their impact in the CPI to be seen.
Mortgage interest and the local property tax are excluded from the HICP.
Water supply and sewage collection charges
Water supply and sewage collection charges were introduced in Ireland on 1 January 2015. The coverage of the CPI/HICP is defined as those goods and services purchased by households for the purposes of consumption. This definition required the incorporation of the new charges into the CPI/HICP. Water supply and sewage collection charges are a component of group 04.4 Water supply & miscellaneous services relating to the dwelling of the COICOP consumption classification. Water supply and sewage collection charges were suspended for a period of nine months from 1st July 2016.
For a full discussion on the rationale and methodology for introducing water supply and sewage collecion charges into the CPI/HICP, see the relevant CPI Technical Paper.
Harmonised Indices of Consumer Prices
Introduction
The European Union-Harmonised Indices of Consumer Prices (EU-HICP) is calculated in each Member State of the EU. The purpose of this index is to allow the comparison of consumer price trends in the different Member States.
Comparison with CPI
The methodology now adopted for the construction of the national CPI is identical to that recommended for the HICP. Thus the two indices only differ in respect of the coverage of certain goods and services and the treatment of insurance. The current EU reference base period (Year 2005=100) is however retained for ease of comparison with other EU countries.
Excluded Items
The following items, constituting approximately 8.1% of the Irish CPI expenditure weighting, are excluded from the HICP:
Annual Update of HICP Weights
For 2016, the CPI COICOP class (4-digit) level weights were updated with a reference period of December 2015. The weights were based primarily on the 2014 HFMCE data. The expenditure data were price updated at HICP COICOP class level to December 2015 using the price movement of the corresponding HICP COICOP class indices.
Monetary Union Index of Consumer Prices (MUICP)
Euro area inflation is measured by the MUICP (‘Monetary Union Index of Consumer Prices’ as defined in Council Regulation (EC) No 2494/95 of 23 October 1995) which is the official euro area aggregate. The MUICP is calculated as a weighted average of HICPs of the 18 countries in the euro area. Country weights are computed every year reflecting the country’s share of the household final monetary consumption expenditure in the euro area total.
Classification System
The coverage of the indices is based on the international classification system, Classification of Individual Consumption by Purpose Adapted to the Needs of Harmonised Indices of Consumer Prices (2000) (COICOP).
COICOP
Prior to the introduction of the December 2001 based series in January 2002 the CPI used a national classification while the EU Harmonised Indices of Consumer Prices (HICP) used COICOP. To ensure greater comparability CPI and the HICP have both used the COICOP since December 2001.
The COICOP classification is based on 12 divisions:
01 Food and Non Alcoholic Beverages
Includes food and non alcoholic beverages purchased in supermarkets, small shops, speciality shops and petrol station forecourt outlets. It excludes meals out which are covered under 11 Restaurants and Hotels.
02 Alcoholic Beverages and Tobacco
Includes alcoholic beverages purchased in off licences and supermarkets but excludes alcohol consumed on or within licensed premises which is classified under 11 Restaurants and Hotels. It also includes tobacco products.
03 Clothing and Footwear
Mens, ladies and childrens clothing and footwear, sports and leisurewear and services such as laundry and dry cleaning, shoe repair, dress hire and alteration.
04 Housing, Water, Electricity, Gas and Other Fuels
Covers rents, mortgage interest repayments, refuse collection, goods and services for maintaining, decorating and repairing dwellings and domestic energy products such as electricity, gas, home heating oil and solid fuels. Water supply and sewage collection were added to this division under the item 'water supply and miscellaneous services relating to the dwelling' in January 2015.
05 Furnishings, Household Equipment and Routine Household Maintenance
Covers household items such as furniture, carpets and other floor coverings, household textiles and soft furnishings, household appliances and other household items such as utensils, tools, garden equipment and non-durable items for cleaning, washing and other day to day household activity. Also included are services such as electrical repair, cleaning and gardening.
06 Health
Includes medical products, appliances and equipment, hospital charges and out patient services supplied by doctors, dentists, opticians, physiotherapists and practitioners of alternative and complimentary medicine.
07 Transport
Includes the purchase of new and second hand vehicles, spare parts, car maintenance, fuels and lubricants, public transport and services such as parking, motor association subscriptions, car wash, toll charges, driving lessons, driving test, driving licence and car hire.
08 Communications
Postal and telecommunications services.
09 Recreation and Culture
Includes items such as audio visual and photographic equipment, computers, music and DVDs, sports and recreation goods, games and toys, items connected with gardening and pets, recreational, sporting and cultural activities and events, newspapers and other reading material, package holidays and other items connected with recreation and culture.
10 Education
Includes pre-primary and primary, secondary, third level fees and other education and training such as night courses and examination fees.
11 Restaurants and Hotels
Includes meals in restaurants and hotels, fast food and takeaways, cafes and canteens; alcohol consumed on or within a licensed premises and accommodation services supplied by hotels, guesthouses and hostels.
12 Miscellaneous Goods and Services
Covers a wide range of items including hairdressing and other grooming; goods for hygiene, hair and body care; personal goods such as jewellery, handbags and wallets; childcare and other social protection services; insurance, financial services and other services including funerals, weddings, legal and professional services. The household charge was added to this division, in the CPI, under the item 'miscellaneous goods and services' in April 2012. The household charge subsequently became the local property tax in July 2013. The local property tax is not included in the HICP.
Calculating percentage changes in the index
The movement of the CPI, HICP and their subindices are expressed as percentage changes, rather than changes in index points, because index point changes are affected by the level of the index in relation to its base period, whereas percentage changes are not. The example below illustrates the computation of index point and percentage changes.
| Index point change | |
| Current index | 106.7 |
| Less previous index | 103.7 |
| Equals index point change | 3.0 |
| Percentage change | |
| Index point change | 3.0 |
| Divided by the previous index | 103.7 |
| Equals | 0.0289 |
| Result multiplied by 100 | 0.0289 x 100 |
| Equals percentage change | 2.9 |
Estimating Contributions
A contribution represents the amount of the overall percentage change in the All Items CPI which is accounted for by any given category. It can be estimated for any category in the CPI (e.g. the twelve COICOP 2-digit divisions) and for any period of time.
Data Required:
Example:
To estimate the contribution of Food & Non-Alcoholic Beverages (COICOP 01) to the overall annual percentage change in the CPI up to July 2006 you would need the following data
| 1 | Base weight for COICOP 01 (base:December 2001=100) | 14.092% |
| 2 | Current Index (i.e. July 2006) for COICOP 01 | 103.7 |
| 3 | Previous Index (i.e. July 2005) for COICOP 01 | 102.1 |
| 4 | All Items CPI for the previous period (i.e. July 2005) | 111.3 |
Steps in the calculation
| Step 1 | Multiply the base weight by the current index | 14.092 x 103.7 |
| Equals (1) | 1461.3404 | |
| Step 2 | Multiply the base weight by the previous index | 14.092 x 102.1 |
| Equals (2) | 1438.7932 | |
| Step 3 | Subtract figure (2) from figure (1) | 1461.3404 - 1438.7932 |
| Equals (3) | 22.5472 | |
| Step 4 | Divide figure (3) by the All Items CPI for the previous period | 22.5472 / 111.3 |
| Equals Contribution | 0.20 |
Therefore your estimated contribution of Food & Non-Alcoholic Beverages to the percentage change in the CPI for the year to July 2006 is 0.20. The actual published figure was 0.19. The difference is due to the fact that actual published contributions are calculated using data to more decimal places.
It is more complicated to estimate contributions where more than one base period is involved, as the base weights will have changed (e.g. to estimate a contribution for the period January 2000 to January 2005 involves the November 1996=100 base and the December 2001=100 base). For assistance in this regard please contact the CPI section.
Data Dissemination on www.cso.ie
The CSO website (www.cso.ie) now holds a range of CPI data. Within the Consumer Prices section of the website (accessed via the ‘Prices’ link on the homepage), a range of principle statistics are held including overall annual percentage changes from 1977 to date, All Items CPI annual figures from 1996 to date and COICOP division monthly and annual figures from 2002 to date.
Further data can be accessed at www.cso.ie by clicking on ‘Databases’ and ‘Statbank CSO Main Data Dissemination Service’. The subject area is ‘Economy’, ‘Prices’, ‘Consumer Prices’ and ‘Consumer Prices - Annual Series’ or ‘Consumer Prices - Monthly Series’. The website is updated each month at 11am on the CPI publication day.
The Database Direct for the CPI contains monthly and annual index numbers and percentage changes for the following categories and time periods:
| Category | Period |
| All Items CPI | 1975 to date |
| 12 COICOP Divisions | 1975 to date |
|
Special CPI Subindices (CPI excluding Tobacco, Energy Products, etc) |
1982 to date |
| Harmonised Indices of Consumer Prices (HICP) | 1997 to date |
In addition, the following data can also be accessed within Database Direct.
Any queries relating to the usage of the web dissemination database for CPI data should be directed to cpi@cso.ie
 Hide Background Notes
Scan the QR code below to view this release online or go to
http://www.cso.ie/en/releasesandpublications/er/cpi/consumerpriceindexaugust2016/
 Show Table 1 Consumer Price Index (All Items)
 Hide Table 1 Consumer Price Index (All Items)