
| Census of Industrial Production (CIP) - Industrial Enterprises 2008-2014 | |||||||||
| % change | |||||||||
| 2008 | 2009 | 2010 | 2011 | 2012 | 2013 | 2014 | 2008 - 2014 | 2013 - 2014 | |
| Industrial Enterprises (Number) | 15,955 | 16,285 | 16,050 | 16,132 | 16,385 | 16,540 | 16,497 | 3.4 | -0.3 |
| Persons engaged (Number) | 240,946 | 218,279 | 202,301 | 201,695 | 199,193 | 200,991 | 210,545 | -12.6 | 4.8 |
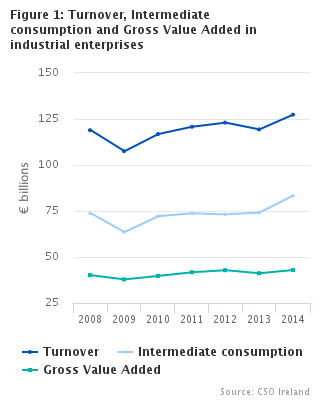
| Turnover (€ million) | 118,919 | 107,499 | 116,815 | 120,772 | 123,020 | 119,345 | 127,366 | 7.1 | 6.7 |
| Intermediate consumption (€ million) | 73,757 | 63,545 | 72,195 | 73,750 | 73,159 | 74,153 | 83,358 | 13.0 | 12.4 |
| Gross Value Added (€ million) | 40,137 | 37,826 | 39,714 | 41,701 | 42,828 | 41,165 | 42,920 | 6.9 | 4.3 |
This release provides data on the Industrial sector in Ireland for the period 2008 - 2014. Revised figures for 2008 - 2012 are included, along with newly published figures for 2013 and 2014. The detailed tables present a breakdown of the numbers of active industrial enterprises, numbers of persons engaged in industrial sectors, as well as a range of financial information classified by: economic activity, employment size and nationality.
The Industry series 2008 - 2012 has been revised due to a number of factors:
(i)There are now more active enterprises on the CSO Business Register. There are now more enterprises considered active in the Industrial sector per the CSO Business Register. These enterprises need to be measured. What is considered an active enterprise per the register of active enterprises in Ireland will determine its inclusion in the Industry series. Size class thresholds will no longer be applied. For example, the Industry series previously didn't estimate for enterprises employing less than 3 persons engaged, but will do so now.
(ii) Updates in the National Accounts series. Under rules for the compilation of EU National Accounts (ESA 2010) a number of data series have been updated. For the Industry series, this principally concerns our estimates for Research & Development (R&D). Estimates of R&D spend are now higher, and more of this R&D spend is being capitalised. This has the effect of increasing the estimate of Industrial Gross Value Added (GVA).
(iii) Non-response treatment & the greater use of administrative data. As part of the methodological review we have examined our methodology for non-respondents. We have aligned our non-response methodology more closely to the use of available administrative (tax) data and changed how we estimate for non-response. These new estimates for non-response are now incorporated into the Industry series, replacing the previous imputation methodology.
(iv) Other adjustments. During the review, the opportunity was taken to update the series for some sectoral NACE adjustments (enterprises being reclassified from one particular NACE sector to another), and updates to some Multinational Enterprise data measured by our National Accounts Large Cases Unit are also incorporated.
Main differences following revisions
Impact on number of enterprises & employment
As a result of incorporating the above revisions, more enterprises are now being measured for the industrial sector in Ireland. The original series measured around 4,500 enterprises. The revised series measures approximately 16,000 enterprises. This increase is mainly due to the removal of the size class threshold, which excluded industrial enterprises which employed less than 3 persons. See Figure 2.
| Original Series | Revised Series | |
| 2008 | 5589 | 15955 |
| 2009 | 5029 | 16285 |
| 2010 | 4792 | 16050 |
| 2011 | 5133 | 16132 |
| 2012 | 4580 | 16385 |
| 2013 | 4644 | 16540 |
| 2014 | 4763 | 16497 |
The impact of counting these new enterprises on employment levels in Industry is far less however, as most industrial employment is concentrated in enterprises employing more than 3 persons. Accordingly, the new estimates for industrial employment levels are around only 10% higher than the original series, despite the very large increase in the number of enterprises. See Figure 3.
The increase in employment is heavily concentrated in the Irish Small & Medium Enterprises (SME) sector. For example, for reference year 2012, of the 19,695 additional persons engaged in manufacturing enterprises, 17,898 or 91% are employed by Irish SMEs. See Table 1.
| Original Series | Revised Series | |
| 2008 | 216156 | 240946 |
| 2009 | 195542 | 218279 |
| 2010 | 185183 | 202301 |
| 2011 | 188684 | 201695 |
| 2012 | 178652 | 199193 |
| 2013 | 182287 | 200991 |
| 2014 | 184518 | 210545 |
Impact on Industrial & Manufacturing Gross Value Added
Updating the industrial series for the methodological improvements referenced above (in particular counting more enterprises and the positive impact of certain R&D capitalisation on GVA levels) , results in higher estimates for GVA – an increase in the range of 9-15% depending on the year. See Figure 4.
Taking reference year 2012 as an example, we can see the increase in the number of enterprises, particularly Irish owned enterprises. However, this increase in the number of enterprises is quite negligible in terms of the size class and nationality distribution of the value added of the manufacturing sector in Ireland.
For the original GVA series, the split between Irish and foreign owned manufacturing enterprises was 85/15 with foreign owned enterprises generating the vast majority of Manufacturing GVA. In the revised series, despite adding in excess of 11,800 enterprises and 20,000 persons engaged, the large majority of which were Irish owned enterprises, the split for GVA has increased slightly in favour of foreign owned enterprises (86/14). Later sections in the release explore these themes further.
| Original Series | Revised Series | |
| 2008 | 35.9 | 40.1 |
| 2009 | 33.7 | 37.8 |
| 2010 | 34.7 | 39.7 |
| 2011 | 38.2 | 41.7 |
| 2012 | 39.4 | 42.8 |
| 2013 | 36.3 | 41.2 |
| 2014 | 37.2 | 42.9 |
Industrial sector in Ireland 2008-2014 - main trends
Industrial sector in Ireland, year on year changes 2013-2014
In 2014, there was an annual increase in GVA of 4.3% from €41.2bn in 2013 to €42.9bn. The year on year change in industrial turnover was higher at 6.7%, up from €119.3bn in 2013 to €127.4bn in 2014. While the number of industrial enterprises was down marginally from 16,540 in 2013 to 16,497 in 2014, the number of persons engaged in these industrial enterprises rose 4.8% from 200,991 to 210,545. See Headline Table.
In the original series, the split between persons engaged in Irish and Foreign owned manufacturing enterprises was 50/50. However, in the new series the split is 56/44 with Irish owned enterprises now having the greater proportion of persons engaged.
Sectoral composition analysis
| Percentage GVA | |
| Mining and quarrying (05-09) | 1.5 |
| Food and beverages (10-11) | 15.5 |
| Chemicals and pharmaceuticals (20-21) | 36.2 |
| Computer, electronic, optical and electrical equipment (26-27) | 12.9 |
| Electricity, gas, water and waste management (35-39) | 8.6 |
| Other manufacturing sectors (12-19, 22-25, 28-33) | 25.3 |
| Percentage GVA | |
| Mining and quarrying (05-09) | 1.2 |
| Food and beverages (10-11) | 21.6 |
| Chemicals and pharmaceuticals (20-21) | 37 |
| Computer, electronic, optical and electrical equipment (26-27) | 7 |
| Electricity, gas, water and waste management (35-39) | 9.6 |
| Other manufacturing sectors (12-19, 22-25, 28-33) | 23.6 |
| Small and medium enterprises | Large enterprises | |
| 2008 | 16.7 | 23.5 |
| 2009 | 13.6 | 24.2 |
| 2010 | 14.7 | 25 |
| 2011 | 16.3 | 25.4 |
| 2012 | 13.4 | 29.5 |
| 2013 | 16.8 | 24.4 |
| 2014 | 12.6 | 30.4 |
GVA by enterprise size class
| Small and medium enterprises | Large enterprises | |
| 2008 | 140420 | 100526 |
| 2009 | 125217 | 93062 |
| 2010 | 115052 | 87249 |
| 2011 | 113755 | 87940 |
| 2012 | 110628 | 88565 |
| 2013 | 109688 | 91303 |
| 2014 | 114642 | 95903 |
Persons engaged by enterprise size class
| Irish owned | Foreign owned | |
| 2008 | 8.6 | 27.5 |
| 2009 | 7.5 | 26.1 |
| 2010 | 6.7 | 28.9 |
| 2011 | 6.2 | 31.1 |
| 2012 | 5.6 | 32.7 |
| 2013 | 6.6 | 30.1 |
| 2014 | 7.8 | 30.5 |
GVA by enterprise nationality of ownership
| Irish owned | Foreign owned | |
| 2008 | 126356 | 92436 |
| 2009 | 110254 | 83918 |
| 2010 | 101431 | 80180 |
| 2011 | 101127 | 79923 |
| 2012 | 99988 | 78712 |
| 2013 | 103967 | 77124 |
| 2014 | 109959 | 80007 |
Persons engaged in manufacturing by nationality of ownership
Please note: Additional sectoral analysis for Industry in Ireland, including international comparisons, will be available in the Business in Ireland publication. This is due to be published by the end of November 2016.
| Table1: Persons engaged and Gross Value Added for Manufacturing Enterprises (Nace 10-33), 2012 | ||||||
| Persons engaged | Gross Value Added (GVA) | |||||
| 2012 | 20121 | 2012 | 20121 | |||
| Irish Large | 18,294 | 20,727 | 1,272,048,000 | 838,185,271 | ||
| Irish SME | 61,363 | 79,261 | 3,722,016,000 | 4,729,157,971 | ||
| Foreign Large | 56,006 | 55,778 | 24,432,394,000 | 25,069,239,397 | ||
| Foreign SME | 23,342 | 22,934 | 5,528,700,000 | 7,587,294,830 | ||
| 1 Figures revised for 2012 | ||||||
The Census of Industrial Production comprises two separate but closely related annual inquiries, namely:
(i) the Census of Industrial Enterprises covers those enterprises which are wholly or primarily engaged in industrial; published 27th October, 2016.
(ii) the Census of Industrial Local Units which covers all industrial local. To be published at a later date.
The Census of Industrial Production is required under Council Regulation (EC, Euratom) No 295/2008. The 2014 Census was taken in accordance with SI 44/2013.
NACE refers to the classification NACE Revision 2 which is the European Union’s Statistical Classification of Economic Activity in the European communities
For further information on the NACE Rev. 2 classification of industrial activity, visit the CSO website:
http://www.cso.ie/en/surveysandmethodology/classifications/
An enterprise is defined as the smallest combination of legal units that is an organisational unit producing goods or services, which benefits from a certain degree of autonomy in decision making, especially for the allocation of its current resources. A local unit is defined as an enterprise or part thereof situated in a geographically identified place.
Appreciation is extended to firms that co-operate in this annual Census. The information they provide is treated as strictly confidential to the Central Statistics Office. Direct or indirect disclosure of information relating to individual respondents is avoided in the publication of results by applying confidentiality checks to categories containing small numbers of units and suppressing figures, etc.
Presentation of Results
All tables are available on the Central Statistics Office website, please see
Enterprises Industrial = Click here
Enterprises Manufacturing = Click here
Period Covered by the Census
Although the Census relates in principle to the calendar year, respondents are permitted to return figures for their nearest accounting year. The end of the accounting year for all returns used falls between May of the reference year and April of the following year. Returns which cover a period of less than 12 months are accepted in cases where businesses have started or ceased trading during the year.
All employment details in the 2014 Census relate to the week ending 12th September 2014. Concerns that had no persons engaged in this week (e.g. ceased operations earlier in the year or started production later in the year) were classified as having zero employment. In tables which analyse local units in terms of persons engaged, these are included in the lowest size class, e.g. less than ten persons engaged.
Data Collection
The Census is conducted by post and via e-forms. A permanent up-to-date register is kept of all relevant local units and enterprises known to be involved in industrial production. The register is maintained from the Central Business Register, administrative and public utility records, announcements in the press, business journals, field personnel contacts, etc. This register is constantly being updated. This results in differing estimates for the total number of enterprises/local units through the dissemination cycle.
An ‘enterprise’ questionnaire is sent to all enterprises whose activity is primarily industrial. The type of ‘enterprise’ questionnaire depends on the size of the enterprise. The most detailed form (form F) is generally sent to all enterprises with twenty or more persons engaged. A less detailed form (form C) is sent to enterprises with between three and twenty persons engaged. Enterprises with less than 3 persons engaged do not receive a survey form, but administrative data is used to estimate for such enterprises. In previous years the cut-off point was thirteen persons engaged. In the case of multi-location enterprises, a ‘local unit’ questionnaire is sent to each local unit with three or more persons engaged which was in production during the year. For the majority of local units, this questionnaire is the standard form L. In a small number of exceptional cases, a single form L is issued to cover several local units operated by the same enterprise - see Scope of the Local Unit Census below.
All forms are available on CSO’s website: Click here
In relation to local units involved in NACE Division 36 (Water collection, treatment and supply) a W form is used. This reflects the difference in activity type of these firms.
All returns are scrutinised clerically for internal accuracy. They are compared with returns for previous years and in some instances with returns to other industrial inquiries. Local unit and enterprise returns relating to the same enterprise are examined together for consistency. A further set of consistency checks is carried out in the computer processing of the data. Substantial queries arising from these scrutiny operations are referred to the respondent by telephone or in writing.
Industrial Activity Classification and Statistical Units
The 2014 results are classified by NACE Revision 2, which was first introduced for reference year 2008. A correlation table showing the relationship between headings of the old and new classifications is available on request. Each 4 digit class in NACE Revision 2 relates to a specific form of economic activity, eg manufacture of basic pharmaceuticals products (NACE 2110). The statistical units in the Census (local unit and enterprise) are coded to the NACE class relating to their principal industrial activity during the Census year. In the case of local units, this is determined on the basis of detailed information provided on their production of individual products. The activity classification of enterprises is based on the NACE codes of the constituent local units. An enterprise that operates several industrial local units coded to different NACE classes is classified to the activity which accounts for the highest proportion of the total value added of the enterprise.
The scope of the Census extends to NACE sections B, C, D and E, namely:
Section B: Mining and quarrying
Section C: Manufacturing
Section D: Electricity, gas, steam and air conditioning supply
Section E: Water supply; sewerage, waste management and remediation activities
The traditional category Transportable Goods Industries used in industrial statistics is equivalent to NACE sections B and C. The Manufacturing Industries grouping includes only section C.
The classification is determined by the nationality of the owners of 50 per cent or more of the share capital. The breakdown which can be provided at sectoral level is in many cases constrained by the need to preserve the confidentiality of data provided by individual units. For total manufacturing industry, however, a more detailed nationality classification is possible.
Export Performance and the Purchase of Imported Materials
Details are provided on value of output of industrial local units which was exported and the proportion of materials purchased which were imported. The proportions of exports destined for four major markets are also given. These results are presented classified by major industrial sectors, NUTS 2 regions classified by major industrial sector and local units classified by nationality of ownership and number of persons engaged.
These analyses are based on respondents’ replies to questions asking the value of production (or turnover) which was exported and the breakdown by destination, as well as the value of materials purchased which was imported. It must be recognised in interpreting these results that this is information that is not readily available in standard business accounts, particularly in relation to the origin of materials purchased from suppliers.
Scope and Coverage
The enterprise Census covers all enterprises which are wholly or principally involved in industrial production (i.e. NACE Sections B to E).
An enterprise is defined as the smallest combination of legal units that is an organisational unit producing goods or services, which benefits from a certain degree of autonomy in decision making, especially for the allocation of its current resources (e.g. company, partnership, individual proprietorship, etc.). An enterprise may be a sole legal unit. In practice, the enterprise is equivalent to a company or firm. Within a group of companies, each individual company is treated as a separate enterprise. The return for each enterprise relates to all of its activities and covers all local units operated by it, including those involved in non-industrial activity, e.g. wholesaling or retailing.
Estimation for Non-Respondents
If information for key non-respondents is available from an alternative source, for example, Monthly Production, Quarterly Statistics or Prodcom or a return for the previous year, then the record is manually estimated; otherwise administrative data is used in conjunction with ratio extensions. Ratio extension involves the application of ratios between known variables to cases where only one subcomponent is known. The ratios are typically calculated at NACE class level before being applied, although some merging of NACE classes may take place in order to ensure that the ratio estimates are not based on very small populations.
Full data for enterprises filling in the more restricted C forms is derived using the ratio extension method also. All non-key non-respondents are estimated for using administrative data and ratio extensions.
Enterprise Results for 2014
In 2014 there were 16,497 enterprises known to the CSO to be involved wholly or primarily in industrial production (NACE Sections B, C, D and E). Their total turnover was €127,366 million and purchases of goods and services amounted to €89,359 million. Total gross value added was €42,920 million. The total number of persons engaged in these enterprises (excluding outside piece-workers) in September 2014 was 210,545; labour costs in the year amounted to €10,991 million, of which wages and salaries accounted for €9,620 million.
67% of industrial turnover is classified to the following four NACE classes.
Scope and Coverage
The Census of industrial local units relates to all local units engaged in industrial activity. A local unit is defined as an enterprise or part thereof situated in a geographically identified place. The different geographical locations in which an enterprise conducts industrial activities are treated as separate local units. A separate return is sought for each industrial local unit. The extent to which separate returns are obtained in practice, however, depends on the availability of separate records in the business for the different local units.
If separate details are not available for multi-location enterprises then for those tables involving a classification of local units by size (e.g. number of persons engaged per local unit or gross output per local unit) or by location (county or region) the local units are classified as non-attributable.
Single local units are estimated at enterprise level while multiple local units attached to a single enterprise are estimated by using the enterprise return and apportioning accordingly relative to employment.
Coverage and Statistical Units
The results for industrial enterprises must be distinguished from the results for industrial local units. Despite the fact that, in the majority of cases, the local unit is equivalent to the enterprise, the use of two different units in the two Censuses has a number of consequences which must be borne in mind when interpreting and comparing their results, namely:
Variables
The local unit Census focuses on the industrial process, namely the utilisation of materials, industrial services and labour, and the value of goods produced during the year. The most important variables distinguished are, therefore, gross output, industrial input and net output. Gross output represents the selling value of goods actually produced in the year, as reported by the businesses themselves, irrespective of whether sold or put into stock. Industrial input is defined as the cost of materials, industrial services and fuel and power used in the year. Net output is gross output less industrial input.
The enterprise Census, on the other hand, relates to the trading dimension, namely turnover, purchases of materials and services and labour costs during the year. One of the main variables in this Census is, therefore, turnover, which represents the revenue received during the year. This can be compared with gross output by means of the derived variable production value. This variable approximates closely to the value of gross output of the industrial local units operated by the enterprises. The different treatment of excise duties and operating subsidies in the two Censuses makes comparison more difficult for the small number of industries affected by these factors.
The variable in the enterprise Census which approximates most closely to industrial input is intermediate consumption which is defined as the purchases of materials, industrial and non-industrial services and fuel and power less the rise (or plus the fall) during the year of stocks of materials and fuels. The main difference, therefore, is the inclusion of non-industrial services in intermediate consumption. In the enterprise Census gross value added (excluding VAT) is defined as production value less intermediate consumption; this is the closest approximation to net output as distinguished in the local unit Census.
 Hide Background Notes
Scan the QR code below to view this release online or go to
http://www.cso.ie/en/releasesandpublications/er/cip/censusofindustrialproductionenterprises2014/
 Show Persons engaged and Gross Value Added for Manufacturing Enterprises (Nace 10-33), 2012
 Hide Persons engaged and Gross Value Added for Manufacturing Enterprises (Nace 10-33), 2012