
| 2008 | 2009 | 2010 | 2011 | 2012 | 2013 | 2014 | % Change 2008-2014 | % Change 2013-2014 | |||||||
| Number of enterprises | 244,195 | 244,428 | 242,692 | 240,880 | 244,394 | 243,571 | 238,249 | -2.4% | -2.2% | ||||||
| Persons engaged | 1,511,920 | 1,345,461 | 1,270,475 | 1,259,326 | 1,264,769 | 1,288,017 | 1,334,291 | -11.8% | 3.6% | ||||||
| Enterprise births | 15,444 | 17,845 | 13,955 | 14,343 | 15,079 | 13,825 | 16,256 | 5.4% | 17.6% | ||||||
| Enterprise deaths | 19,157 | 19,242 | 17,022 | 15,177 | 16,199 | 20,080* | |||||||||
| *Enterprise deaths data for 2013 is preliminary as 2 years of inactivity are necessary to be declared a final death. | |||||||||||||||
This release provides data on the “Business Demography” of Ireland for the period 2008 - 2014. Revised figures for 2008 - 2012 are included in this release, along with newly published figures for 2013 and 2014. The detailed tables provided with this release present a breakdown of the numbers of active enterprises and newly birthed and ceased enterprises, classified by economic activity, employment size and legal form. Related employment numbers are also outlined. A detailed county level breakdown is also provided in relation to active enterprises and employment numbers only.
The Business Demography series 2008 - 2012 has been revised due to active enterprise definition changes1. The historic definition (used in the old series) of an active enterprise outlined that an enterprise was active if it either paid VAT, had employees, filed a Corporation Tax return or filed an Income Tax return for the reference year. This definition also allowed for national methods to apply when determining enterprise activity (if an enterprise was only active by virtue of activity on the Income Tax file, it would only be considered active if its turnover was greater than €50,000 in the year).
Over time, the application of historic rules and definitions has led to some enterprises being counted as active when they were not (over coverage on the Business Register) and some enterprises not being counted when they should have been (under coverage on the Business Register).
A new definition of what constitutes an active enterprise has recently been agreed at EU level and will likely achieve full legislative effect (via what is known as the FRIBS legislative package2) within a few years. This definition is a much clearer outline of what constitutes an active enterprise. An enterprise is considered to be active if:
"in a certain period it generates turnover, employs staff or makes investments in the period".
Introducing the new definition of what constitutes an active enterprise will result in an increased measure of the population of active enterprises in Ireland.
Main differences resulting from the new series
As a result of the implementation of the new enterprise definition, the number of enterprises in the private business economy3 in 2012 has increased from 185,530 in the old series to 244,394 in the new series, an increase of nearly 59,000 enterprises (latest figures available for the old series is 2012) . Almost 32,000 (or 54.2%) of the increase in enterprise numbers is directly attributable to Sector H "Transportation and Storage" (increase of 16,347 enterprises) and Sector F "Construction" (increase of 15,561 enterprises).
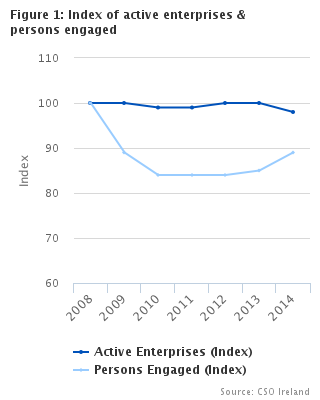
Under the new series, the impact of the definition changes has resulted in the number of active enterprises remaining relatively stable (-2.4%) while the number of persons engaged has decreased (-11.8%) over the course of the 2008 - 2014 reference period. Under the old series the number of active enterprises decreased by 14.2% in the 2008 - 2012 period (as opposed to a slight increase of 0.14% in the new series for the same period). In particular, the introduction of the new series is now reporting a much larger enterprise population in Sector F "Construction" which has increased significantly from the old series. The definition changes has resulted in a larger proportion of small enterprises now being captured, however these enterprises are not large employers and have not had as significant an impact on the number of persons engaged series. For example, for 2012, we can see that Sector F "Construction" has increased its number of persons engaged by 16.6% from the old series while the number of active enterprises has increased by over 46%.
Similar results can be seen for Sector H "Transportation and Storage" where the number of active enterprises has increased by over 160% (mainly attributable to Sector H49 "Land Transport") but the number of persons engaged has increased by just 20.9%. While the total number of active enterprises has remained relatively stable for the series 2008 - 2014, the number of persons engaged has decreased by 11.8% , see figures 2 & 3.
Demography birth and death figures amended December 2016 to reflect a slight re-classifcation, updated figures now included in this release.
| X-axis label | 2012 Old Series | 2012 New Series |
|---|---|---|
| Total Enterprises | 185530 | 244394 |
| Construction (F) | 33879 | 49530 |
| Transportation and storage (H) | 9937 | 26284 |
| X-axis label | 2012 Old Series | 2012 New Series |
|---|---|---|
| Total Enterprises | 1219854 | 1264769 |
| Construction (F) | 76602 | 89351 |
| Transportation and storage (H) | 75944 | 91852 |
Annual changes and sectoral composition
There were over 238,000 active enterprises in the private business economy in Ireland in 2014, with over 1.3 million persons engaged4. This compares to over 244,000 active enterprises and over 1.5 million persons engaged in 2008. The Services sector5 accounted for over half (51.3%) of all enterprises in 2014, with the Construction sector accounting for less than a fifth (19.9%). In 2008 the Services sector accounted for less than half (46.7%) while Construction accounted for over a quarter (25.3%) of all enterprises. See figures 4 & 5 and summary table.
| For long labels below use to display on multiple lines | Percentage of Enterprises by Sector 2014 |
|---|---|
| Services | 51.3 |
| Distribution | 19.1 |
| Industry | 6.9 |
| Construction | 19.9 |
| Financial Service Activities | 2.8 |
Looking at where persons engaged work in the Irish private business economy, we see a similar pattern emerging in the Services and Construction sectors. In 2014 the Services sector accounted for 44.3% of all persons engaged while in 2008 it accounted for 40%. Construction accounted for 7.5% of all persons engaged in 2014, down from 12.6% in 2008. See figures 6 & 7.
| For long labels below use to display on multiple lines | Percentage of Enterprises by Sector 2008 |
|---|---|
| Services | 46.7 |
| Distribution | 18.9 |
| Industry | 6.6 |
| Construction | 25.3 |
| Financial Service Activities | 2.4 |
| For long labels below use to display on multiple lines | Percentage of Persons Engaged by Sector 2012 |
|---|---|
| Services | 44.3 |
| Distribution | 25.2 |
| Industry | 15.8 |
| Construction | 7.5 |
| Financial Service Activities | 7.2 |
Size class composition of the business economy
Small and medium sized enterprises6 accounted for 99.8% of the total enterprise population for 2014. They also accounted for nearly 69% of total persons engaged, with large enterprises (employing 250 or more persons) employing over 31% of persons engaged, despite accounting for only a small fraction (0.2%) of total enterprise numbers. See figure 8. In 2008, small and medium sized enterprises also accounted for 99.8% of the total enterprise population while accounting for a higher percentage (71%) of total persons engaged than in 2014. Large enterprises in 2008 accounted for 0.2% of all enterprises while employing around 29% of persons engaged. See figure 9.
| For long labels below use to display on multiple lines | Percentage of Persons Engaged by Sector 2008 |
|---|---|
| Services | 40 |
| Distribution | 24.8 |
| Industry | 16 |
| Construction | 12.6 |
| Financial Service Activities | 6.6 |
| Enterprises | Persons Engaged | |
| Under 10 | 92.29 | 27.98 |
| 10-49 | 6.39 | 21.86 |
| 50-249 | 1.11 | 19.11 |
| 250 and over | 0.22 | 31.05 |
| Enterprises | Persons Engaged | |
| Under 10 | 90.92 | 28.09 |
| 10-49 | 7.63 | 23.66 |
| 50-249 | 1.24 | 19.32 |
| 250 and over | 0.22 | 28.93 |
Enterprise births and deaths
This Business Demography release relates to reference year 2014, however data on enterprise deaths7 are available up to reference year 2013 only due to the fact that two complete sets of yearly data is required for an enterprise to be declared a final enterprise death. All enterprise births8 were followed for 5 years (2009 to 2014) to assess their survival rate and the resulting effect on employment.
Over 29% of all enterprises that were active during 2014 began trading in the period 2009 – 2014 inclusive. The one year survival rate (relating to enterprises born in one year and still active in next year) decreased slightly from 2009 to 2014 from 86% in 2009 to 84.7% in 2014, and shows almost 85% of enterprises created in 2013 were still active in 2014. Of the 17,845 enterprises birthed in 2009, 10,958 or 61.4% survived to reference year 2014. See figure 10.
| X-axis label | Survived 1 yr | Survived 2 yrs | Survived 3 yrs | Survived 4 yrs | Survived 5 yrs |
|---|---|---|---|---|---|
| Year of Birth 2008 | 13286 | ||||
| Year of Birth 2009 | 15100 | 12113 | |||
| Year of Birth 2010 | 12181 | 13777 | 11132 | ||
| Year of Birth 2011 | 12970 | 11678 | 12922 | 10521 | |
| Year of Birth 2012 | 13256 | 11943 | 10775 | 12070 | 9994 |
| Year of Birth 2013 | 11708 | 11692 | 10720 | 9742 | 10958 |
There were 16,256 new enterprise births in 2014, an increase of nearly 18% on 2013. There were 19,382 persons engaged in these newly birthed enterprises. There were less enterprise births in 2008 (15,444) but a slightly higher number of persons engaged (22,872) in these newly birthed enterprises.
The number of births in Sector F “Construction” increased from 2,473 in 2013 to 3,526 in 2014 and is just below the highest number of births recorded in the reference period for Construction which occurred in 2009 (3,573).
A large decrease (30.8%) in the number of births was recorded in Sector B “Mining and Quarrying” between 2013 and 2014, a sector with relatively low enterprise numbers (411 active enterprises in 2014 including 18 new enterprise births). Sector K “Financial and insurance activities excluding activities of holding companies (K-642)" experienced the highest decrease (34.6%), between these two years. In 2014, Sector K had 418 enterprise births, compared to 639 in 2013. See figure 11.
| Industry | Services | Construction | Distribution | Financial | |
| 2008 | 732 | 8379 | 3443 | 2453 | 437 |
| 2009 | 970 | 9646 | 3573 | 2758 | 898 |
| 2010 | 778 | 7710 | 2467 | 2552 | 448 |
| 2011 | 895 | 7791 | 2589 | 2683 | 385 |
| 2012 | 925 | 8174 | 2757 | 2704 | 519 |
| 2013 | 968 | 7441 | 2473 | 2304 | 639 |
| 2014 | 1110 | 8734 | 3526 | 2468 | 418 |
Over 20,000 enterprises ceased during 20139, resulting in a loss of over 23,000 persons engaged. This represents 23.9% more enterprise deaths than 2012. 2013 enterprise death figures are preliminary as an enterprise needs two full years of inactivity before being declared a final death. The number of enterprise deaths increased across all sectors in 2013. In 2013, Sector F "Construction" has the highest number of enterprise deaths with 4,418 enterprises ceasing activity or 22% of total deaths. Sector G "Wholesale and retail trade, repair of motor vehicles and motorcycles" also took up a large proportion of overall deaths in 2013, with 3,449 enterprise deaths or 17.2% of overall deaths.
The sector with the largest percentage increase in the number of enterprises deaths was Sector K “Financial and insurance activities excluding activities of holding companies” with an increase of over 77.2%. This was followed by Sector N “Administrative and support service activities” and Sector D "Electricity, gas, steam and air conditioning supply" who also experienced large percentage increases albeit some of these sectors have low enterprise population numbers. Although the number of overall deaths has increased in the 2008 - 2013 period, the number of deaths in Sector F"Construction" has dropped by 41.2% in the same period. See figure 12.
| Industry | Services | Construction | Distribution | Financial | |
| 2008 | 928 | 7565 | 7518 | 2848 | 298 |
| 2009 | 1058 | 8547 | 6146 | 3039 | 452 |
| 2010 | 963 | 8066 | 4697 | 2857 | 439 |
| 2011 | 874 | 7363 | 3786 | 2771 | 383 |
| 2012 | 957 | 8144 | 3584 | 2952 | 562 |
| 2013 | 1160 | 10057 | 4418 | 3449 | 996 |
During 2013, in terms of employment, Sector G “Wholesale and Retail Trade, Repair of Motor Vehicles and Motor Cycles” had the most persons engaged in ceased enterprises, with a loss of 4,629 persons engaged. The second highest was Sector F “Construction” with a loss of just over 4,110 persons engaged. As can be seen from figure 13, the number of persons engaged from enterprise births increased in 2014, while the number of persons engaged in ceased enterprises increased in 2013 relative to the two previous years. The number of persons engaged in enterprise births (2014) and enterprise deaths (2013) are both below the levels experienced in 2008.
| Births | Deaths | |
| 2008 | 22872 | 34711 |
| 2009 | 18089 | 28406 |
| 2010 | 16961 | 23689 |
| 2011 | 16794 | 20750 |
| 2012 | 18605 | 20467 |
| 2013 | 16505 | 23127 |
| 2014 | 19382 |
International comparison
In EU terms10 (latest data available is for 2013), Ireland’s largest sector of active enterprises, the Services sector, at 51% is higher than the EU average (46.5%) but lower than Germany (52%), and the UK (57%) as well as six other Member States. The Services sector is also the UK's largest sector of active enterprises. In 2013, Ireland had the largest percentage share of active enterprises in the EU for Sector F “Construction” at 20% along with Slovakia. This compares to 15% for the EU average, the UK at 15% and Germany at 13%. Bulgaria had the smallest percentage at nearly 6%, followed by Latvia and Romania at 9%. See figure 14.
| Industry (%) | Services (%) | Construction (%) | Distribution (%) | Financial (%) | |
| Belgium | 7 | 50 | 16 | 25 | 2 |
| Bulgaria | 10 | 39 | 6 | 43 | 1 |
| Czech Republic | 18 | 38 | 16 | 23 | 5 |
| Denmark | 9 | 54 | 14 | 20 | 3 |
| Germany | 11 | 52 | 13 | 22 | 2 |
| Estonia | 11 | 51 | 13 | 25 | 1 |
| Ireland | 7 | 51 | 20 | 19 | 3 |
| Spain | 7 | 46 | 16 | 29 | 3 |
| France | 9 | 46 | 18 | 26 | 2 |
| Croatia | 15 | 45 | 13 | 26 | 1 |
| Italy | 11 | 42 | 14 | 30 | 2 |
| Cyprus | 11 | 36 | 16 | 33 | 4 |
| Latvia | 11 | 51 | 9 | 28 | 2 |
| Lithuania | 12 | 35 | 15 | 37 | 2 |
| Luxembourg | 3 | 56 | 11 | 25 | 5 |
| Hungary | 10 | 49 | 10 | 26 | 4 |
| Malta | 9 | 42 | 14 | 34 | 2 |
| Netherlands | 6 | 54 | 15 | 23 | 3 |
| Austria | 9 | 55 | 10 | 24 | 3 |
| Poland | 13 | 36 | 15 | 33 | 3 |
| Portugal | 9 | 50 | 10 | 29 | 2 |
| Romania | 11 | 39 | 9 | 40 | 2 |
| Slovenia | 15 | 48 | 15 | 20 | 2 |
| Slovakia | 16 | 35 | 20 | 28 | 1 |
| Finland | 11 | 50 | 17 | 20 | 2 |
| Sweden | 8 | 56 | 14 | 19 | 2 |
| United Kingdom | 7 | 57 | 15 | 19 | 2 |
| Norway | 7 | 55 | 19 | 18 | 1 |
| Table 1: Active Enterprises (Number) by Activity and Year | ||||||||
| Number of Enterprises | ||||||||
| 2008 | 2009 | 2010 | 2011 | 2012 | 2013 | 2014 | ||
| Mining and quarrying (B) | .. | 434 | 408 | 412 | 411 | 421 | 411 | |
| Manufacturing (C) | 14,513 | 14,629 | 14,311 | 14,336 | 14,533 | 14,649 | 14,628 | |
| Electricity, gas, steam and air conditioning supply (D) | .. | 330 | 403 | 423 | 456 | 485 | 483 | |
| Water supply, sewerage, waste management and remediation activities (E) | 844 | 892 | 928 | 961 | 985 | 985 | 975 | |
| Construction (F) | 61,905 | 57,472 | 52,607 | 50,256 | 49,530 | 48,502 | 47,349 | |
| Wholesale and retail trade, repair of motor vehicles and motorcycles (G) | 46,234 | 46,494 | 46,820 | 47,030 | 47,554 | 47,061 | 45,618 | |
| Transportation and storage (H) | 27,743 | 27,271 | 27,196 | 26,370 | 26,284 | 25,734 | 24,595 | |
| Accommodation and food service activities (I) | 17,466 | 17,467 | 17,552 | 17,693 | 17,892 | 17,913 | 17,790 | |
| Information and communication (J) | 10,632 | 11,264 | 11,869 | 12,350 | 13,099 | 13,578 | 13,687 | |
| Financial and insurance activities excluding activities of holding companies (K-642) | 5,836 | 6,699 | 7,041 | 6,986 | 7,310 | 7,502 | 6,593 | |
| Real estate activities (L) | 9,766 | 10,541 | 11,361 | 11,387 | 11,986 | 12,065 | 11,912 | |
| Professional, scientific and technical activities (M) | 34,259 | 36,051 | 37,194 | 37,685 | 38,805 | 38,911 | 38,795 | |
| Administrative and support service activities (N) | 14,399 | 14,883 | 15,001 | 14,990 | 15,548 | 15,764 | 15,412 | |
| Business economy excluding activities of holding companies (B to N,-642) | 244,195 | 244,428 | 242,692 | 240,880 | 244,394 | 243,571 | 238,249 | |
| Education (P) | 10,268 | 10,168 | 11,137 | 11,553 | 12,252 | 12,542 | 12,986 | |
| Arts, Entertainment & Recreation (R) | 8,679 | 9,722 | 9,512 | 9,777 | 10,287 | 10,428 | 10,538 | |
| NACE code 64.20 Activities of holding companies is excluded from sector K. | ||||||||
| .. indicates that the data has been suppressed to protect the confidentiality of individual enterprises. | ||||||||
| Table 2: Persons Engaged (Number) by Activity and Year | ||||||||
| Number of Persons Engaged | ||||||||
| 2008 | 2009 | 2010 | 2011 | 2012 | 2013 | 2014 | ||
| Mining and quarrying (B) | 5,134 | 6,176 | 4,384 | 4,269 | 4,180 | 4,146 | 4,058 | |
| Manufacturing (C) | 218,792 | 194,172 | 181,611 | 181,050 | 178,700 | 181,091 | 189,966 | |
| Electricity, gas, steam and air conditioning supply (D) | 9,235 | 9,922 | 9,117 | 8,842 | 8,735 | 8,246 | 8,496 | |
| Water supply, sewerage, waste management and remediation activities (E) | 7,785 | 8,009 | 7,189 | 7,534 | 7,578 | 7,508 | 8,025 | |
| Construction (F) | 190,069 | 134,313 | 104,545 | 94,640 | 89,351 | 91,122 | 99,860 | |
| Wholesale and retail trade, repair of motor vehicles and motorcycles (G) | 374,598 | 345,721 | 329,380 | 328,147 | 327,687 | 332,768 | 336,866 | |
| Transportation and storage (H) | 104,730 | 97,341 | 94,358 | 92,582 | 91,852 | 91,644 | 91,985 | |
| Accommodation and food service activities (I) | 163,673 | 154,069 | 148,189 | 146,374 | 150,735 | 155,105 | 161,097 | |
| Information and communication (J) | 73,297 | 66,811 | 67,683 | 69,290 | 72,684 | 77,060 | 82,010 | |
| Financial and insurance activities excluding activities of holding companies (K-642) | 100,487 | 94,273 | 96,503 | 96,545 | 97,673 | 96,371 | 96,460 | |
| Real estate activities (L) | 21,613 | 17,312 | 18,423 | 19,095 | 20,111 | 20,848 | 22,775 | |
| Professional, scientific and technical activities (M) | 125,971 | 113,458 | 108,168 | 108,630 | 110,924 | 115,426 | 120,245 | |
| Administrative and support service activities (N) | 116,536 | 103,884 | 100,925 | 102,328 | 104,559 | 106,682 | 112,448 | |
| Business economy excluding activities of holding companies (B to N,-642) | 1,511,920 | 1,345,461 | 1,270,475 | 1,259,326 | 1,264,769 | 1,288,017 | 1,334,291 | |
| Education (P) | 145,451 | 121,622 | 145,700 | 147,369 | 147,643 | 149,390 | 151,939 | |
| Arts, Entertainment & Recreation (R) | 36,785 | 37,196 | 35,509 | 35,588 | 36,259 | 36,857 | 37,442 | |
| NACE code 64.20 Activities of holding companies is excluded from sector K. | ||||||||
| .. indicates that the data has been suppressed to protect the confidentiality of individual enterprises. | ||||||||
| Table 3: Persons Engaged (Number) by Size Class and Year | ||||||||
| Number of Persons Engaged | ||||||||
| 2008 | 2009 | 2010 | 2011 | 2012 | 2013 | 2014 | ||
| Business economy excluding activities of holding companies (B to N,-642) | ||||||||
| All persons engaged size classes | 1,511,920 | 1,345,461 | 1,270,475 | 1,259,326 | 1,264,769 | 1,288,017 | 1,334,291 | |
| Under 10 | 425,018 | 387,521 | 372,075 | 370,497 | 371,116 | 370,112 | 373,342 | |
| 10-19 | 160,072 | 139,072 | 129,385 | 126,201 | 123,545 | 125,812 | 131,445 | |
| 20 - 49 | 197,808 | 166,716 | 152,823 | 148,758 | 150,353 | 153,589 | 160,269 | |
| 50 - 249 | 292,297 | 247,755 | 229,547 | 230,472 | 229,404 | 236,123 | 254,928 | |
| 250 and over | 436,725 | 404,397 | 386,645 | 383,398 | 390,351 | 402,381 | 414,307 | |
| NACE code 64.20 Activities of holding companies is excluded from sector K. | ||||||||
| .. indicates that the data has been suppressed to protect the confidentiality of individual enterprises. | ||||||||
| Table 4: Enterprise Births (Number) by Activity and Year | ||||||||
| Number of Enterprise Births | ||||||||
| 2008 | 2009 | 2010 | 2011 | 2012 | 2013 | 2014 | ||
| Mining and quarrying (B) | 23 | 33 | .. | .. | 20 | 26 | 18 | |
| Manufacturing (C) | 620 | 777 | 650 | 770 | 806 | 841 | 997 | |
| Electricity, gas, steam and air conditioning supply (D) | 23 | 87 | 56 | 39 | 34 | .. | 31 | |
| Water supply, sewerage, waste management and remediation activities (E) | 66 | 73 | .. | .. | 66 | .. | 64 | |
| Construction (F) | 3,443 | 3,573 | 2,467 | 2,589 | 2,757 | 2,473 | 3,526 | |
| Wholesale and retail trade, repair of motor vehicles and motorcycles (G) | 2,453 | 2,758 | 2,552 | 2,683 | 2,704 | 2,304 | 2,468 | |
| Transportation and storage (H) | 1,665 | 1,454 | 1,047 | 981 | 1,005 | 805 | 1,026 | |
| Accommodation and food service activities (I) | 1,167 | 1,159 | 1,137 | 1,232 | 1,206 | 1,142 | 1,251 | |
| Information and communication (J) | 969 | 1,154 | 1,108 | 1,181 | 1,275 | 1,249 | 1,333 | |
| Financial and insurance activities excluding activities of holding companies (K-642) | 437 | 898 | 448 | 385 | 519 | 639 | 418 | |
| Real estate activities (L) | 934 | 1,407 | 925 | 855 | 915 | 862 | 1,171 | |
| Professional, scientific and technical activities (M) | 2,579 | 3,343 | 2,556 | 2,643 | 2,715 | 2,431 | 2,800 | |
| Administrative and support service activities (N) | 1,065 | 1,129 | 937 | 899 | 1,059 | 952 | 1,153 | |
| Business economy excluding activities of holding companies (B to N,-642) | 15,444 | 17,845 | 13,955 | 14,343 | 15,079 | 13,825 | 16,256 | |
| Education (P) | 667 | 713 | 642 | 707 | 812 | 670 | 933 | |
| Arts, Entertainment & Recreation (R) | 620 | 903 | 643 | 718 | 726 | 630 | 897 | |
| NACE code 64.20 Activities of holding companies is excluded from sector K. | ||||||||
| .. indicates that the data has been suppressed to protect the confidentiality of individual enterprises. | ||||||||
| Table 5: Enterprise Deaths (Number) by Activity and Year | |||||||
| Number of Enterprise Deaths | |||||||
| 2008 | 2009 | 2010 | 2011 | 2012 | 2013* | ||
| Mining and quarrying (B) | 18 | 31 | 19 | .. | 21 | 27 | |
| Manufacturing (C) | 862 | 955 | 862 | 772 | 850 | 1,023 | |
| Electricity, gas, steam and air conditioning supply (D) | .. | 16 | .. | .. | .. | 36 | |
| Water supply, sewerage, waste management and remediation activities (E) | 42 | 56 | 61 | 56 | .. | 74 | |
| Construction (F) | 7,518 | 6,146 | 4,697 | 3,786 | 3,584 | 4,418 | |
| Wholesale and retail trade, repair of motor vehicles and motorcycles (G) | 2,848 | 3,039 | 2,857 | 2,771 | 2,952 | 3,449 | |
| Transportation and storage (H) | 1,444 | 1,713 | 1,561 | 1,322 | 1,308 | 1,806 | |
| Accommodation and food service activities (I) | 1,308 | 1,361 | 1,307 | 1,266 | 1,292 | 1,398 | |
| Information and communication (J) | 839 | 980 | 940 | 901 | 1,040 | 1,232 | |
| Financial and insurance activities excluding activities of holding companies (K-642) | .. | 452 | .. | 383 | 562 | 996 | |
| Real estate activities (L) | 798 | 904 | 815 | 725 | 918 | 1,300 | |
| Professional, scientific and technical activities (M) | 2,251 | 2,537 | 2,497 | 2,316 | 2,641 | 2,941 | |
| Administrative and support service activities (N) | 925 | 1,052 | 946 | 833 | 945 | 1,380 | |
| Business economy excluding activities of holding companies (B to N,-642) | 19,157 | 19,242 | 17,022 | 15,177 | 16,199 | 20,080 | |
| Education (P) | 435 | 454 | 462 | 432 | 536 | 742 | |
| Arts, Entertainment & Recreation (R) | 492 | 566 | 545 | 483 | 605 | 859 | |
| NACE code 64.20 Activities of holding companies is excluded from sector K. | |||||||
| *Enterprise deaths data for 2013 is preliminary as 2 years of inactivity are necessary to be declared a final death. | |||||||
| .. indicates that the data has been suppressed to protect the confidentiality of individual enterprises. | |||||||
This release covers the reference year 2014, however data on enterprise deaths relates to 2013. Statistics are also provided on enterprise births since 2008 that were still active during 2013 and 2014. All 2014 enterprise births will be followed for 5 years to assess their survival rate and the resulting effect on employment.
Detailed data tables are available on CSO’s data dissemination service at:
The Background Notes at the link below provide more details on the release:
http://www.cso.ie/en/surveysandmethodology/multisectoral/businessdemography/backgroundnotes/
For further information on the NACE Rev. 2 classification of economic activity, see this link:
http://www.cso.ie/en/surveysandmethodology/classifications/classificationofindustrialactivity/
Footnotes:
1The Business Demography series 2008 - 2012 has been revised due to active enterprise definition changes. The starting point for all CSO enterprise surveys is the CSO's Central Business Register. This register contains the active population of enterprises and is updated principally using administrative data as received by CSO from the Revenue Commissioners. The various Revenue Income Tax, Corporation Tax, VAT and PREM (P35) datasets as received at varying points over a calendar year provide the essential update information for the creation of the active population of enterprises which need to be measured for economic activity. This information is, in turn, supplemented by information received from the Companies Registration Office (for example on the legal form of the enterprise) and from updates received as part of the surveying of enterprises.
The historic definition of what constitutes an active enterprise outlines that an enterprise is active if it meets any one of the following criteria:
- Paid VAT during the reference year
- Have employees during the reference year
- File a Corporation Tax return for the reference year
- File an Income Tax return for the reference year with turnover of over €50,000.
Furthermore, Eurostat rules allow some flexibility to interpret the above and outline that
“If there is insufficient information on turnover or employment to determine whether or not an enterprise is active, then national methods leading to this aim will be accepted”.
A new EU definition of what constitutes an active enterprise has recently been agreed at EU level and will likely achieve full legislative effect (FRIBS package, see footnote2) within a few years. This definition is a much clearer outline of what constitutes an active enterprise. An enterprise is considered to be active if:
"in a certain period it generates turnover, employs staff or makes investments in the period"
2 The Framework Regulation Integrating Business Statistics:
http://ec.europa.eu/eurostat/about/opportunities/consultations/fribs
3The private business economy covers the NACE Rev 2 sectors B - N (excluding K64.20 Activities of holding companies). For comparison with previous Business Demography releases only sectors B – N (excluding K64.20, activities of holding companies) figures are included in the release text. Sectors P & R are an extension of the coverage in recent years.
The full list of Rev 2 sectors covered is:
B – Mining and Quarrying
C – Manufacturing
D – Electricity, Gas, Steam and Air Conditioning Supply
E – Water Supply; Sewerage, Waste management and Remediation Activities
F – Construction
G – Wholesale and Retail Trade; Repair of Motor Vehicles and Motorcycles
H – Transportation and Storage
I – Accommodation and Food Service Activities
J – Information and Communication
K – Financial and Insurance Activities (excludes NACE code 64.20 Activities of holding companies)
L – Real Estate Activities
M – Professional, Scientific and Technical Activities
N – Administrative and Support Service Activities
P – Education
R – Arts, Entertainment and Recreation
The number of active enterprises in year t (reference year) cannot be calculated from previous active enterprise figures and births and deaths figures. e.g. the number of active enterprises in year t does not equal the number of active enterprises in year t-1, minus deaths in t-1 plus births in year t. Birth calculations involve profiling work where real births are checked and weights applied based on checks conducted (a similar process is conducted for death calculations). In addition, final enterprise deaths take two years to be finalised, therefore enterprises may not be in enterprise totals in one year but could be in the next year and may still not be considered an enterprise birth or death.
4Persons engaged include employees, proprietors and family members. Persons engaged are the sum of Employees plus Working Proprietors.
Employees are persons who are paid a fixed wage or salary. Employees are calculated using an annual employment return received from Revenue. This return contains all registered employers and the number of employees they have paid a wage or salary for a reference year. The file can contain individuals paid a wage by an employer as well as self-employed individuals who pay themselves a working wage. An individual may be counted more than once for a reference year if they work multiple jobs in that reference year. The annual employment return from Revenue contains persons at work or temporarily absent because of illness, holidays, strike etc. If an individual is paid a wage for any segment of a reference year they are included in the overall figures.
Working Proprietors (Proprietors and family members); included here are those proprietors, partners, etc and members of their families who work regularly in the firm and are not paid a definite wage or salary. Working Propreitors is not a full count of self-employed individuals as some self-employed receive a wage and are returned via annual employment returns and are included in the Employees calculation.
Comparison of Business Demography and Quarterly National Household Survey employment levels:
The primary classification used for the Quarterly National Household Survey (QNHS) results is the International Labour Office (ILO) labour force classification. Labour Force Survey data on this basis have been published since 1988. The ILO classification distinguishes the following main subgroups of the population aged 15 or over
In Employment: Persons who worked in the week before the survey for one hour or more for payment or profit, including work on the family farm or business and all persons who had a job but were not at work because of illness, holidays etc. in the week.
Unemployed: Persons who, in the week before the survey, were without work and available for work within the next two weeks, and had taken specific steps, in the preceding four weeks, to find work. It should be noted that as per Eurostat’s operational implementation, the upper age limit for classifying a person as unemployed is 74 years.
Inactive Population (not in labour force): All other persons.
The labour force comprises persons employed plus unemployed. Persons in employment classify their employment status as being self-employed, employee, assisting relative/family worker or on a state sponsored employment scheme. Employees are defined as persons who work for a public or private employer and who receive compensation in the form of wages, salaries, fees, gratuities, payment by results or payment in kind. Self-employed persons who pay themselves a working wage are classified as self-employed in the QNHS.
Key Differences between QNHS and Business Demography figures include:
- Business Demography is based purely on administrative data received from Revenue on an annual basis.
- QNHS is based on survey data which is collected every quarter from the household.
- Business Demography does not cap employment at 1 or at any value for an individual. Business Demography employment is a count of persons engaged at an enterprise and sector level. All work conducted by an individual over an annual period is included in the relevant enterprise (and therefore sector) in which they worked, on the basis of weeks (not hours) worked.
- QNHS caps employment at 2 for an individual in relation to full time equivalence only, therefore it takes into consideration a person’s first and second job. Otherwise employment is capped at one for an individual.
- Timing issues. As stated, QNHS is conducted on a quarterly basis while Business Demography is conducted over a yearly basis. QNHS also takes into account the hours worked by an individual and uses these values in full time equivalent employment calculations. Business Demography operates on a weeks worked basis from files received from Revenue. If an individual is classed as working 52 weeks in a reference period for an enterprise, they are classed as 1 employee (no hours worked is taking into consideration), irrespective of how many hours they have actually worked in those weeks
5The composition of sectors used in the graphs is as follows:
- Services: Sectors H,I,J,L,M,N
- Distribution: Sector G
- Industry: Sectors B,C,D,E
- Construction: Sector F
- Financial Service Activities: Sector K excluding 64.20, Activities of holding companies.
6Small and Medium Enterprises are defined as enterprises with less than 250 persons engaged. The persons engaged breakdown provided in the figures are;
Less than 10: Micro Enterprises
10 – 49: Small Enterprises
50 – 249: Medium Enterprises
250+: Large Enterprises.
7Enterprise Deaths: An enterprise death amounts to the dissolution of a combination of production factors with the restriction that no other enterprises are involved in the event. Deaths do not include exits from the population due to mergers, takeovers, break-ups or restructuring of a set of enterprises. It does not include exits from a sub-population resulting only from a change of activity.
An enterprise is included in the count of deaths only if it is not reactivated within two years.
The population of enterprise deaths in 2013 contains all enterprises that ceased at some point during the year 2013. The figures given in the release in relation to deaths are final figures for the period 2008 - 2012 and are preliminary figures for 2013. Final figures for 2013 will be released in June 2017.
8Enterprise Births: An enterprise birth amounts to the creation of a combination of production factors with the restriction that no other enterprises are involved in the event. Births do not include entries into the population due to mergers, break-ups, split-off or restructuring of a set of enterprises. It does not include entries into a sub-population resulting only from a change of activity.
A birth occurs when an enterprise starts from scratch and actually starts activity. An enterprise creation can be considered an enterprise birth if new production factors, in particular new jobs, is created. If a dormant unit is reactivated within two years, this event is not considered a birth.
The population of enterprise births in 2014 contains all enterprises that started at some stage during the year 2014.
9Population, births and survival data in this release relates to 2014, but the latest deaths data available is for 2013.
10Business Demography figures at an EU level are available at the following link. Latest data available is for 2013.
http://ec.europa.eu/eurostat/web/structural-business-statistics/entrepreneurship/business-demography
 Hide Background Notes
Scan the QR code below to view this release online or go to
http://www.cso.ie/en/releasesandpublications/er/bd/businessdemography2014/
 Show Table 1 Active Enterprises (Number) by Activity and Year
 Hide Table 1 Active Enterprises (Number) by Activity and Year