
| 000's | |||||||||
| Direction | July | January-July | |||||||
| 2019 | 2020 | Change | 2019 | 2020 | Change | ||||
| Arrivals | 2,225.9 | 227.3 | -1,998.5 | -89.8% | 11,565.1 | 3,414.0 | -8,151.1 | -70.5% | |
| Departures | 2,183.9 | 275.4 | -1,908.5 | -87.4% | 11,692.1 | 3,448.7 | -8,243.4 | -70.5% | |
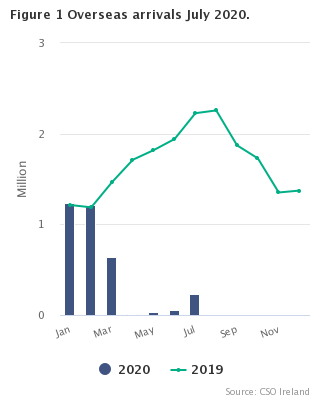
July 2020 overseas travel to and from Ireland increased substantially compared to June as COVID-19 restrictions were eased. July 2020 saw 227,300 overseas arrivals and 275,400 overseas departures. These compare with 57,100 arrivals and 73,900 departures in the previous month, increases of 298.1% and 272.7% respectively (See Tables 2A and 2B). Nevertheless, overseas travel in July 2020 remained dramatically lower than in July 2019, when there were 2,225,900 arrivals and 2,183,900 departures, falls of 89.8% and 87.4% respectively (See Table 1).
Of the 227,300 persons arriving in Ireland in July 2020, 188,100 (82.7%) arrived by air and 39,200 (17.3%) arrived by sea. Of the 275,400 persons departing Ireland, 239,000 (86.8%) departed by air and 36,400 (13.2%) departed by sea (See Table 1).
Of those arriving in Ireland, 97,100 (42.7%) came by cross-channel routes, 114,800 (50.5%) by continental routes, 8,800 (3.9%) by transatlantic routes and 6,600 (2.9%) by other overseas routes. The corresponding figures for those departing Ireland were 82,800 (30.1%), 182,400 (66.2%), 4,600 (1.7%) and 5,600 (2.0%) respectively (See Table 1).
The most important staging countries for persons travelling overseas to Ireland were Great Britain (97,100), Spain (23,000) and France (13,200). The most important staging countries for persons travelling overseas from Ireland were Great Britain (82,800), Spain (38,500) and Poland (23,800). (See Table 1).
For the year-to-date (January-July), 3,414,000 persons arrived in Ireland from overseas and 3,448,700 persons departed. These both represent decreases of 70.5% compared to the same period in 2019 (See Table 3).
| The collection of Tourism Statistics at air and sea ports was suspended in March 2020, to protect CSO enumerators and the travelling public. As a result, the details of travel to Ireland classified by country of residence, which are presented in the monthly Overseas Travel release, are not currently being collected and that release has been temporarily suspended. To help fill the data gap, the CSO is publishing this new Air and Sea Travel Statistics release which reports on the numbers of overseas travellers arriving and departing Ireland classified by travel route. The information is compiled primarily from statistics provided by the DAA, together with data from other air and sea ports. The CSO intends to continue publishing this Air and Sea Travel Statistics release for the duration of the COVID-19 crisis. |
| Table 1: Overseas arrivals and departures by mode and route, July 2019 and 2020 | 000's | ||||||||
| Category | July | ||||||||
| Arrivals | Departures | ||||||||
| 2019 | 2020 | Change | 2019 | 2020 | Change | ||||
| Mode | |||||||||
| Air | 2,017.7 | 188.1 | -1,829.6 | -90.7% | 2,006.9 | 239.0 | -1,767.8 | -88.1% | |
| Sea | 208.1 | 39.2 | -168.9 | -81.2% | 177.0 | 36.4 | -140.6 | -79.4% | |
| Route | |||||||||
| Great Britain | 798.2 | 97.1 | -701.2 | -87.8% | 729.7 | 82.8 | -646.9 | -88.7% | |
| Guernsey, Isle of Man, Jersey | 5.0 | 0.0 | -5.0 | -100.0% | 4.7 | 0.0 | -4.7 | -100.0% | |
| Cross-Channel | 803.2 | 97.1 | -706.1 | -87.9% | 734.4 | 82.8 | -651.6 | -88.7% | |
| Belgium | 21.8 | 2.7 | -19.1 | -87.5% | 20.4 | 2.5 | -17.9 | -87.8% | |
| Germany | 126.2 | 9.8 | -116.4 | -92.2% | 125.8 | 13.1 | -112.7 | -89.6% | |
| Spain | 292.9 | 23.0 | -269.9 | -92.1% | 295.5 | 38.5 | -257.0 | -87.0% | |
| France | 160.4 | 13.2 | -147.2 | -91.8% | 146.4 | 20.1 | -126.3 | -86.3% | |
| Italy | 101.2 | 6.9 | -94.3 | -93.2% | 98.4 | 14.7 | -83.7 | -85.1% | |
| Netherlands | 70.1 | 9.4 | -60.7 | -86.6% | 64.2 | 9.4 | -54.8 | -85.4% | |
| Poland | 43.0 | 12.7 | -30.3 | -70.4% | 46.2 | 23.8 | -22.4 | -48.5% | |
| Portugal | 92.5 | 7.4 | -85.0 | -91.9% | 94.6 | 11.2 | -83.4 | -88.2% | |
| Other EU27 | 156.7 | 24.8 | -131.9 | -84.2% | 164.2 | 42.1 | -122.0 | -74.3% | |
| EU27 Total | 1,064.9 | 110.0 | -954.9 | -89.7% | 1,055.5 | 175.3 | -880.2 | -83.4% | |
| Switzerland | 28.1 | 2.5 | -25.6 | -91.1% | 26.3 | 2.5 | -23.7 | -90.4% | |
| Other Europe | 21.4 | 2.3 | -19.1 | -89.1% | 25.3 | 4.6 | -20.8 | -82.0% | |
| Continental | 1,114.4 | 114.8 | -999.6 | -89.7% | 1,107.1 | 182.4 | -924.7 | -83.5% | |
| United States | 199.7 | 8.1 | -191.6 | -96.0% | 227.6 | 4.1 | -223.5 | -98.2% | |
| Other Transatlantic | 38.5 | 0.7 | -37.7 | -98.1% | 41.3 | 0.5 | -40.7 | -98.7% | |
| Transatlantic | 238.1 | 8.8 | -229.3 | -96.3% | 268.8 | 4.6 | -264.2 | -98.3% | |
| United Arab Emirates | 33.6 | 3.6 | -30.0 | -89.3% | 33.9 | 1.1 | -32.8 | -96.8% | |
| Other Destinations | 36.5 | 3.0 | -33.5 | -91.8% | 39.6 | 4.5 | -35.1 | -88.6% | |
| Other Routes | 70.1 | 6.6 | -63.5 | -90.6% | 73.5 | 5.6 | -67.9 | -92.4% | |
| All | 2,225.9 | 227.3 | -1,998.5 | -89.8% | 2,183.9 | 275.4 | -1,908.5 | -87.4% | |
| Table 2A: Overseas arrivals by month, mode and route, January-July 2020 | 000's | ||||||
| Category | Jan | Feb | Mar | Apr | May | Jun | Jul |
| Mode | |||||||
| Air | 1195.2 | 1171.7 | 603.6 | 12.1 | 19.9 | 40.2 | 188.1 |
| Sea | 39.9 | 43.4 | 31.3 | 4.0 | 8.4 | 16.9 | 39.2 |
| Route | |||||||
| Great Britain | 498.7 | 532.6 | 272.3 | 9.3 | 16.4 | 32.3 | 97.1 |
| Guernsey, Isle of Man, Jersey | 1.2 | 1.5 | 0.8 | 0.0 | 0.0 | 0.0 | 0.0 |
| Cross-Channel | 499.9 | 534.2 | 273.1 | 9.3 | 16.4 | 32.3 | 97.1 |
| Belgium | 19.2 | 19.7 | 8.3 | 0.1 | 0.3 | 0.6 | 2.7 |
| Germany | 76.9 | 75.7 | 36.1 | 0.6 | 1.4 | 3.9 | 9.8 |
| Spain | 119.5 | 110.1 | 67.6 | 0.0 | 0.1 | 0.9 | 23.0 |
| France | 66.8 | 64.2 | 32.6 | 0.6 | 1.4 | 3.0 | 13.2 |
| Italy | 47.2 | 43.8 | 5.6 | 0.0 | 0.0 | 0.4 | 6.9 |
| Netherlands | 57.2 | 56.9 | 27.2 | 1.2 | 2.7 | 4.4 | 9.4 |
| Poland | 49.6 | 41.3 | 19.1 | 0.1 | 0.1 | 0.4 | 12.7 |
| Portugal | 28.4 | 25.8 | 15.8 | 0.2 | 0.7 | 1.5 | 7.4 |
| Other EU27 | 90.6 | 84.5 | 43.6 | 0.5 | 1.2 | 2.4 | 24.8 |
| EU27 Total | 555.4 | 522.0 | 255.8 | 3.4 | 7.9 | 17.4 | 110.0 |
| Switzerland | 18.0 | 17.9 | 8.3 | 0.0 | 0.0 | 0.5 | 2.5 |
| Other Europe | 13.6 | 14.0 | 7.9 | 0.0 | 0.3 | 0.3 | 2.3 |
| Continental | 586.9 | 553.9 | 271.9 | 3.5 | 8.2 | 18.3 | 114.8 |
| United States | 92.5 | 80.9 | 54.4 | 1.1 | 1.7 | 3.7 | 8.1 |
| Other Transatlantic | 8.0 | 6.9 | 5.5 | 0.0 | 0.0 | 0.0 | 0.7 |
| Transatlantic | 100.5 | 87.8 | 59.9 | 1.2 | 1.7 | 3.8 | 8.8 |
| United Arab Emirates | 28.5 | 24.5 | 19.0 | 0.1 | 0.1 | 0.9 | 3.6 |
| Other Destinations | 19.3 | 14.7 | 10.9 | 2.1 | 1.9 | 1.9 | 3.0 |
| Other Routes | 47.8 | 39.2 | 29.9 | 2.1 | 2.0 | 2.7 | 6.6 |
| All | 1235.1 | 1215.1 | 635.0 | 16.1 | 28.3 | 57.1 | 227.3 |
| Table 2B: Overseas departures by month, mode and route, January-July 2020 | 000's | ||||||
| Category | Jan | Feb | Mar | Apr | May | Jun | Jul |
| Mode | |||||||
| Air | 1183.5 | 1161.9 | 575.6 | 12.8 | 24.7 | 53.1 | 239.0 |
| Sea | 56.3 | 41.4 | 26.5 | 4.9 | 11.6 | 20.8 | 36.4 |
| Route | |||||||
| Great Britain | 545.7 | 528.4 | 257.9 | 8.8 | 18.7 | 36.8 | 82.8 |
| Guernsey, Isle of Man, Jersey | 1.4 | 1.6 | 1.0 | 0.0 | 0.0 | 0.0 | 0.0 |
| Cross-Channel | 547.1 | 530.0 | 258.9 | 8.8 | 18.7 | 36.8 | 82.8 |
| Belgium | 19.2 | 19.2 | 8.8 | 0.2 | 0.7 | 1.3 | 2.5 |
| Germany | 74.5 | 72.7 | 40.2 | 1.2 | 2.1 | 6.6 | 13.1 |
| Spain | 101.7 | 113.8 | 50.6 | 0.1 | 0.4 | 2.3 | 38.5 |
| France | 63.6 | 63.1 | 34.2 | 1.4 | 3.4 | 5.7 | 20.1 |
| Italy | 42.7 | 42.5 | 5.8 | 0.1 | 0.4 | 1.2 | 14.7 |
| Netherlands | 58.4 | 55.0 | 26.5 | 2.0 | 4.1 | 6.2 | 9.4 |
| Poland | 42.7 | 41.7 | 19.3 | 0.4 | 0.1 | 0.6 | 23.8 |
| Portugal | 23.0 | 26.8 | 13.5 | 0.2 | 1.1 | 2.8 | 11.2 |
| Other EU27 | 84.5 | 84.5 | 44.1 | 1.3 | 1.7 | 4.9 | 42.1 |
| EU27 Total | 510.4 | 519.4 | 243.0 | 7.0 | 13.9 | 31.6 | 175.3 |
| Switzerland | 18.5 | 17.9 | 7.8 | 0.0 | 0.0 | 1.2 | 2.5 |
| Other Europe | 11.8 | 13.4 | 8.0 | 0.2 | 0.7 | 0.5 | 4.6 |
| Continental | 540.7 | 550.7 | 258.9 | 7.3 | 14.6 | 33.3 | 182.4 |
| United States | 96.4 | 79.5 | 54.6 | 0.5 | 1.7 | 2.4 | 4.1 |
| Other Transatlantic | 8.3 | 6.7 | 7.6 | 0.0 | 0.0 | 0.0 | 0.5 |
| Transatlantic | 104.7 | 86.2 | 62.2 | 0.5 | 1.7 | 2.5 | 4.6 |
| United Arab Emirates | 29.9 | 22.7 | 13.7 | 0.0 | 0.0 | 0.2 | 1.1 |
| Other Destinations | 17.4 | 13.7 | 8.4 | 1.2 | 1.3 | 1.2 | 4.5 |
| Other Routes | 47.4 | 36.4 | 22.2 | 1.2 | 1.3 | 1.3 | 5.6 |
| All | 1239.8 | 1203.3 | 602.1 | 17.8 | 36.3 | 73.9 | 275.4 |
| Table 3: Overseas arrivals and departures by mode and route, January-July 2019 and 2020 | 000's | ||||||||
| January - July | |||||||||
| Arrivals | Departures | ||||||||
| 2019 | 2020 | Change | 2019 | 2020 | Change | ||||
| Mode | |||||||||
| Air | 10,867.8 | 3,230.8 | -7,637.0 | -70.3% | 10,990.7 | 3,250.8 | -7,739.9 | -70.4% | |
| Sea | 697.3 | 183.2 | -514.1 | -73.7% | 701.4 | 198.0 | -503.5 | -71.8% | |
| Route | |||||||||
| Great Britain | 4,398.0 | 1,458.7 | -2,939.3 | -66.8% | 4,409.6 | 1,479.2 | -2,930.3 | -66.5% | |
| Guernsey, Isle of Man, Jersey | 19.6 | 3.6 | -16.1 | -81.8% | 20.3 | 3.9 | -16.4 | -80.7% | |
| Cross-Channel | 4,417.6 | 1,462.3 | -2,955.3 | -66.9% | 4,429.9 | 1,483.1 | -2,946.7 | -66.5% | |
| Belgium | 147.2 | 51.0 | -96.2 | -65.3% | 145.7 | 51.9 | -93.8 | -64.4% | |
| Germany | 738.4 | 204.4 | -534.0 | -72.3% | 736.5 | 210.3 | -526.1 | -71.4% | |
| Spain | 1,337.6 | 321.2 | -1,016.4 | -76.0% | 1,374.9 | 307.5 | -1,067.4 | -77.6% | |
| France | 726.1 | 181.8 | -544.3 | -75.0% | 738.8 | 191.6 | -547.2 | -74.1% | |
| Italy | 456.0 | 103.9 | -352.1 | -77.2% | 462.9 | 107.4 | -355.5 | -76.8% | |
| Netherlands | 432.2 | 158.9 | -273.3 | -63.2% | 432.0 | 161.5 | -270.5 | -62.6% | |
| Poland | 290.7 | 123.3 | -167.4 | -57.6% | 294.2 | 128.7 | -165.5 | -56.3% | |
| Portugal | 379.3 | 79.7 | -299.6 | -79.0% | 401.3 | 78.7 | -322.6 | -80.4% | |
| Other EU27 | 781.9 | 247.6 | -534.3 | -68.3% | 813.0 | 263.1 | -549.9 | -67.6% | |
| EU27 Total | 5,289.6 | 1,471.9 | -3,817.7 | -72.2% | 5,399.4 | 1,500.7 | -3,898.7 | -72.2% | |
| Switzerland | 150.4 | 47.3 | -103.1 | -68.6% | 148.0 | 47.9 | -100.1 | -67.6% | |
| Other Europe | 130.4 | 38.4 | -92.0 | -70.5% | 132.4 | 39.2 | -93.1 | -70.4% | |
| Continental | 5,570.4 | 1,557.6 | -4,012.8 | -72.0% | 5,679.8 | 1,587.8 | -4,091.9 | -72.0% | |
| United States | 1,068.3 | 242.5 | -825.8 | -77.3% | 1,073.0 | 239.2 | -833.8 | -77.7% | |
| Other Transatlantic | 143.1 | 21.2 | -121.9 | -85.2% | 148.2 | 23.1 | -125.1 | -84.4% | |
| Transatlantic | 1,211.4 | 263.7 | -947.7 | -78.2% | 1,221.2 | 262.3 | -958.9 | -78.5% | |
| United Arab Emirates | 188.8 | 76.6 | -112.2 | -59.4% | 181.8 | 67.6 | -114.1 | -62.8% | |
| Other Destinations | 177.0 | 53.7 | -123.2 | -69.6% | 179.5 | 47.8 | -131.7 | -73.4% | |
| Other Routes | 365.8 | 130.4 | -235.4 | -64.4% | 361.2 | 115.4 | -245.8 | -68.0% | |
| All | 11,565.1 | 3,414.0 | -8,151.1 | -70.5% | 11,692.1 | 3,448.7 | -8,243.4 | -70.5% | |
Monthly.
Overseas Travel.
This release covers overseas travel into and out of the Republic of Ireland. Cross-border travel and domestic travel within the Republic of Ireland are excluded.
This release is based on administrative data provided by Irish airports and passenger data provided by the sea carrier companies operating ferries to and from Ireland.
Individual figures have been rounded independently and the sum of the component items may therefore not necessarily add to the totals shown.
As the statistics in this release are reproduced directly from administrative data they are considered reliable.
As the statistics in this release are persons arriving and departing, they are not directly comparable with the previous Overseas Travel release, which reported the number of overseas trips. In addition, the previous Overseas Travel series specifically excluded residents of Northern Ireland. No country of residence information is available for the compilation of these Air and Sea Travel statistics, so all countries of residence are necessarily included.
The statistics in this release are not fully coherent with separate Transport aviation and maritime statistical series published by the CSO. The Air and Sea Travel statistics exclude domestic air travel and flights to Northern Ireland. The Air and Sea Travel statistics also exclude commercial drivers on sea routes.
Arrivals comprise all persons disembarking at Cork, Dublin, Galway, Kerry, Knock, Shannon or Waterford airports, or Dublin, Dun Laoghaire, Ringaskiddy or Rosslare seaports, from international destinations (excluding Northern Ireland). Transfer passengers are included. Domestic air passengers are excluded. Cruise passengers are excluded.
Departures have the same scope as arrivals except than they refer to persons embarking for international destinations.
Mode is the means of travel. Only two modes are available; air and sea. Air refers to all persons who arrive or depart by commercial airliners (crew excluded). Sea refers to all persons who arrive or depart by commercial passenger vessels (crew and commercial drivers excluded).
For convenience, all persons arriving or departing overseas are allocated to one of four entry or exit routes. These are Cross-Channel (Great Britain, Isle of Man and the Channel Islands), continental (other European countries), Transatlantic (North & South America, including the Caribbean) and Other (Asia, Africa, Oceania, etc.).
All routes are broken down into separate countries and country groupings. It is important to note that these are the countries that arriving persons immediately departed from before entering Ireland, or departing persons immediately arrive in, after leaving Ireland. They do not refer to the country of residence of arriving or departing persons (unlike previous Overseas Travel releases, where this information was published). Nor do they refer to the country of origin or destination of the persons travelling. For example, if a person flies from John F Kennedy airport (United States) to Heathrow (Great Britain) and then to Ireland, that person will be categorised as arriving from Great Britain, as this was where their flight stage to Ireland originated.
Transfer passengers or 'connecting passengers' are defined as those who make a stop at an airport without any particular purpose other than being en route to another destination. Transfer passengers disembark from their aircraft and pass through the airport en route to their connecting flight. The two flights must be booked on the same ticket for it to be considered a transfer. A transfer trip is a completed journey – for example a passenger who travels from London Gatwick to Dublin Airport and then on to New York (on the one ticket) is counted as two transfer passengers and one transfer trip.
| Dublin Transfer Passengers (000's) | |||||||||
| Month | 2012 | 2013 | 2014 | 2015 | 2016 | 2017 | 2018 | 2019 | 2020 |
| Jan | 20 | 28 | 31 | 35 | 55 | 79 | 88 | 108 | 111 |
| Feb | 15 | 19 | 18 | 22 | 33 | 59 | 67 | 76 | 79 |
| Mar | 18 | 20 | 25 | 30 | 51 | 85 | 94 | 126 | 53 |
| Apr | 31 | 38 | 57 | 66 | 86 | 130 | 157 | 171 | 0 |
| May | 39 | 54 | 75 | 89 | 105 | 144 | 161 | 179 | 1 |
| Jun | 51 | 72 | 96 | 110 | 119 | 157 | 185 | 186 | 3 |
| Jul | 43 | 66 | 96 | 127 | 121 | 158 | 199 | 195 | 9 |
| Aug | 47 | 82 | 109 | 142 | 139 | 194 | 229 | 223 | |
| Sep | 34 | 50 | 78 | 102 | 124 | 158 | 191 | 194 | |
| Oct | 33 | 46 | 72 | 91 | 142 | 160 | 187 | 186 | |
| Nov | 34 | 33 | 42 | 61 | 84 | 118 | 136 | 141 | |
| Dec | 37 | 41 | 51 | 74 | 107 | 128 | 155 | 155 | |
| Year | 402 | 548 | 749 | 949 | 1,167 | 1,569 | 1,850 | 1,939 | |
| Source: daa | |||||||||
In July 2020 there were 9,000 transfer passengers handled by Dublin Airport. This compares to 195,000 in July 2019, a decrease of 95.4%.
 Hide Background Notes
Scan the QR code below to view this release online or go to
http://www.cso.ie/en/releasesandpublications/er/ast/airandseatravelstatisticsjuly2020/
 Show Table 1 Overseas arrivals and departures by mode and route, July 2019 and 2020
 Hide Table 1 Overseas arrivals and departures by mode and route, July 2019 and 2020