
| Direction | 2019 | 2020 | 2021 | Change | ||||
| August | August | July | August | Monthly | Annual | Biennial | ||
| '000 | % | |||||||
| Arrivals | 2,256.5 | 362.6 | 380.7 | 821.7 | 115.8% | 126.6% | -63.6% | |
| Departures | 2,191.9 | 328.2 | 428.6 | 781.0 | 82.2% | 138.0% | -64.4% | |
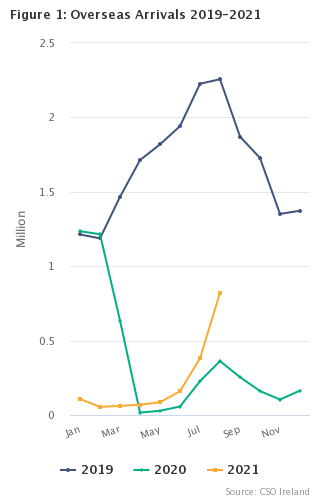
In August 2021 there were 821,700 overseas passenger arrivals and 781,000 overseas passenger departures. These compare with 380,700 arrivals and 428,600 departures in July 2021 (increases of 115.8% and 82.2% respectively) and with 362,600 arrivals and 328,200 departures in August 2020 (increases of 126.6% and 138.0% respectively). However, for every overseas traveller in August 2021, there were close to 3 in pre-pandemic August 2019, when there were 2,256,500 arrivals and 2,191,900 departures.
Of the 821,700 persons arriving in Ireland in August 2021, 87.7% (720,400) arrived by air and 12.3% (101,300) arrived by sea. Of the 781,000 persons departing Ireland, 86.2% (673,000) departed by air and 13.8% (108,000) departed by sea (See Tables 1A and 1B).
The continental route accounted for most passenger traffic, with 61.8% of arrivals (508,100) and 58.0% of departures (452,800). The cross-channel route was next busiest, with 30.1% of arrivals (247,700) and 34.0% of departures (265,600). The transatlantic route saw just 5.3% of arrivals (43,200) and 5.5% of departures (43,300) (See Tables 2A and 2B).
However, in terms of specific routing countries for travelling directly to Ireland, Great Britain proved most important, accounting for 247,100 arrivals and 264,900 departures. Spain was the second most important routing country, with 132,100 arrivals and 121,200 departures. France was third most important with 57,100 arrivals and 52,900 departures.
For the year-to-date (January-August), 1,741,500 persons arrived in Ireland from overseas and 1,817,100 persons departed. This compares with 3,776,600 arrivals and 3,776,900 departures in the same period in 2020, and 13,821,600 arrivals and 13,884,000 departures in the same period in 2019.
| The collection of Tourism Statistics at air and sea ports was suspended in March 2020, to protect CSO enumerators and the travelling public. As a result, the details of travel to Ireland classified by country of residence, which were previously presented in the monthly Overseas Travel release, are no longer collected and that release is indefinitely suspended. To help fill the data gap, the CSO is publishing this Air and Sea Travel Statistics release which reports on the numbers of overseas travellers arriving and departing Ireland classified by travel route. The information is compiled primarily from statistics provided by the DAA (Cork and Dublin airports), together with data from other airports and sea ferry operators. The CSO will continue publishing this Air and Sea Travel Statistics release for the duration of the COVID-19 crisis. |
| X-axis label | Arrivals | Departures |
|---|---|---|
| Cross-Channel | 247.7 | 265.6 |
| Continental | 508.1 | 452.8 |
| Transatlantic | 43.2 | 43.3 |
| Other | 22.6 | 19.3 |
| Table 1A: Overseas arrivals by year, month and mode | 000's | |||||||||||||
| Mode | Year | Jan | Feb | Mar | Apr | May | Jun | Jul | Aug | Sep | Oct | Nov | Dec | Total |
| Air | 2019 | 1,174.6 | 1,142.4 | 1,400.5 | 1,596.9 | 1,712.0 | 1,823.7 | 2,017.7 | 2,033.6 | 1,764.4 | 1,646.3 | 1,305.1 | 1,290.4 | 18,907.5 |
| 2020 | 1,195.2 | 1,171.7 | 603.6 | 12.1 | 19.9 | 40.2 | 188.1 | 311.6 | 224.0 | 142.5 | 90.9 | 135.9 | 4,135.7 | |
| 2021 | 101.1 | 50.5 | 55.1 | 61.4 | 73.2 | 136.1 | 326.6 | 720.4 | 1,524.4 | |||||
| Sea | 2019 | 38.6 | 44.9 | 65.4 | 116.0 | 106.8 | 117.4 | 208.1 | 222.9 | 106.7 | 80.8 | 46.3 | 82.2 | 1,236.2 |
| 2020 | 39.9 | 43.4 | 31.3 | 4.0 | 8.4 | 16.9 | 39.2 | 51.0 | 30.4 | 18.5 | 12.9 | 28.5 | 324.5 | |
| 2021 | 6.9 | 4.3 | 6.3 | 8.0 | 12.2 | 23.9 | 54.1 | 101.3 | 217.1 | |||||
| All | 2019 | 1,213.2 | 1,187.3 | 1,465.9 | 1,712.9 | 1,818.9 | 1,941.1 | 2,225.9 | 2,256.5 | 1,871.1 | 1,727.1 | 1,351.4 | 1,372.6 | 20,143.7 |
| 2020 | 1,235.1 | 1,215.1 | 635.0 | 16.1 | 28.3 | 57.1 | 227.3 | 362.6 | 254.4 | 160.9 | 103.9 | 164.4 | 4,460.2 | |
| 2021 | 108.0 | 54.8 | 61.4 | 69.4 | 85.4 | 160.0 | 380.7 | 821.7 | 1,741.5 | |||||
| Table 1B: Overseas departures by year, month and mode | 000's | |||||||||||||
| Mode | Year | Jan | Feb | Mar | Apr | May | Jun | Jul | Aug | Sep | Oct | Nov | Dec | Total |
| Air | 2019 | 1,169.3 | 1,139.1 | 1,375.4 | 1,622.6 | 1,744.0 | 1,933.4 | 2,006.9 | 1,967.5 | 1,757.4 | 1,660.1 | 1,279.1 | 1,320.2 | 18,975.1 |
| 2020 | 1,183.5 | 1,161.9 | 575.6 | 12.8 | 24.7 | 53.1 | 239.0 | 275.5 | 203.5 | 143.7 | 85.1 | 156.1 | 4,114.7 | |
| 2021 | 104.1 | 46.7 | 57.5 | 61.5 | 82.4 | 174.7 | 384.0 | 673.0 | 1,584.0 | |||||
| Sea | 2019 | 52.3 | 42.0 | 61.3 | 113.8 | 107.5 | 147.5 | 177.0 | 224.3 | 111.8 | 79.8 | 49.3 | 63.5 | 1,230.3 |
| 2020 | 56.3 | 41.4 | 26.5 | 4.9 | 11.6 | 20.8 | 36.4 | 52.7 | 33.2 | 19.6 | 11.7 | 22.8 | 338.0 | |
| 2021 | 14.6 | 6.5 | 8.9 | 11.5 | 14.6 | 24.4 | 44.6 | 108.0 | 233.1 | |||||
| All | 2019 | 1,221.6 | 1,181.1 | 1,436.6 | 1,736.4 | 1,851.6 | 2,081.0 | 2,183.9 | 2,191.9 | 1,869.3 | 1,739.9 | 1,328.4 | 1,383.8 | 20,205.3 |
| 2020 | 1,239.8 | 1,203.3 | 602.1 | 17.8 | 36.3 | 73.9 | 275.4 | 328.2 | 236.7 | 163.3 | 96.8 | 178.8 | 4,452.6 | |
| 2021 | 118.7 | 53.2 | 66.5 | 73.0 | 97.0 | 199.1 | 428.6 | 781.0 | 1,817.1 | |||||
| Table 2A: Overseas arrivals by year, month and route | 000's | |||||||||||||
| Route | Year | Jan | Feb | Mar | Apr | May | Jun | Jul | Aug | Sep | Oct | Nov | Dec | Total |
| Cross-Channel | 2019 | 493.1 | 528.2 | 611.9 | 664.6 | 669.9 | 646.7 | 803.2 | 803.7 | 610.7 | 631.4 | 573.7 | 622.9 | 7,660.1 |
| 2020 | 499.9 | 534.2 | 273.1 | 9.3 | 16.4 | 32.3 | 97.1 | 112.6 | 77.0 | 56.4 | 38.8 | 65.1 | 1,812.3 | |
| 2021 | 15.1 | 13.2 | 17.5 | 21.6 | 32.4 | 57.7 | 123.1 | 247.7 | 528.4 | |||||
| Continental | 2019 | 571.1 | 537.7 | 663.6 | 826.6 | 871.5 | 985.4 | 1,114.4 | 1,119.4 | 960.4 | 864.3 | 599.8 | 568.7 | 9,683.0 |
| 2020 | 586.9 | 553.9 | 271.9 | 3.5 | 8.2 | 18.3 | 114.8 | 228.7 | 158.3 | 91.0 | 54.7 | 79.1 | 2,169.5 | |
| 2021 | 79.5 | 31.6 | 34.8 | 40.1 | 45.4 | 87.5 | 217.7 | 508.1 | 1,044.7 | |||||
| Transatlantic | 2019 | 98.4 | 83.4 | 143.3 | 171.9 | 225.7 | 250.5 | 238.1 | 254.4 | 239.2 | 181.0 | 133.8 | 135.9 | 2,155.6 |
| 2020 | 100.5 | 87.8 | 59.9 | 1.2 | 1.7 | 3.8 | 8.8 | 11.6 | 9.8 | 5.6 | 4.7 | 11.7 | 307.0 | |
| 2021 | 4.9 | 2.1 | 2.8 | 3.3 | 4.9 | 11.0 | 26.7 | 43.2 | 98.9 | |||||
| Other | 2019 | 50.7 | 37.9 | 47.1 | 49.8 | 51.7 | 58.5 | 70.1 | 78.9 | 60.8 | 50.4 | 44.1 | 45.2 | 645.1 |
| 2020 | 47.8 | 39.2 | 29.9 | 2.1 | 2.0 | 2.7 | 6.6 | 9.7 | 9.2 | 7.9 | 5.7 | 8.5 | 171.4 | |
| 2021 | 8.4 | 7.9 | 6.3 | 4.4 | 2.7 | 3.8 | 13.2 | 22.6 | 69.4 | |||||
| All | 2019 | 1,213.2 | 1,187.3 | 1,465.9 | 1,712.9 | 1,818.9 | 1,941.1 | 2,225.9 | 2,256.5 | 1,871.1 | 1,727.1 | 1,351.4 | 1,372.6 | 20,143.7 |
| 2020 | 1,235.1 | 1,215.1 | 635.0 | 16.1 | 28.3 | 57.1 | 227.3 | 362.6 | 254.4 | 160.9 | 103.9 | 164.4 | 4,460.2 | |
| 2021 | 108.0 | 54.8 | 61.4 | 69.4 | 85.4 | 160.0 | 380.7 | 821.7 | 1,741.5 | |||||
| Table 2B: Overseas departures by year, month and route | 000's | |||||||||||||
| Route | Year | Jan | Feb | Mar | Apr | May | Jun | Jul | Aug | Sep | Oct | Nov | Dec | Total |
| Cross-Channel | 2019 | 540.4 | 527.2 | 603.1 | 665.2 | 653.5 | 706.1 | 734.4 | 801.0 | 650.5 | 640.0 | 580.3 | 568.9 | 7,670.5 |
| 2020 | 547.1 | 530.0 | 258.9 | 8.8 | 18.7 | 36.8 | 82.8 | 125.4 | 93.5 | 62.5 | 39.6 | 54.8 | 1,858.9 | |
| 2021 | 36.7 | 17.2 | 20.4 | 28.0 | 36.0 | 64.5 | 110.8 | 265.6 | 579.1 | |||||
| Continental | 2019 | 528.7 | 534.3 | 656.3 | 847.6 | 942.2 | 1,063.5 | 1,107.1 | 1,059.1 | 930.4 | 831.4 | 579.1 | 636.1 | 9,715.8 |
| 2020 | 540.7 | 550.7 | 258.9 | 7.3 | 14.6 | 33.3 | 182.4 | 186.0 | 129.3 | 87.9 | 47.1 | 107.1 | 2,145.2 | |
| 2021 | 64.6 | 27.8 | 36.6 | 37.3 | 52.9 | 122.6 | 287.3 | 452.8 | 1,081.8 | |||||
| Transatlantic | 2019 | 103.3 | 82.5 | 137.0 | 175.3 | 208.0 | 246.3 | 268.8 | 259.8 | 232.1 | 209.8 | 130.7 | 131.0 | 2,184.7 |
| 2020 | 104.7 | 86.2 | 62.2 | 0.5 | 1.7 | 2.5 | 4.6 | 7.8 | 6.6 | 5.9 | 4.7 | 7.9 | 295.1 | |
| 2021 | 8.6 | 2.2 | 2.7 | 3.3 | 4.5 | 7.7 | 18.3 | 43.3 | 90.7 | |||||
| Other | 2019 | 49.2 | 37.1 | 40.2 | 48.4 | 47.8 | 65.0 | 73.5 | 71.8 | 56.3 | 58.7 | 38.3 | 47.8 | 634.3 |
| 2020 | 47.4 | 36.4 | 22.2 | 1.2 | 1.3 | 1.3 | 5.6 | 9.0 | 7.4 | 7.1 | 5.3 | 9.1 | 153.3 | |
| 2021 | 8.8 | 5.9 | 6.7 | 4.4 | 3.6 | 4.4 | 12.2 | 19.3 | 65.4 | |||||
| All | 2019 | 1,221.6 | 1,181.1 | 1,436.6 | 1,736.4 | 1,851.6 | 2,081.0 | 2,183.9 | 2,191.9 | 1,869.3 | 1,739.9 | 1,328.4 | 1,383.8 | 20,205.3 |
| 2020 | 1,239.8 | 1,203.3 | 602.1 | 17.8 | 36.3 | 73.9 | 275.4 | 328.2 | 236.7 | 163.3 | 96.8 | 178.8 | 4,452.6 | |
| 2021 | 118.7 | 53.2 | 66.5 | 73.0 | 97.0 | 199.1 | 428.6 | 781.0 | 1,817.1 | |||||
| Table 3A: Overseas arrivals by year, month and routing country | 000's | |||||||||||||
| Routing country | Year | Jan | Feb | Mar | Apr | May | Jun | Jul | Aug | Sep | Oct | Nov | Dec | Total |
| Great Britain | 2019 | 491.8 | 526.8 | 610.2 | 661.7 | 666.7 | 642.5 | 798.2 | 799.0 | 607.6 | 629.7 | 572.2 | 621.2 | 7,627.7 |
| 2020 | 498.7 | 532.6 | 272.3 | 9.3 | 16.4 | 32.3 | 97.1 | 112.6 | 77.0 | 56.4 | 38.8 | 65.1 | 1,808.7 | |
| 2021 | 15.1 | 13.2 | 17.5 | 21.6 | 32.4 | 57.7 | 122.7 | 247.1 | 527.5 | |||||
| Guernsey, Isle of Man, Jersey | 2019 | 1.3 | 1.4 | 1.7 | 2.8 | 3.2 | 4.2 | 5.0 | 4.7 | 3.0 | 1.8 | 1.6 | 1.7 | 32.4 |
| 2020 | 1.2 | 1.5 | 0.8 | 0.0 | 0.0 | 0.0 | 0.0 | 0.0 | 0.0 | 0.0 | 0.0 | 0.0 | 3.6 | |
| 2021 | 0.0 | 0.0 | 0.0 | 0.0 | 0.0 | 0.0 | 0.3 | 0.6 | 1.0 | |||||
| Belgium | 2019 | 19.3 | 20.0 | 23.3 | 22.1 | 21.1 | 19.7 | 21.8 | 20.0 | 19.5 | 22.3 | 21.6 | 21.5 | 252.1 |
| 2020 | 19.2 | 19.7 | 8.3 | 0.1 | 0.3 | 0.6 | 2.7 | 2.4 | 1.8 | 1.5 | 0.9 | 2.2 | 59.8 | |
| 2021 | 1.0 | 0.4 | 0.5 | 0.4 | 0.0 | 1.2 | 4.0 | 8.8 | 16.4 | |||||
| Germany | 2019 | 82.5 | 81.8 | 104.3 | 116.8 | 113.4 | 113.5 | 126.2 | 126.1 | 114.4 | 107.3 | 83.2 | 86.9 | 1,256.3 |
| 2020 | 76.9 | 75.7 | 36.1 | 0.6 | 1.4 | 3.9 | 9.8 | 17.0 | 12.3 | 7.0 | 2.5 | 5.5 | 248.7 | |
| 2021 | 5.0 | 1.8 | 2.3 | 3.2 | 3.4 | 6.8 | 17.2 | 38.2 | 77.9 | |||||
| Spain | 2019 | 121.3 | 107.5 | 137.2 | 195.9 | 215.4 | 267.5 | 292.9 | 301.9 | 244.7 | 224.3 | 127.7 | 99.3 | 2,335.5 |
| 2020 | 119.5 | 110.1 | 67.6 | 0.0 | 0.1 | 0.9 | 23.0 | 33.6 | 19.0 | 13.7 | 12.0 | 13.1 | 412.6 | |
| 2021 | 14.7 | 5.6 | 5.9 | 6.3 | 6.8 | 14.5 | 42.3 | 132.1 | 228.2 | |||||
| France | 2019 | 64.7 | 62.8 | 87.8 | 114.6 | 107.4 | 128.4 | 160.4 | 151.2 | 111.5 | 94.0 | 63.8 | 63.7 | 1,210.3 |
| 2020 | 66.8 | 64.2 | 32.6 | 0.6 | 1.4 | 3.0 | 13.2 | 22.0 | 14.4 | 7.7 | 3.8 | 8.7 | 238.4 | |
| 2021 | 9.8 | 4.7 | 5.1 | 4.0 | 1.5 | 5.6 | 23.1 | 57.1 | 110.8 | |||||
| Italy | 2019 | 40.2 | 43.9 | 48.6 | 65.7 | 70.4 | 86.1 | 101.2 | 99.6 | 84.8 | 74.4 | 49.7 | 41.6 | 806.1 |
| 2020 | 47.2 | 43.8 | 5.6 | 0.0 | 0.0 | 0.4 | 6.9 | 27.3 | 22.4 | 6.6 | 1.6 | 2.1 | 163.9 | |
| 2021 | 3.2 | 1.1 | 1.4 | 0.8 | 0.8 | 4.8 | 14.9 | 41.8 | 68.7 | |||||
| Netherlands | 2019 | 56.2 | 54.9 | 63.1 | 63.7 | 62.3 | 61.9 | 70.1 | 64.4 | 62.0 | 64.4 | 60.9 | 57.7 | 741.5 |
| 2020 | 57.2 | 56.9 | 27.2 | 1.2 | 2.7 | 4.4 | 9.4 | 13.0 | 12.2 | 8.9 | 8.6 | 14.7 | 216.2 | |
| 2021 | 9.2 | 5.2 | 5.2 | 7.3 | 8.2 | 10.0 | 18.5 | 29.2 | 92.8 | |||||
| Poland | 2019 | 44.5 | 35.6 | 40.1 | 43.1 | 44.2 | 40.2 | 43.0 | 45.7 | 43.0 | 44.8 | 42.9 | 45.0 | 512.1 |
| 2020 | 49.6 | 41.3 | 19.1 | 0.1 | 0.1 | 0.4 | 12.7 | 31.7 | 19.6 | 13.5 | 8.1 | 11.2 | 207.4 | |
| 2021 | 11.3 | 3.8 | 4.5 | 4.7 | 6.5 | 12.5 | 26.0 | 43.2 | 112.4 | |||||
| Portugal | 2019 | 22.4 | 20.2 | 26.1 | 61.1 | 75.0 | 82.1 | 92.5 | 95.6 | 86.9 | 68.1 | 29.1 | 23.4 | 682.5 |
| 2020 | 28.4 | 25.8 | 15.8 | 0.2 | 0.7 | 1.5 | 7.4 | 13.0 | 11.7 | 6.6 | 4.7 | 5.4 | 121.1 | |
| 2021 | 6.3 | 1.4 | 1.3 | 1.9 | 2.8 | 5.4 | 13.1 | 42.2 | 74.5 | |||||
| Other EU | 2019 | 87.3 | 79.4 | 94.6 | 104.0 | 120.0 | 139.8 | 156.7 | 161.9 | 146.8 | 124.0 | 92.5 | 100.2 | 1,407.3 |
| 2020 | 90.6 | 84.5 | 43.6 | 0.5 | 1.2 | 2.4 | 24.8 | 60.5 | 40.6 | 22.5 | 11.4 | 13.5 | 396.1 | |
| 2021 | 14.7 | 6.0 | 6.9 | 10.3 | 13.3 | 22.2 | 48.9 | 97.4 | 219.7 | |||||
| Switzerland | 2019 | 17.3 | 16.9 | 20.5 | 22.2 | 22.1 | 23.3 | 28.1 | 26.7 | 23.4 | 21.6 | 13.4 | 15.8 | 251.2 |
| 2020 | 18.0 | 17.9 | 8.3 | 0.0 | 0.0 | 0.5 | 2.5 | 2.9 | 1.5 | 0.7 | 0.2 | 1.5 | 54.1 | |
| 2021 | 1.2 | 0.1 | 0.2 | 0.5 | 0.7 | 1.3 | 5.1 | 8.6 | 17.7 | |||||
| Other Europe | 2019 | 15.5 | 14.7 | 18.0 | 17.5 | 20.2 | 23.1 | 21.4 | 26.3 | 23.5 | 19.1 | 15.1 | 13.8 | 228.2 |
| 2020 | 13.6 | 14.0 | 7.9 | 0.0 | 0.3 | 0.3 | 2.3 | 5.4 | 3.0 | 2.3 | 0.8 | 1.2 | 51.1 | |
| 2021 | 3.0 | 1.6 | 1.5 | 0.7 | 1.4 | 3.2 | 4.7 | 9.6 | 25.6 | |||||
| United States | 2019 | 90.5 | 76.9 | 133.0 | 154.5 | 199.1 | 214.7 | 199.7 | 214.9 | 200.4 | 157.8 | 124.7 | 125.7 | 1,891.7 |
| 2020 | 92.5 | 80.9 | 54.4 | 1.1 | 1.7 | 3.7 | 8.1 | 10.0 | 8.6 | 5.1 | 4.0 | 10.0 | 280.2 | |
| 2021 | 4.1 | 2.0 | 2.7 | 3.3 | 4.9 | 11.0 | 26.7 | 39.9 | 94.5 | |||||
| Other Transatlantic | 2019 | 7.9 | 6.5 | 10.4 | 17.5 | 26.6 | 35.8 | 38.5 | 39.5 | 38.8 | 23.1 | 9.1 | 10.2 | 263.8 |
| 2020 | 8.0 | 6.9 | 5.5 | 0.0 | 0.0 | 0.0 | 0.7 | 1.5 | 1.2 | 0.5 | 0.7 | 1.7 | 26.9 | |
| 2021 | 0.9 | 0.2 | 0.0 | 0.0 | 0.0 | 0.0 | 0.0 | 3.3 | 4.4 | |||||
| United Arab Emirates | 2019 | 29.0 | 21.2 | 26.3 | 25.9 | 24.3 | 28.5 | 33.6 | 37.0 | 28.5 | 22.5 | 25.3 | 28.8 | 330.9 |
| 2020 | 28.5 | 24.5 | 19.0 | 0.1 | 0.1 | 0.9 | 3.6 | 2.7 | 2.6 | 1.9 | 2.1 | 4.6 | 90.6 | |
| 2021 | 3.9 | 4.1 | 1.8 | 0.7 | 0.7 | 1.4 | 7.0 | 5.1 | 24.7 | |||||
| Other Routes | 2019 | 21.7 | 16.7 | 20.8 | 23.8 | 27.4 | 30.0 | 36.5 | 42.0 | 32.3 | 27.8 | 18.8 | 16.4 | 314.2 |
| 2020 | 19.3 | 14.7 | 10.9 | 2.1 | 1.9 | 1.9 | 3.0 | 7.0 | 6.7 | 6.0 | 3.6 | 3.8 | 80.8 | |
| 2021 | 4.6 | 3.9 | 4.5 | 3.7 | 2.0 | 2.4 | 6.2 | 17.5 | 44.7 | |||||
| All | 2019 | 1,213.2 | 1,187.3 | 1,465.9 | 1,712.9 | 1,818.9 | 1,941.1 | 2,225.9 | 2,256.5 | 1,871.1 | 1,727.1 | 1,351.4 | 1,372.6 | 20,143.7 |
| 2020 | 1,235.1 | 1,215.1 | 635.0 | 16.1 | 28.3 | 57.1 | 227.3 | 362.6 | 254.4 | 160.9 | 103.9 | 164.4 | 4,460.2 | |
| 2021 | 108.0 | 54.8 | 61.4 | 69.4 | 85.4 | 160.0 | 380.7 | 821.7 | 1,741.5 | |||||
| Table 3B: Overseas departures by year, month and routing country | 000's | |||||||||||||
| Routing country | Year | Jan | Feb | Mar | Apr | May | Jun | Jul | Aug | Sep | Oct | Nov | Dec | Total |
| Great Britain | 2019 | 538.9 | 525.8 | 601.5 | 662.0 | 649.6 | 702.1 | 729.7 | 796.3 | 647.3 | 638.2 | 578.7 | 567.3 | 7,637.4 |
| 2020 | 545.7 | 528.4 | 257.9 | 8.8 | 18.7 | 36.8 | 82.8 | 125.4 | 93.5 | 62.5 | 39.6 | 54.8 | 1,855.0 | |
| 2021 | 36.7 | 17.2 | 20.4 | 28.0 | 36.0 | 64.5 | 110.4 | 264.9 | 578.1 | |||||
| Guernsey, Isle of Man, Jersey | 2019 | 1.5 | 1.4 | 1.7 | 3.1 | 4.0 | 4.0 | 4.7 | 4.7 | 3.2 | 1.7 | 1.6 | 1.6 | 33.1 |
| 2020 | 1.4 | 1.6 | 1.0 | 0.0 | 0.0 | 0.0 | 0.0 | 0.0 | 0.0 | 0.0 | 0.0 | 0.0 | 3.9 | |
| 2021 | 0.0 | 0.0 | 0.0 | 0.0 | 0.0 | 0.0 | 0.3 | 0.7 | 1.0 | |||||
| Belgium | 2019 | 19.3 | 19.4 | 23.2 | 21.5 | 21.4 | 20.5 | 20.4 | 20.2 | 19.4 | 21.7 | 22.7 | 21.1 | 250.9 |
| 2020 | 19.2 | 19.2 | 8.8 | 0.2 | 0.7 | 1.3 | 2.5 | 2.5 | 1.7 | 1.3 | 0.8 | 2.0 | 60.1 | |
| 2021 | 1.4 | 0.4 | 0.6 | 0.5 | 0.0 | 1.1 | 3.0 | 9.2 | 16.1 | |||||
| Germany | 2019 | 79.1 | 77.9 | 102.2 | 113.5 | 114.5 | 123.5 | 125.8 | 120.1 | 114.6 | 112.0 | 86.2 | 91.7 | 1,261.0 |
| 2020 | 74.5 | 72.7 | 40.2 | 1.2 | 2.1 | 6.6 | 13.1 | 13.7 | 10.8 | 7.8 | 2.3 | 6.2 | 251.1 | |
| 2021 | 4.9 | 1.2 | 2.2 | 2.2 | 4.0 | 8.0 | 17.7 | 32.9 | 73.1 | |||||
| Spain | 2019 | 105.5 | 109.9 | 138.2 | 209.2 | 237.6 | 279.0 | 295.5 | 273.9 | 243.8 | 208.1 | 110.4 | 123.5 | 2,334.5 |
| 2020 | 101.7 | 113.8 | 50.6 | 0.1 | 0.4 | 2.3 | 38.5 | 22.8 | 17.7 | 15.9 | 9.7 | 19.2 | 392.7 | |
| 2021 | 11.7 | 4.3 | 5.8 | 5.0 | 7.3 | 18.8 | 66.4 | 121.2 | 240.5 | |||||
| France | 2019 | 60.4 | 60.6 | 85.7 | 112.3 | 122.9 | 150.5 | 146.4 | 152.0 | 106.5 | 88.0 | 67.1 | 69.0 | 1,221.4 |
| 2020 | 63.6 | 63.1 | 34.2 | 1.4 | 3.4 | 5.7 | 20.1 | 17.7 | 10.7 | 7.6 | 3.2 | 11.0 | 241.7 | |
| 2021 | 8.1 | 4.3 | 5.3 | 4.1 | 4.1 | 8.5 | 27.4 | 52.9 | 114.7 | |||||
| Italy | 2019 | 36.5 | 43.6 | 47.8 | 69.0 | 78.9 | 88.6 | 98.4 | 96.2 | 84.2 | 68.1 | 45.7 | 47.7 | 804.8 |
| 2020 | 42.7 | 42.5 | 5.8 | 0.1 | 0.4 | 1.2 | 14.7 | 23.3 | 18.6 | 5.7 | 1.1 | 3.8 | 159.9 | |
| 2021 | 2.0 | 1.1 | 1.5 | 0.9 | 1.0 | 7.2 | 20.1 | 36.1 | 69.9 | |||||
| Netherlands | 2019 | 57.4 | 54.6 | 62.5 | 61.3 | 65.0 | 67.1 | 64.2 | 66.9 | 61.0 | 65.3 | 61.3 | 57.3 | 743.8 |
| 2020 | 58.4 | 55.0 | 26.5 | 2.0 | 4.1 | 6.2 | 9.4 | 12.7 | 10.3 | 8.3 | 8.5 | 15.3 | 216.6 | |
| 2021 | 8.4 | 4.5 | 5.8 | 6.1 | 9.1 | 10.6 | 15.5 | 28.5 | 88.5 | |||||
| Poland | 2019 | 38.3 | 35.9 | 39.6 | 44.8 | 45.0 | 44.4 | 46.2 | 42.4 | 40.4 | 45.0 | 41.7 | 52.4 | 516.0 |
| 2020 | 42.7 | 41.7 | 19.3 | 0.4 | 0.1 | 0.6 | 23.8 | 23.9 | 17.6 | 13.4 | 6.4 | 17.2 | 207.1 | |
| 2021 | 7.1 | 4.2 | 4.6 | 4.7 | 7.8 | 20.6 | 36.5 | 33.4 | 119.1 | |||||
| Portugal | 2019 | 19.0 | 21.0 | 27.3 | 67.5 | 83.1 | 88.9 | 94.6 | 85.7 | 84.5 | 61.6 | 24.7 | 28.9 | 686.8 |
| 2020 | 23.0 | 26.8 | 13.5 | 0.2 | 1.1 | 2.8 | 11.2 | 9.7 | 9.0 | 6.5 | 4.0 | 8.1 | 115.9 | |
| 2021 | 4.5 | 1.0 | 1.7 | 2.3 | 3.6 | 7.0 | 20.6 | 40.5 | 81.1 | |||||
| Other EU | 2019 | 81.9 | 80.3 | 93.0 | 110.9 | 131.2 | 151.6 | 164.2 | 150.5 | 132.2 | 119.8 | 91.2 | 110.5 | 1,417.2 |
| 2020 | 84.5 | 84.5 | 44.1 | 1.3 | 1.7 | 4.9 | 42.1 | 53.3 | 29.5 | 19.0 | 10.0 | 19.5 | 394.5 | |
| 2021 | 12.7 | 5.5 | 8.0 | 10.4 | 13.6 | 33.8 | 68.8 | 83.4 | 236.2 | |||||
| Switzerland | 2019 | 17.7 | 16.9 | 19.9 | 20.1 | 22.1 | 25.2 | 26.3 | 27.7 | 23.3 | 22.0 | 14.1 | 17.1 | 252.3 |
| 2020 | 18.5 | 17.9 | 7.8 | 0.0 | 0.0 | 1.2 | 2.5 | 2.7 | 1.4 | 0.7 | 0.2 | 1.7 | 54.6 | |
| 2021 | 1.8 | 0.2 | 0.2 | 0.3 | 0.7 | 1.4 | 3.8 | 8.7 | 17.0 | |||||
| Other Europe | 2019 | 13.6 | 14.2 | 17.1 | 17.5 | 20.5 | 24.2 | 25.3 | 23.8 | 20.6 | 19.7 | 14.0 | 16.9 | 227.2 |
| 2020 | 11.8 | 13.4 | 8.0 | 0.2 | 0.7 | 0.5 | 4.6 | 3.7 | 2.0 | 1.9 | 0.7 | 3.2 | 50.7 | |
| 2021 | 2.1 | 1.1 | 1.0 | 0.9 | 1.7 | 5.6 | 7.5 | 5.9 | 25.8 | |||||
| United States | 2019 | 95.4 | 75.8 | 126.4 | 158.4 | 181.3 | 208.2 | 227.6 | 220.0 | 195.7 | 183.1 | 121.2 | 120.5 | 1,913.3 |
| 2020 | 96.4 | 79.5 | 54.6 | 0.5 | 1.7 | 2.4 | 4.0 | 6.9 | 5.9 | 5.2 | 4.1 | 6.3 | 267.7 | |
| 2021 | 7.2 | 2.0 | 2.7 | 3.3 | 4.5 | 7.7 | 18.3 | 40.5 | 86.2 | |||||
| Other Transatlantic | 2019 | 7.9 | 6.7 | 10.6 | 16.9 | 26.7 | 38.1 | 41.3 | 39.9 | 36.4 | 26.7 | 9.6 | 10.5 | 271.4 |
| 2020 | 8.3 | 6.7 | 7.6 | 0.0 | 0.0 | 0.0 | 0.5 | 0.8 | 0.6 | 0.7 | 0.7 | 1.5 | 27.4 | |
| 2021 | 1.4 | 0.2 | 0.1 | 0.0 | 0.0 | 0.0 | 0.0 | 2.7 | 4.5 | |||||
| United Arab Emirates | 2019 | 28.4 | 20.8 | 22.0 | 24.5 | 19.7 | 32.5 | 33.9 | 35.0 | 27.6 | 30.2 | 23.0 | 29.4 | 327.0 |
| 2020 | 29.9 | 22.7 | 13.7 | 0.0 | 0.0 | 0.2 | 1.1 | 3.2 | 1.5 | 1.9 | 2.3 | 5.2 | 81.7 | |
| 2021 | 4.6 | 2.4 | 1.8 | 1.2 | 1.1 | 1.3 | 2.8 | 7.7 | 22.9 | |||||
| Other Routes | 2019 | 20.8 | 16.3 | 18.3 | 23.8 | 28.1 | 32.6 | 39.6 | 36.9 | 28.8 | 28.5 | 15.3 | 18.4 | 307.3 |
| 2020 | 17.4 | 13.7 | 8.4 | 1.2 | 1.3 | 1.2 | 4.5 | 5.8 | 5.9 | 5.2 | 3.1 | 3.9 | 71.6 | |
| 2021 | 4.2 | 3.5 | 4.9 | 3.2 | 2.5 | 3.1 | 9.4 | 11.6 | 42.6 | |||||
| All | 2019 | 1,221.6 | 1,181.1 | 1,436.6 | 1,736.4 | 1,851.6 | 2,081.0 | 2,183.9 | 2,191.9 | 1,869.3 | 1,739.9 | 1,328.4 | 1,383.8 | 20,205.3 |
| 2020 | 1,239.8 | 1,203.3 | 602.1 | 17.8 | 36.3 | 73.9 | 275.4 | 328.2 | 236.7 | 163.3 | 96.8 | 178.8 | 4,452.6 | |
| 2021 | 118.7 | 53.2 | 66.5 | 73.0 | 97.0 | 199.1 | 428.6 | 781.0 | 1,817.1 | |||||
Monthly.
Overseas Travel.
This release covers overseas travel into and out of the Republic of Ireland. Cross-border travel and domestic travel within the Republic of Ireland are excluded.
This release is based on administrative data provided by Irish airports and passenger data provided by the sea carrier companies operating ferries to and from Ireland.
Individual figures have been rounded independently and the sum of the component items may therefore not necessarily add to the totals shown.
As the statistics in this release are reproduced directly from administrative data they are considered reliable.
As the statistics in this release are persons arriving and departing, they are not directly comparable with the previous Overseas Travel release, which reported the number of overseas trips. In addition, the previous Overseas Travel series specifically excluded residents of Northern Ireland. No country of residence information is available for the compilation of these Air and Sea Travel statistics, so all countries of residence are necessarily included.
The statistics in this release are not fully coherent with separate Transport aviation and maritime statistical series published by the CSO. The Air and Sea Travel statistics exclude domestic air travel and flights to Northern Ireland. The Air and Sea Travel statistics also exclude commercial drivers on sea routes.
Arrivals are all people disembarking at the airports in Cork, Dublin, Galway, Kerry, Knock, Shannon or Waterford or the seaports in Dublin, Dun Laoghaire, Ringaskiddy or Rosslare from destinations not on the island of Ireland. Transfer passengers are included while domestic air passengers and cruise passengers are excluded.
The same definition is used for departures, but refers to people embarking for destinations not on the island of Ireland.
Mode refers to the method of travel – air or sea. Air refers to all people who arrive or depart by commercial airliners (excluding the crew), while sea covers arrivals or departures by commercial passenger vessels, (excluding the crew and commercial drivers).
For convenience, all people arriving or departing overseas are allocated to one of four entry or exit routes. These are cross-channel (Great Britain, Isle of Man and the Channel Islands), continental (other European countries), Transatlantic (North & South America, including the Caribbean) and Other (Asia, Africa, Oceania, etc.).
All routes are broken down into separate countries and country groupings. These refer to the country of departure for the flight or sea crossing for an arriving person, or the country of arrival for a person who departs. The country does not refer to the country of residence or country of origin or destination for the person travelling (this information was previously published in the ‘Overseas Travel’ releases). For example, a person who flies from John F Kennedy airport (United States of America) to Heathrow (Great Britain) and then to Ireland will be counted as arriving from Great Britain, as this is where their flight to Ireland originated.
Transfer passengers or 'connecting passengers' are defined as those who make a stop at an airport without any particular purpose other than being en route to another destination. Transfer passengers disembark from their aircraft and pass through the airport en route to their connecting flight. The two flights must be booked on the same ticket for it to be considered a transfer. A transfer trip is a completed journey – for example a passenger who travels from London Gatwick to Dublin Airport and then on to New York (on the one ticket) is counted as two transfer passengers and one transfer trip.
| Dublin Transfer Passengers (000's) | ||||||||||
| Month | 2012 | 2013 | 2014 | 2015 | 2016 | 2017 | 2018 | 2019 | 2020 | 2021 |
| Jan | 20 | 28 | 31 | 35 | 55 | 79 | 88 | 108 | 111 | 5 |
| Feb | 15 | 19 | 18 | 22 | 33 | 59 | 67 | 76 | 79 | 4 |
| Mar | 18 | 20 | 25 | 30 | 51 | 85 | 94 | 126 | 53 | 2 |
| Apr | 31 | 38 | 57 | 66 | 86 | 130 | 157 | 171 | 0 | 3 |
| May | 39 | 54 | 75 | 89 | 105 | 144 | 161 | 179 | 1 | 4 |
| Jun | 51 | 72 | 96 | 110 | 119 | 157 | 185 | 186 | 3 | 7 |
| Jul | 43 | 66 | 96 | 127 | 121 | 158 | 199 | 195 | 9 | 15 |
| Aug | 47 | 82 | 109 | 142 | 139 | 194 | 229 | 223 | 13 | 21 |
| Sep | 34 | 50 | 78 | 102 | 124 | 158 | 191 | 194 | 11 | |
| Oct | 33 | 46 | 72 | 91 | 142 | 160 | 187 | 186 | 7 | |
| Nov | 34 | 33 | 42 | 61 | 84 | 118 | 136 | 141 | 4 | |
| Dec | 37 | 41 | 51 | 74 | 107 | 128 | 155 | 155 | 7 | |
| Year | 402 | 548 | 749 | 949 | 1,167 | 1,569 | 1,850 | 1,939 | 297 | 62 |
| Source: daa | ||||||||||
There were 21,000 transfer passengers handled by Dublin Airport in August 2021. This compares to 13,000 in August 2020, an increase of 68%.
 Hide Background Notes
Scan the QR code below to view this release online or go to
http://www.cso.ie/en/releasesandpublications/er/ast/airandseatravelstatisticsaugust2021/
 Show Table 1A Overseas arrivals by year, month and mode
 Hide Table 1A Overseas arrivals by year, month and mode