
| Annual Services Inquiry (ASI) - Services and Distribution enterprises, 2008-2014 | |||||||||
| % change | |||||||||
| 2008 | 2009 | 2010 | 2011 | 2012 | 2013 | 2014 | 2008 - 2014 | 2013 - 2014 | |
| Gross Value Added (€ million) | 61,863 | 58,161 | 57,332 | 59,091 | 63,149 | 68,467 | 73,354 | 18.6 | 7.1 |
| Turnover (€ million) | 275,729 | 261,017 | 252,955 | 265,743 | 283,396 | 292,540 | 318,981 | 15.7 | 9.0 |
| Enterprises (number) | 175,188 | 179,965 | 182,787 | 183,863 | 188,364 | 188,475 | 185,531 | 5.9 | -1.6 |
| Persons engaged (number) | 1,041,980 | 960,348 | 926,542 | 925,658 | 939,243 | 961,338 | 989,230 | -5.1 | 2.9 |
This release provides data on the Services and Distribution sector in Ireland for the period 2008 - 2014. Revised figures for 2008 - 2012 are included, along with newly published figures for 2013 and 2014. The detailed tables present a breakdown of the numbers of active Services and Distribution enterprises, numbers of persons engaged in Services and Distribution sectors, as well as a range of financial information classified by: economic activity, employment size and nationality.
The Services and Distribution series 2008 - 2012 has been revised due to a number of factors:
(i)There are now more active enterprises on the CSO Business Register. There are now more enterprises considered active in the Services and Distribution sector per the CSO Business Register. These enterprises need to be measured. What is considered an active enterprise per the register of active enterprises in Ireland will determine its inclusion in the Services and Distribution series. Size class thresholds will no longer be applied. For example, the Services and Distribution series previously didn't estimate for enterprises with zero persons engaged.
(ii) Updates in the National Accounts series. Under rules for the compilation of EU National Accounts (ESA 2010) a number of data series have been updated. For the Services and Distribution series, this principally concerns estimates for Research & Development (R&D). Estimates of R&D spend are now higher, and more of this R&D spend is being capitalised. This has the effect of increasing the estimate of Services and Distribution Gross Value Added. Updated estimates for the aircraft leasing sector are also included.
(iii) Non-response treatment & the greater use of administrative data. As part of the methodological review we have examined our methodology for non-respondents. We have aligned our non-response methodology more closely to the use of available administrative (tax) data and changed how we estimate for non-response. These new estimates for non-response are now incorporated into the Services and Distribution series, replacing the previous grossing/imputation methodology.
(iv) Other adjustments. During the review, the opportunity was taken to update the series for some sectoral NACE adjustments (enterprises being reclassified from one particular NACE sector to another), and updates to some Multinational Enterprise data measured by our National Accounts Large Cases Unit are also incorporated.
| Original Series | Revised Series | |
| 2008 | 122047 | 175188 |
| 2009 | 124681 | 179965 |
| 2010 | 124758 | 182787 |
| 2011 | 123017 | 183863 |
| 2012 | 122126 | 188364 |
| 2013 | 122315 | 188475 |
| 2014 | 185531 |
Main differences following revisions
Impact on number of enterprises & employment
As a result of incorporating the above revisions, more enterprises are now being measured for the Services and Distribution sector in Ireland. The original series measured around 123,000 enterprises. The revised series measures approximately 183,000 enterprises. This increase is mainly due to the removal of the size class threshold. See Figure 2.
| Original Series | Revised Series | |
| 2008 | 995777 | 1041980 |
| 2009 | 918548 | 960348 |
| 2010 | 891191 | 926542 |
| 2011 | 893299 | 925658 |
| 2012 | 903657 | 939243 |
| 2013 | 921576 | 961338 |
| 2014 | 989230 |
Including these new enterprises has far less impact on employment levels in the Services and Distribution sector. The new estimates for the Services and Distribution sector employment levels are around 4% higher than the original series, despite the very large increase in the number of enterprises. See Figure 3.
For the original series, the split between persons engaged in Irish and foreign owned Services and Distribution enterprises was 80/20 in favour of Irish owned enterprises. This breakdown adjusted to around 78/22 after all revisions had been implemented.
| Original Series | Revised Series | |
| 2008 | 52.532 | 61.863155 |
| 2009 | 45.838 | 58.160985 |
| 2010 | 46.532 | 57.332301 |
| 2011 | 48.99 | 59.090947 |
| 2012 | 49.32 | 63.149301 |
| 2013 | 54.011 | 68.466952 |
| 2014 | 73.354 |
Impact on Services and Distribution Gross Value Added
Updating the Services and Distribution series for the methodological improvements referenced above (in particular counting more enterprises and the positive impact of certain Research & Development capitalisation on Gross Value Added (GVA) levels) , results in higher estimates for GVA – an increase in the range of 17-28%, depending on the year. See Figure 4.
For the original series, the GVA split between Irish and foreign owned Services and Distribution enterprises was 60/40 in favour of Irish owned enterprises. Following the revisions, the split is still in favour of Irish owned enterprises but the split is now 57/43.
Services and Distribution sector in Ireland 2008-14 – main trends
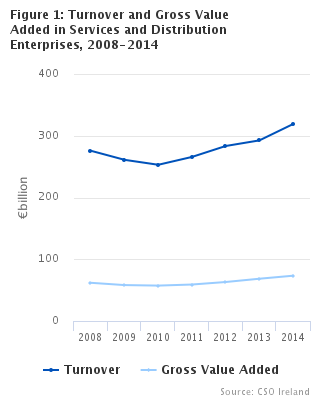
GVA for Services and Distribution enterprises increased by 18.6% from €61.9bn in 2008 to €73.4bn in 2014. Over the same period, turnover went from €275.7bn to €319.0bn, an increase of 15.7%. While the number of Services and Distribution enterprises increased by 5.9% from 175,188 in 2008 to 185,531 in 2014, the number of persons engaged in these Services and Distribution enterprises declined by 5.1% from 1,041,980 to 989,230. See Headline Table, Figures 3 and 4.
Services and Distribution in Ireland, year on year changes 2013-14
In 2014, there was an annual increase in GVA of 7.1% from €68.5bn in 2013 to €73.4bn. The year on year change in Services and Distribution turnover was 9.0% up from €292.5bn in 2013 to €319.0bn in 2014. While the number of enterprises was down marginally from 188,475 in 2013 to 185,531 in 2014, the number of persons engaged in these enterprises rose 2.9% from 961,338 to 989,230. See Headline Table, Figures 3 and 4.
Sectoral composition analysis
| Percentage GVA | |
| Wholesale and retail trade; repair of motor vehicles and motorcycles (G) | 29.9791474710247 |
| Transportation and storage (H) | 11.4365614341367 |
| Accommodation and food service activities (I) | 6.19433263824903 |
| Information and communication (J) | 19.1099688020303 |
| Real estate activities (L) | 1.66658584291095 |
| Professional, scientific and technical activities (M) | 14.4415886717424 |
| Administrative and support service activities (N) | 13.2405476617687 |
| Other service activities (92,93,95,96) | 3.93126747813717 |
| Percentage GVA | |
| Wholesale and retail trade; repair of motor vehicles and motorcycles (G) | 24.6053384955149 |
| Transportation and storage (H) | 9.44733756850342 |
| Accommodation and food service activities (I) | 5.35076478446983 |
| Information and communication (J) | 30.7358835237342 |
| Real estate activities (L) | 1.94808735719933 |
| Professional, scientific and technical activities (M) | 11.7703192736592 |
| Administrative and support service activities (N) | 13.3953158655288 |
| Other service activities (92,93,95,96) | 2.74695313139024 |
| Small and medium enterprises | Large enterprises | |
| 2008 | 42.240583 | 19.622572 |
| 2009 | 38.236802 | 19.924183 |
| 2010 | 35.86088 | 21.471421 |
| 2011 | 37.551956 | 21.53899 |
| 2012 | 39.148746 | 23.998967 |
| 2013 | 43.115759 | 25.35119 |
| 2014 | 43.230144 | 30.123917 |
GVA by enterprise size class
| Small and medium enterprises | Large enterprises | |
| 2008 | 778805 | 263175 |
| 2009 | 712709 | 247639 |
| 2010 | 690379 | 236163 |
| 2011 | 691124 | 234534 |
| 2012 | 698978 | 240265 |
| 2013 | 710696 | 250642 |
| 2014 | 734864 | 254366 |
Persons engaged by size class
| Irish owned | Foreign owned | |
| 2008 | 41.154071 | 20.709085 |
| 2009 | 35.641497 | 22.519488 |
| 2010 | 32.878971 | 24.45333 |
| 2011 | 34.206756 | 24.884191 |
| 2012 | 36.348413 | 26.800889 |
| 2013 | 39.171847 | 29.295105 |
| 2014 | 41.245561 | 32.108503 |
GVA by nationality of ownership
| Irish owned | Foreign owned | |
| 2008 | 839378 | 202602 |
| 2009 | 756375 | 203973 |
| 2010 | 723060 | 203482 |
| 2011 | 718149 | 207509 |
| 2012 | 720606 | 218637 |
| 2013 | 734550 | 226788 |
| 2014 | 761785 | 227445 |
Persons engaged in Services and Distribution by nationality of ownership
Please note: Additional analysis for Services and Distribution sectors in Ireland, including international comparisons, will be available in the Business in Ireland publication. This is due to be published by the end of November.
Background Notes Annual Services Inquiry 2014
The Annual Services Inquiry (ASI) has been conducted on annual basis since 1991. The purpose of the survey is to provide estimates of the principal trading aggregates for all enterprises in the retail, wholesale, transportation and storage, accommodation and food, information and communication, real estate, professional, scientific, technical, administrative and other selected services sectors.
Legislation
This Statutory Inquiry is conducted under the Statistics (Structural Business Inquiries) Order 2013 (S.I. No.44 of 2013), made under the Statistics Act 1993 and Regulation (EC) No. 295 of 2008 of the European Parliament and of the Council concerning structural business statistics.
Central Business Register
The CSO’s Central Business Register provides the sampling frame from which the Annual Services Inquiry sample is selected each year. The Business Register is updated continuously throughout the year.
Sample Design
The ASI is designed to provide estimates of the principal trading aggregates for all enterprises in the relevant sectors. The ‘enterprise’ is the unit used for survey purposes i.e. one return is sought in respect of each enterprise covering all constituent branches, local units or subsidiaries. The sample is selected based on number of persons engaged in the enterprise i.e. number of proprietors plus number of full-time and part-time staff. A census of enterprises with 20 or more persons engaged is selected. In addition a stratified random sample is selected for the enterprises with less than 20 persons engaged, with decreasing sampling proportions taken in the lower persons engaged ranges. All enterprises with 1 or more persons engaged are included in the survey frame. However, the units with less than 2 persons engaged are not surveyed; the data for those are imputed directly from administrative data sources.
Use of Administrative data
The original series was aggregated using grossing factors. This method has been revised in the new series. Instead of grossing, the use of administrative (tax ) data is used instead.
For every non-respondent or non-surveyed enterprise a survey return is created using tax information. The primary financial value the survey uses is profit/loss data with estimates for labour costs added to arrive at a value for GVA. This is derived from the administrative data. Other financial variables normally received from the survey form are estimated using actual survey returns as the data is not available from the administrative data. This is done using ratio-estimators. A basic example of the concept would be the ratio of turnover to gva. If the ratio for a particular Nace is 4:1 for turnover to GVA, we would simply multiply the derived administrative GVA by 4 to give us a turnover value.
Number of Persons Engaged includes all full time and part-time employees. It also includes proprietors, partners and family members who work for an enterprise. It excludes agency workers.
Service and Distribution in EU27 Ireland includes NACE groups G-N (excl K) and R92, R93, S95and S96. The other EU Countries include NACE groups G-N (excl K) and S95.
 Hide Background Notes
Scan the QR code below to view this release online or go to
http://www.cso.ie/en/releasesandpublications/er/asi/annualservicesinquiry2014/
 Show Background Notes
 Hide Background Notes