
| Number of passengers handled by main Irish airports | |||
| 2018 | 2019 | % change | |
| Quarter 4 | 8,419,130 | 8,540,952 | +1.4 |
| January to December | 36,525,288 | 38,053,418 | +4.2 |
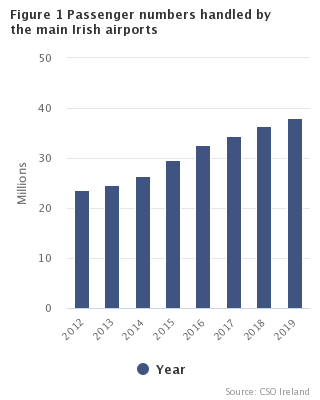
In 2019, 38.1 million passengers passed through the main Irish airports, an increase of 4.2% over the previous year. See table 1.
In the fourth quarter of 2019, over 8.5 million passengers passed through the main Irish airports, an increase of 1.4% over the same period in 2018.
Passenger numbers increased in 2019 in all airports except for Shannon which decreased. It should be noted that Shannon airport is a fuel stop for many transit flights that are not included in this release. The five main airports accounted for 99.8% of all air passenger numbers while Dublin airport accounted for 85.7% of all air passengers carried in 2019. See table 2.
The results also show that:
| Passenger number distribution by airport, 2019 | |
| Dublin | 85.7 |
| Cork | 6.8 |
| Shannon | 4.2 |
| Other | 3.3 |
| Passenger number distribution by airport, 2015 | |
| Dublin | 83.9 |
| Cork | 6.9 |
| Shannon | 5.5 |
| Other | 3.7 |
| Table 1: Number of passengers handled by main airports, Quarter 4 and Year 2017-2019 | |||||||||
| Airport | Quarter 4 | January to December | |||||||
| 2017 | 2018 | 2019 | % change 2018-2019 | 2017 | 2018 | 2019 | % change 2018-2019 | ||
| Dublin | 6,805,197 | 7,292,712 | 7,385,982 | +1.3 | 29,454,474 | 31,319,419 | 32,676,251 | +4.3 | |
| Cork | 493,363 | 520,533 | 550,423 | +5.7 | 2,301,450 | 2,387,806 | 2,585,466 | +8.3 | |
| Shannon | 341,394 | 353,012 | 341,416 | -3.3 | 1,599,390 | 1,677,661 | 1,616,422 | -3.7 | |
| Knock | 160,780 | 170,600 | 180,453 | +5.8 | 748,505 | 775,063 | 805,443 | +3.9 | |
| Kerry | 75,744 | 82,273 | 82,678 | +0.5 | 335,480 | 365,339 | 369,836 | +1.2 | |
| Total | 7,876,478 | 8,419,130 | 8,540,952 | +1.4 | 34,439,299 | 36,525,288 | 38,053,418 | +4.2 | |
| Table 2: Total passenger numbers handled by all airports, 2015 - 2019 | ||||||
| Airport | 2015 | 2016 | 2017 | 2018 | 2019 | % change 2018-2019 |
| Dublin | 24,962,518 | 27,778,888 | 29,454,474 | 31,319,419 | 32,676,251 | +4.3 |
| Cork | 2,065,678 | 2,226,233 | 2,301,450 | 2,387,806 | 2,585,466 | +8.3 |
| Shannon | 1,642,888 | 1,674,567 | 1,599,390 | 1,677,661 | 1,616,422 | -3.7 |
| Knock | 684,671 | 735,869 | 748,505 | 775,063 | 805,443 | +3.9 |
| Kerry | 303,039 | 325,670 | 335,480 | 365,339 | 369,836 | +1.2 |
| Donegal | 36,552 | 44,156 | 46,514 | 46,537 | 48,542 | +4.3 |
| Connemara | 19,753 | 21,345 | 16,437 | 15,322 | 15,382 | +0.4 |
| Inishmore | 12,071 | 12,667 | 9,335 | 8,814 | 8,831 | +0.2 |
| Waterford1 | 34,249 | 13,511 | 0 | 0 | 0 | - |
| Total | 29,761,419 | 32,832,906 | 34,511,585 | 36,595,961 | 38,126,173 | +4.2 |
| 1 No commercial flights since June 2016 from Waterford airport | ||||||
| Table 3: Passenger numbers by month handled by main airports, 2019 | ||||||
| Month | Cork | Dublin | Kerry | Knock | Shannon | Total |
| January | 148,939 | 2,054,794 | 20,829 | 42,413 | 87,016 | 2,353,991 |
| February | 150,482 | 1,993,325 | 22,231 | 45,456 | 82,497 | 2,293,991 |
| March | 174,876 | 2,432,195 | 25,546 | 54,700 | 100,374 | 2,787,691 |
| April | 210,510 | 2,789,660 | 32,171 | 71,563 | 128,840 | 3,232,744 |
| May | 239,077 | 2,965,517 | 34,213 | 73,850 | 160,902 | 3,473,559 |
| June | 278,961 | 3,202,409 | 36,150 | 77,020 | 178,680 | 3,773,220 |
| July | 296,876 | 3,430,859 | 40,680 | 88,781 | 183,398 | 4,040,594 |
| August | 296,799 | 3,399,714 | 39,617 | 94,907 | 187,029 | 4,018,066 |
| September | 238,523 | 3,021,796 | 35,721 | 76,300 | 166,270 | 3,538,610 |
| October | 215,482 | 2,865,397 | 31,790 | 72,299 | 138,218 | 3,323,186 |
| November | 171,693 | 2,240,194 | 25,151 | 55,255 | 104,148 | 2,596,441 |
| December | 163,248 | 2,280,391 | 25,737 | 52,899 | 99,050 | 2,621,325 |
| Total | 2,585,466 | 32,676,251 | 369,836 | 805,443 | 1,616,422 | 38,053,418 |
| Table 4: Passenger numbers classified by arrivals and departures handled by main airports, Quarter 4 and Year 2017-2019 | |||||||
| Quarter 4 | January to December | ||||||
| 2017 | 2018 | 2019 | 2017 | 2018 | 2019 | ||
| Arrivals | |||||||
| Cork | 248,826 | 262,153 | 276,943 | 1,148,709 | 1,190,375 | 1,290,701 | |
| Dublin | 3,396,688 | 3,631,532 | 3,681,170 | 14,710,843 | 15,634,251 | 16,318,334 | |
| Kerry | 37,690 | 41,119 | 41,469 | 166,207 | 181,656 | 183,484 | |
| Knock | 81,472 | 86,454 | 91,545 | 370,695 | 385,170 | 399,484 | |
| Shannon | 170,361 | 176,216 | 170,815 | 791,501 | 833,275 | 803,878 | |
| Total arrivals | 3,935,037 | 4,197,474 | 4,261,942 | 17,187,955 | 18,224,727 | 18,995,881 | |
| Departures | |||||||
| Cork | 244,537 | 258,380 | 273,480 | 1,152,741 | 1,197,431 | 1,294,765 | |
| Dublin | 3,408,509 | 3,661,180 | 3,704,812 | 14,743,631 | 15,685,168 | 16,357,917 | |
| Kerry | 38,054 | 41,154 | 41,209 | 169,273 | 183,683 | 186,352 | |
| Knock | 79,308 | 84,146 | 88,908 | 377,810 | 389,893 | 405,959 | |
| Shannon | 171,033 | 176,796 | 170,601 | 807,889 | 844,386 | 812,544 | |
| Total departures | 3,941,441 | 4,221,656 | 4,279,010 | 17,251,344 | 18,300,561 | 19,057,537 | |
| All | |||||||
| Cork | 493,363 | 520,533 | 550,423 | 2,301,450 | 2,387,806 | 2,585,466 | |
| Dublin | 6,805,197 | 7,292,712 | 7,385,982 | 29,454,474 | 31,319,419 | 32,676,251 | |
| Kerry | 75,744 | 82,273 | 82,678 | 335,480 | 365,339 | 369,836 | |
| Knock | 160,780 | 170,600 | 180,453 | 748,505 | 775,063 | 805,443 | |
| Shannon | 341,394 | 353,012 | 341,416 | 1,599,390 | 1,677,661 | 1,616,422 | |
| Total passengers | 7,876,478 | 8,419,130 | 8,540,952 | 34,439,299 | 36,525,288 | 38,053,418 | |
| Table 5: Number of flights classified by arrivals and departures handled by main airports, Quarter 4 and Year 2019 | |||
| Quarter 4 | January to December | ||
| Arrivals | |||
| Cork | 2,306 | 10,729 | |
| Dublin | 26,551 | 114,626 | |
| Kerry | 397 | 1,743 | |
| Knock | 722 | 3,174 | |
| Shannon | 1,446 | 6,568 | |
| Total arrivals | 31,422 | 136,840 | |
| Departures | |||
| Cork | 2,295 | 10,713 | |
| Dublin | 26,505 | 114,517 | |
| Kerry | 400 | 1,749 | |
| Knock | 719 | 3,156 | |
| Shannon | 1,460 | 6,583 | |
| Total departures | 31,379 | 136,718 | |
| All | |||
| Cork | 4,601 | 21,442 | |
| Dublin | 53,056 | 229,143 | |
| Kerry | 797 | 3,492 | |
| Knock | 1,441 | 6,330 | |
| Shannon | 2,906 | 13,151 | |
| Total flights | 62,801 | 273,558 | |
| Table 6A: Top 10 arrivals and departures for Dublin airport by number of passengers, Quarter 4 and Year 2019 | ||||||||
| Quarter 4 | January to December | |||||||
| Arrivals | Departures | Total | Arrivals | Departures | Total | |||
| London - Heathrow | 224,108 | 231,296 | 455,404 | London - Heathrow | 915,063 | 941,412 | 1,856,475 | |
| London - Gatwick | 174,654 | 165,239 | 339,893 | London - Gatwick | 685,264 | 663,078 | 1,348,342 | |
| Amsterdam - Schiphol | 150,638 | 151,202 | 301,840 | Amsterdam - Schiphol | 607,338 | 608,988 | 1,216,326 | |
| Manchester | 132,957 | 130,920 | 263,877 | Manchester | 500,586 | 503,626 | 1,004,212 | |
| Birmingham | 121,453 | 119,567 | 241,020 | Birmingham | 472,403 | 475,104 | 947,507 | |
| London - Stansted | 114,300 | 109,890 | 224,190 | London - Stansted | 458,403 | 448,817 | 907,220 | |
| Paris - Charles De Gaulle | 93,595 | 95,205 | 188,800 | Frankfurt - main | 375,276 | 386,543 | 761,819 | |
| Frankfurt - main | 86,071 | 94,530 | 180,601 | Paris - Charles De Gaulle | 379,822 | 380,511 | 760,333 | |
| Edinburgh | 79,430 | 76,735 | 156,165 | Edinburgh | 336,896 | 329,880 | 666,776 | |
| New York - John F Kennedy | 72,735 | 73,278 | 146,013 | Malaga | 327,936 | 329,564 | 657,500 | |
| Table 6B: Top 10 arrivals and departures for Cork airport by number of passengers, Quarter 4 and Year 2019 | ||||||||
| Quarter 4 | January to December | |||||||
| Arrivals | Departures | Total | Arrivals | Departures | Total | |||
| London - Heathrow | 45,881 | 47,000 | 92,881 | London - Heathrow | 186,889 | 192,257 | 379,146 | |
| London - Stansted | 43,997 | 41,921 | 85,918 | London - Stansted | 174,007 | 172,006 | 346,013 | |
| Amsterdam - Schiphol | 19,662 | 20,158 | 39,820 | Amsterdam - Schiphol | 78,025 | 79,300 | 157,325 | |
| London - Gatwick | 15,753 | 15,191 | 30,944 | Malaga | 78,011 | 77,543 | 155,554 | |
| Paris - Charles De Gaulle | 13,787 | 13,982 | 27,769 | Paris - Charles De Gaulle | 67,907 | 67,736 | 135,643 | |
| Manchester | 13,233 | 13,702 | 26,935 | London - Gatwick | 63,373 | 62,271 | 125,644 | |
| Malaga | 12,973 | 12,016 | 24,989 | Faro | 62,683 | 62,695 | 125,378 | |
| Lanzarote | 11,336 | 11,320 | 22,656 | Manchester | 53,131 | 55,394 | 108,525 | |
| London - Luton | 11,249 | 9,857 | 21,106 | Lanzarote | 52,780 | 52,758 | 105,538 | |
| Birmingham | 9,686 | 9,746 | 19,432 | London - Luton | 50,436 | 46,682 | 97,118 | |
| Table 6C: Top 10 arrivals and departures for Shannon airport by number of passengers, Quarter 4 and Year 2019 | ||||||||
| Quarter 4 | January to December | |||||||
| Arrivals | Departures | Total | Arrivals | Departures | Total | |||
| London - Heathrow | 31,231 | 32,644 | 63,875 | London - Heathrow | 131,597 | 138,359 | 269,956 | |
| London - Stansted | 26,017 | 23,766 | 49,783 | London - Stansted | 104,056 | 97,230 | 201,286 | |
| London - Gatwick | 14,375 | 14,353 | 28,728 | New York - John F Kennedy | 66,629 | 69,103 | 135,732 | |
| Boston - Logan | 12,185 | 13,216 | 25,401 | London - Gatwick | 58,797 | 59,140 | 117,937 | |
| New York - John F Kennedy | 12,138 | 12,837 | 24,975 | Manchester | 43,076 | 42,554 | 85,630 | |
| Manchester | 11,287 | 10,832 | 22,119 | Boston - Logan | 39,682 | 41,687 | 81,369 | |
| Malaga | 6,666 | 6,170 | 12,836 | Newark | 33,262 | 36,774 | 70,036 | |
| Alicante | 5,365 | 5,088 | 10,453 | Malaga | 34,046 | 33,941 | 67,987 | |
| Lanzarote | 4,955 | 5,297 | 10,252 | Faro | 28,720 | 27,783 | 56,503 | |
| Wroclaw - Strachowice | 4,699 | 5,059 | 9,758 | Lanzarote | 22,573 | 22,793 | 45,366 | |
| Table 6D: Top 10 arrivals and departures for Knock airport by number of passengers, Quarter 4 and Year 2019 | ||||||||
| Quarter 4 | January to December | |||||||
| Arrivals | Departures | Total | Arrivals | Departures | Total | |||
| London - Stansted | 19,975 | 20,067 | 40,042 | London - Stansted | 76,432 | 82,660 | 159,092 | |
| London - Luton | 14,934 | 14,528 | 29,462 | London - Luton | 66,899 | 66,253 | 133,152 | |
| Liverpool - John Lennon | 11,847 | 11,661 | 23,508 | Liverpool - John Lennon | 43,347 | 44,267 | 87,614 | |
| London - Gatwick | 9,909 | 9,471 | 19,380 | London - Gatwick | 41,502 | 40,497 | 81,999 | |
| East Midlands | 8,476 | 8,545 | 17,021 | East Midlands | 34,937 | 35,711 | 70,648 | |
| Bristol | 5,691 | 5,508 | 11,199 | Bristol | 22,253 | 22,365 | 44,618 | |
| Manchester | 4,032 | 3,918 | 7,950 | Manchester | 18,831 | 19,139 | 37,970 | |
| Birmingham | 3,158 | 3,078 | 6,236 | Faro | 15,641 | 16,329 | 31,970 | |
| Faro | 3,014 | 2,343 | 5,357 | Birmingham | 14,865 | 14,805 | 29,670 | |
| Edinburgh | 2,402 | 2,348 | 4,750 | Edinburgh | 13,170 | 13,388 | 26,558 | |
| Table 6E: Top 5 arrivals and departures for Kerry airport by number of passengers, Quarter 4 and Year 2019 | ||||||||
| Quarter 4 | January to December | |||||||
| Arrivals | Departures | Total | Arrivals | Departures | Total | |||
| London - Luton | 13,658 | 12,985 | 26,643 | London - Luton | 55,239 | 55,189 | 110,428 | |
| London - Stansted | 10,826 | 10,247 | 21,073 | London - Stansted | 41,285 | 40,999 | 82,284 | |
| Dublin | 6,389 | 6,947 | 13,336 | Dublin | 27,704 | 30,317 | 58,021 | |
| Frankfurt -Hahn | 4,803 | 5,209 | 10,012 | Frankfurt -Hahn | 25,369 | 25,429 | 50,798 | |
| Berlin - Schönefeld | 3,960 | 4,240 | 8,200 | Berlin - Schönefeld | 16,913 | 16,664 | 33,577 | |
| Table 7: Number of passengers classified by country of flight stage origin and destination handled by main airports, Quarter 4 and Year 2019 | ||||||||
| Continent | Country | Quarter 4 | January to December | |||||
| Arrivals | Departures | Total | Arrivals | Departures | Total | |||
| Europe | Austria | 28,856 | 30,740 | 59,596 | 128,864 | 129,590 | 258,454 | |
| Belgium | 67,343 | 68,283 | 135,626 | 253,799 | 253,243 | 507,042 | ||
| Bulgaria | 6,194 | 6,286 | 12,480 | 55,031 | 55,435 | 110,466 | ||
| Croatia | 18,105 | 15,064 | 33,169 | 119,103 | 116,254 | 235,357 | ||
| Czech Republic | 27,172 | 28,968 | 56,140 | 104,426 | 107,133 | 211,559 | ||
| Denmark | 34,114 | 34,738 | 68,852 | 135,745 | 137,051 | 272,796 | ||
| Finland | 18,214 | 19,829 | 38,043 | 57,500 | 62,391 | 119,891 | ||
| France | 214,157 | 215,269 | 429,426 | 1,064,387 | 1,067,584 | 2,131,971 | ||
| Germany | 277,582 | 290,651 | 568,233 | 1,256,375 | 1,262,784 | 2,519,159 | ||
| Greece | 15,048 | 13,596 | 28,644 | 105,165 | 105,005 | 210,170 | ||
| Hungary | 36,580 | 37,244 | 73,824 | 143,482 | 142,439 | 285,921 | ||
| Iceland | 13,177 | 13,959 | 27,136 | 72,922 | 73,781 | 146,703 | ||
| Italy | 165,876 | 161,404 | 327,280 | 807,358 | 803,559 | 1,610,917 | ||
| Latvia | 20,051 | 21,298 | 41,349 | 73,748 | 77,443 | 151,191 | ||
| Lithuania | 21,367 | 22,088 | 43,455 | 86,603 | 88,042 | 174,645 | ||
| Netherlands | 182,890 | 183,884 | 366,774 | 741,535 | 744,018 | 1,485,553 | ||
| Norway | 15,982 | 16,892 | 32,874 | 68,939 | 69,756 | 138,695 | ||
| Poland | 132,582 | 139,010 | 271,592 | 511,945 | 515,897 | 1,027,842 | ||
| Portugal | 120,953 | 115,276 | 236,229 | 682,265 | 686,913 | 1,369,178 | ||
| Romania | 26,463 | 26,725 | 53,188 | 120,266 | 117,608 | 237,874 | ||
| Slovakia | 14,618 | 15,077 | 29,695 | 63,748 | 63,311 | 127,059 | ||
| Spain | 450,945 | 441,276 | 892,221 | 2,341,120 | 2,335,317 | 4,676,437 | ||
| Sweden | 21,293 | 22,558 | 43,851 | 85,213 | 87,731 | 172,944 | ||
| Switzerland | 44,994 | 47,660 | 92,654 | 224,967 | 226,910 | 451,877 | ||
| Turkey | 32,653 | 31,768 | 64,421 | 138,379 | 139,068 | 277,447 | ||
| UK - England | 1,451,630 | 1,433,875 | 2,885,505 | 5,828,782 | 5,860,274 | 11,689,056 | ||
| UK - Northern Ireland | 43 | - | 43 | 1,021 | 235 | 1,256 | ||
| UK - Scotland | 162,941 | 159,054 | 321,995 | 689,164 | 683,712 | 1,372,876 | ||
| UK - Wales | 13,472 | 13,178 | 26,650 | 57,741 | 57,559 | 115,300 | ||
| UK - Other | 5,045 | 4,855 | 9,900 | 28,137 | 28,437 | 56,574 | ||
| Total UK | 1,633,131 | 1,610,962 | 3,244,093 | 6,604,845 | 6,630,217 | 13,235,062 | ||
| Other | 47,872 | 47,452 | 95,324 | 214,023 | 211,463 | 425,486 | ||
| Total Europe | 3,688,212 | 3,677,957 | 7,366,169 | 16,261,753 | 16,309,943 | 32,571,696 | ||
| North America | Canada | 41,937 | 46,568 | 88,505 | 259,491 | 266,636 | 526,127 | |
| USA | 409,199 | 425,420 | 834,619 | 1,895,622 | 1,914,645 | 3,810,267 | ||
| Other | 320 | 379 | 699 | 2,663 | 3,249 | 5,912 | ||
| Total North America | 451,456 | 472,367 | 923,823 | 2,157,776 | 2,184,530 | 4,342,306 | ||
| Africa | Total Africa | 5,652 | 5,661 | 11,313 | 23,873 | 24,013 | 47,886 | |
| Asia | Qatar | 16,391 | 15,163 | 31,554 | 78,032 | 69,438 | 147,470 | |
| United Arab Emirates | 76,571 | 82,655 | 159,226 | 331,004 | 326,944 | 657,948 | ||
| Other | 4,878 | 5,526 | 10,404 | 59,708 | 59,134 | 118,842 | ||
| Total Asia | 97,840 | 103,344 | 201,184 | 468,744 | 455,516 | 924,260 | ||
| Other1 | Total other | 336 | 590 | 926 | 2,559 | 2,480 | 5,039 | |
| All continents2 | 4,243,496 | 4,259,919 | 8,503,415 | 18,914,705 | 18,976,482 | 37,891,187 | ||
| 1 Due to residual coding errors some passengers cannot be assigned a country of flight origin/destination. | ||||||||
| 2 This figure refers to international passengers only and excludes domestic passenger numbers. | ||||||||
| Table 8: Air freight classified by national and international traffic handled by main airports, Quarter 4 and Year 2019 | |||
| Tonnes | |||
| Quarter 4 | January to December | ||
| National freight traffic | |||
| Cork | 0 | 0 | |
| Dublin | 1,230 | 4,889 | |
| Kerry | 0 | 0 | |
| Knock | 0 | 0 | |
| Shannon | 346 | 2,890 | |
| Total national freight | 1,576 | 7,779 | |
| International freight traffic | |||
| Cork | 15 | 50 | |
| Dublin | 37,023 | 128,340 | |
| Kerry | 0 | 0 | |
| Knock | 3 | 12 | |
| Shannon | 3,257 | 9,769 | |
| Total international freight | 40,298 | 138,171 | |
| All | |||
| Cork | 15 | 50 | |
| Dublin | 38,253 | 133,229 | |
| Kerry | 0 | 0 | |
| Knock | 3 | 12 | |
| Shannon | 3,603 | 12,658 | |
| Total freight | 41,874 | 145,950 | |
| Table 9: Air freight classified by arrivals and departures handled by main airports, Quarter 4 and Year 2019 | |||
| Tonnes | |||
| Quarter 4 | January to December | ||
| Arrival | |||
| Cork | 4 | 13 | |
| Dublin | 19,947 | 71,358 | |
| Kerry | 0 | 0 | |
| Knock | 3 | 12 | |
| Shannon | 1,760 | 6,393 | |
| Total arrivals - freight | 21,714 | 77,776 | |
| Departure | |||
| Cork | 11 | 37 | |
| Dublin | 18,307 | 61,871 | |
| Kerry | 0 | 0 | |
| Knock | 0 | 0 | |
| Shannon | 1,843 | 6,266 | |
| Total departures - freight | 20,161 | 68,174 | |
| All | |||
| Cork | 15 | 50 | |
| Dublin | 38,253 | 133,229 | |
| Kerry | 0 | 0 | |
| Knock | 3 | 12 | |
| Shannon | 3,603 | 12,658 | |
| Total freight | 41,874 | 145,950 | |
| Table 10: Seasonally adjusted number of passengers handled by main airports | ||||
| Airport | Q4 2018 | Q3 2019 | Q4 2019 | % change Q3 2019-Q4 2019 |
| Dublin | 8,010,758 | 8,232,739 | 8,125,815 | -1.3 |
| Cork | 617,859 | 649,525 | 652,576 | +0.5 |
| Shannon | 418,312 | 397,773 | 406,628 | +2.2 |
| Knock | 202,859 | 200,142 | 213,023 | +6.4 |
| Kerry | 92,769 | 93,324 | 93,306 | -0.0 |
| Total passengers | 9,342,557 | 9,573,503 | 9,491,348 | -0.9 |
Statistics on Aviation are collected under Statutory Instrument (S.I.) No. 91 of 2014 - Statistics (carriage of passengers, freight and mail by air) Order 2013.
The data in this release provides details on the number of passengers classified by arrivals and departures, and by reference to national and international traffic; the number of flights by arrivals and departures and information on air freight and mail (in tonnes). The release also highlights the top routes for each of the five main airports: Dublin, Cork, Shannon, Knock and Kerry. In 2019, the top five airports represented 99.8% of all air passengers.
Aviation statistics are compiled from data supplied by all Irish airports. The following Irish airports provide data to the Central Statistics Office: Dublin, Cork, Shannon, Kerry, Knock, Waterford, Connemara, Donegal and Inishmore. Galway and Sligo airports ceased operations in 2011. There have been no commercial flights in Waterford Airport since June 2016. Data for the five main airports is supplied on a monthly basis. Data for regional airports is supplied annually to the Central Statistics Office.
Seasonal adjustment for passenger numbers is conducted using a direct seasonal adjustment approach. However, the overall passenger totals are estimated using the indirect approach, i.e. the ‘Total passengers’ is derived by adding the monthly seasonally adjusted passenger numbers for each airport. The main reason for adopting the indirect approach is to attribute the monthly and annual changes in passenger numbers to each airport. Seasonal adjustment models are developed for each airport based on unadjusted data spanning from January 2012 to the current period. These models are reviewed on an annual basis; however seasonal factors are updated each quarter.
The adjustments are completed by applying the X-13-ARIMA model, developed by the U.S. Census Bureau to the unadjusted data. This methodology estimates seasonal factors while also taking into consideration factors that impact on the quality of the seasonal adjustment such as:
• Calendar effects, e.g. the timing of Easter,
• Outliers, temporary changes and level shifts in the series.
For additional information on the use of X-13-ARIMA see https://www.census.gov/srd/www/winx13/
Main airport: A main airport is defined as an airport through which in excess of 150,000 passengers fly per annum. The five main airports in Ireland are Dublin, Cork, Shannon, Knock and Kerry.
Regional airport: A regional airport is defined as an airport through which less than 150,000 passengers fly per annum. The three regional airports in Ireland are Donegal, Connemara and Inishmore.
Scheduled flight: The term 'scheduled' in this release, refers to a commercial air service operated according to a published timetable, or with such a regular frequency that it constitutes an easily recognisable systematic series of flights.
Non-scheduled flight: The term 'non-scheduled' in this release, refers to a commercial air service other than scheduled air service e.g. chartered or private aircraft flights.
Direct transit passengers: These are passengers who, following a short stop, continue their journey on the same aircraft with the same flight number as the flight on which they arrived. These passengers are en route to another destination and generally do not disembark from their aircraft.
Transfer passengers: Transfer passengers or ‘connecting passengers’ are defined as passengers who make a stop at an airport without any purpose other than to board another aircraft to reach another destination. Unlike transit passengers, transfer passengers disembark the aircraft and pass through the airport en route to their connecting flight.
 Hide Background Notes
Scan the QR code below to view this release online or go to
http://www.cso.ie/en/releasesandpublications/er/as/aviationstatisticsquarter4andyear2019/
 Show Table 1: Number of passengers handled by main airports, Quarter 4 and Year 2017-2019
 Hide Table 1: Number of passengers handled by main airports, Quarter 4 and Year 2017-2019