
| 2017 | 2016 | |
| Births | 62,053 | 63,897 |
| Deaths | 30,484 | 30,390 |
| Marriages | 22,021 | 22,626 |
| Natural increase | 31,569 | 33,507 |
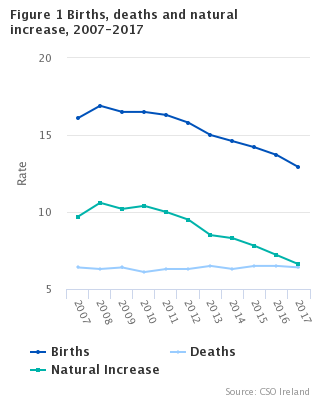
There were 62,053 births in 2017, 1,844 fewer births compared with 2016. This corresponds to a birth rate of 12.9 per 1,000 population, a rate decrease of 0.6 from 2016.
There were 30,484 deaths registered in 2017, an increase of 0.3% (or 94 deaths) from 2016. This equates to a death rate of 6.4 per 1,000 population, the same rate as 2016.
There were 174 infant deaths registered in 2017 giving an infant mortality rate of 2.8 per 1,000 live births.
The number of births less the number of deaths in 2017 resulted in a natural increase of population of 31,569 persons, 5.8% lower than the natural increase of 33,507 in 2016. See tables 1a and 1b.
Births
There were 62,053 births registered in 2017, 31,855 male births and 30,198 female births, a decrease of 1,844 on 2016. The 2017 total is 12.1% lower than in 2007 when 70,620 births were registered.
The 62,053 births represent an annual birth rate of 12.9 per thousand population. This rate is 0.6 per thousand population lower than in 2016. See tables 1a, 1b and 3.
Fertility
The total period fertility rate, TPFR is derived from the age specific fertility rates in the current year. It represents the projected number of children a woman would have if she experienced current age specific fertility rates while progressing from age 15-49 years. A value of 2.1 is generally considered to be the level at which the population would replace itself in the long run, ignoring migration.
In 2017 the TPFR for Ireland was 1.8 which is below replacement level. See table 2.
Age of Mothers
The average age of first time mothers in 2017 was 31.0 years, up 0.1 years from 2016. The average age of mothers at maternity for all births registered in 2017 was 32.8 years, 0.1 higher than 2016. The average age of first time mothers outside marriage/civil partnership was 28.7 while the average age of all mothers outside marriage/civil partnership was 30.2 years. In 2016, the average age of mothers having their first baby outside marriage/civil partnership was 28.6 years while it was 30.1 years for all mothers for births registered outside of marriage/civil partnership. See tables 1a, 1b, 7 and 8.
Births and marriage/civil partnerships
In 2017, there were 38,713 (62.4%) births registered as within marriage and of these 3 were within civil partnerships.
There were 23,340 births registered as outside marriage/civil partnership accounting for 37.6% of all births, an increase of 1.1 percentage points from 2016. The highest percentage of births outside marriage/civil partnership was in Limerick City at 57.0% and the lowest was in Dun Laoghaire Rathdown with 25.4%. See tables 1 and 6.
A total of 1,041 teenagers had babies in 2017, of these 19 were aged under 16. Just under half (49.8%) of births outside marriage/civil partnership were to mothers under 30. See Table 5.
Location of births
The highest number of births registered was in Dublin City with 7,045 (11.4% of total live births in the country) followed by Cork County with 5,472 (8.8%) registered births. Leitrim had the lowest number with 408 (0.7%) registered births in 2017. The same pattern was reflected in 2016 when Dublin City accounted for 7,273 or 11.4% of births followed by Cork County with 5,649 (8.8%). Leitrim had the lowest number, 418 births (or 0.7%), registered in 2016. See tables 3, 6 and 7.
Nationality of mothers
Of the 62,053 births in 2017, there were 47,991 babies (77.3%) born to mothers of Irish nationality compared to 49,277 (77.1%) in 2016. There were 11.5% of births to mothers of EU 15 to EU 28 nationality, 2.2% of mothers were of UK nationality, and 1.9% were of EU 15 nationality (excluding Ireland and the UK). Mothers of nationalities other than Ireland, UK and the EU accounted for 7.1% of total births registered. There were 0.1% of mothers where the nationality was not stated. See table 9.
Birth Order
A total of 23,527 births (37.9%) were to first time mothers in 2017. Second time mothers had 21,615 births (34.8%). This accounted for a total of 72.7% of births of stated parity. See table 4 and figure 2.
| For long labels below use to display on multiple lines | Birth Order 2017 (%) |
|---|---|
| 1st | 37.9149745374847 |
| 2nd | 34.8336878746858 |
| 3rd | 18.1702443112228 |
| 4th | 5.9160059305099 |
| 5th and over | 3.16508734609682 |
Deaths
There were 30,484 deaths registered in 2017, of these 15,497 were male while 14,987 were female. The 2017 total is 0.3% higher than in 2016 when 30,390 deaths were registered. See tables 1a and 10.
Infant and neonatal mortality
There were 174 Infant deaths registered in 2017 giving an infant mortality rate of 2.8 deaths per 1,000 live births, a decrease of 0.5 from 2016. Neonatal deaths are deaths of infants at ages under 4 weeks. There were 138 neonatal deaths registered in 2017, a neonatal mortality rate of 2.2 deaths per 1,000 live births, which was a decrease of 0.2 from 2016. See tables 1a, 1b and 15, and figure 3.
.
| Under 1 year rates | infant | neonatal |
|---|---|---|
| 2011 | 3.5 | 2.5 |
| 2012 | 3.5 | 2.7 |
| 2013 | 3.3 | 2.4 |
| 2014 | 3.7 | 2.7 |
| 2015 | 3.1 | 2.3 |
| 2016 | 3.3 | 2.4 |
| 2017 | 2.8 | 2.2 |
Cause of death
Diseases of the Heart and Arteries:
Diseases of the circulatory system accounted for 8,927 deaths or an annual rate of 1.9 per 1,000 population. Of these, 4,238 were due to ischaemic heart disease and 1,710 to cerebrovascular disease. See tables 11 and 12, and figure 4.
Malignant Cancers:
There were 9,175 deaths from malignant neoplasms. This is equivalent to an annual rate of 1.9 per 1,000 population. See tables 11 and 12, and figure 4.
Lung Diseases:
Deaths from chronic lower respiratory disease numbered 1,610; pneumonia accounted for 1,109 deaths and 1,360 deaths resulted from all other respiratory diseases. See tables 11 and 12.
Accidents, suicides and other:
There were 1,315 deaths due to accidents, suicides and other external causes. Accidents accounted for 65.2% (858) of these deaths while suicides accounted for 29.8% (392). Of these 1,315 deaths, 930 (70.7%) were male. See tables 12, 13, 14 and 16.
| For long labels below use to display on multiple lines | Principal causes of death 2017 |
|---|---|
| malignant neoplasms | 30 |
| circulatory diseases | 29 |
| external causes | 4 |
| respiratory diseases | 13 |
| remainder | 23 |
Age at death
The leading cause of death in 2017 varied widely by age group. Among those aged from 15 to 44 years, external causes of death including accidents, suicide and other ranked first (500 deaths). Among individuals aged 45-74, cancers were the leading cause while for those aged 75 and older, it was diseases of the heart and arteries. See table 12 and figure 5.
There were 25,026 deaths of persons aged 65 and over registered in 2017. This represents an annual death rate of 38.5 per 1,000 population aged 65 and over and represents a rate decrease of 0.9 when compared with 2016. See tables 1a, 1b and figure 5.
| Cancer | Heart | Lung | Accident, suicide, homicide and undetermined | Other | |
| Under 15 | 6 | 0.8 | 3.6 | 6.5 | 81.8 |
| 15-44 | 22.9 | 12.2 | 1.9 | 43.1 | 19.9 |
| 45-74 | 46.8 | 23.5 | 8.2 | 5.4 | 16.1 |
| 75 and over | 22.8 | 33.4 | 16.7 | 1 | 25.6 |
The average (mean) time-lag between the date of death and the registration of death was 49 days while the median (mid-point in data) was 18 days in 2017.
Marriages/Civil Partnerships
The number of marriages registered in 2017 was 22,021, of which 759 were same-sex marriages. This is equivalent to an annual marriage rate of 4.6 per 1,000 population, 0.2 less than the rate in 2016. See tables 1a and 1b.
Same-Sex marriage legislation came into effect on the 16th November 2015.
Civil Partnership legislation was introduced in Ireland on the 1st January, 2011. From 16th November 2015, when same-sex marriages legislation came into effect, same-sex couples no longer had the option to apply for a Civil Partnership. However, couples that had given the required 3 months' notice of a Civil Partnership prior to 16th November 2015 were still entitled to have a Civil Partnership ceremony after that date. There were no civil partnerships registered in 2017 compared to 7 civil partnerships registered in 2016. See tables 1a and 1b.
Divorces
The most recent divorce data available at time of publication was for 2015. There were 3,289 divorces granted by the Circuit Court and the High Court in 2015. This was an increase of 660 on the 2014 figure.
Divorce statistics are compiled by the Courts Service. For the numbers of divorce applications received in 2016 see links: Circuit Court 2016 and High Court 2016
See table 17 for 2015 data.
Population
The estimated population (usual residence) in April 2017 was 4,792,490. See table A.
 Show Table 1a Marriages, Civil partnerships, Births, Deaths and natural increase by number 2007-2017
| Table 1a Marriages, civil partnerships, births, deaths and natural increase, by number 2007-2017 | ||||||||||||||
| Marriages1 | Live Births | 2Deaths | ||||||||||||
| Year | Total | Opposite sex | Same sex | 1Civil Partnerships number | Total births number | First births number | Births outside marriage/civil partnerships | Average Age of mother at maternity | Total deaths number | Infant deaths number | Neo-natal deaths number | deaths 65 & over number | Natural Increase births less deaths | |
| 2007 | 22,756 | – | – | – | 70,620 | 29,269 | 23,170 | 31.1 | 28,050 | 221 | 149 | 21,824 | 42,570 | |
| 2008 | 22,187 | – | – | – | 75,724 | 31,667 | 25,081 | 31.1 | 28,192 | 290 | 200 | 21,847 | 47,532 | |
| 2009 | 21,627 | – | – | – | 74,928 | 31,627 | 24,748 | 31.3 | 28,898 | 240 | 169 | 22,232 | 46,030 | |
| 2010 | 20,594 | – | – | – | 74,976 | 31,120 | 25,380 | 31.5 | 27,565 | 282 | 190 | 21,536 | 47,411 | |
| 2011 | 19,855 | – | – | 536 | 74,650 | 29,441 | 25,190 | 31.8 | 28,995 | 258 | 190 | 22,631 | 45,655 | |
| 2012 | 20,713 | – | – | 429 | 72,225 | 27,939 | 25,344 | 31.9 | 28,848 | 250 | 194 | 22,768 | 43,377 | |
| 2013 | 20,680 | – | – | 333 | 68,930 | 26,111 | 24,393 | 32.1 | 30,018 | 228 | 164 | 23,980 | 38,912 | |
| 2014 | 22,045 | – | – | 392 | 67,462 | 25,635 | 24,490 | 32.3 | 29,095 | 249 | 184 | 23,269 | 38,367 | |
| 2015 | 22,116 | 22,025 | 91 | 376 | 65,909 | 24,867 | 23,990 | 32.5 | 29,952 | 205 | 151 | 24,330 | 35,957 | |
| 2016 | 22,626 | 21,570 | 1,056 | 7 | 63,897 | 24,042 | 23,348 | 32.7 | 30,390 | 208 | 155 | 24,796 | 33,507 | |
| 2017 | 22,021 | 21,262 | 759 | – | 62,053 | 23,527 | 23,340 | 32.8 | 30,484 | 174 | 138 | 25,026 | 31,569 | |
| 1 All Marriage and civil partnership figures are final. | ||||||||||||||
| 2 See Background Notes for changes in methodology effective from 2007. | ||||||||||||||
| Table 1b Marriages, Civil Partnerships, Births, Deaths and natural increase, by rate 2007-2017 | |||||||||||||
| Marriages | Live Births | Deaths | |||||||||||
| Year | 1Total Marriage rate | 1Civil Partnerships rate | 1Birth rate | 2First births percentage | % Births outside marriage/civil partnerships | 1Death Rate | 3Infant Mortality rate | 4Neo-natal Mortality rate | Deaths 65 & over rate | Natural Increase | |||
| 2007 | 5.2 | – | – | – | 16.1 | 41.9 | 32.8 | 6.4 | 3.1 | 2.1 | 46.3 | 9.7 | |
| 2008 | 4.9 | – | – | – | 16.9 | 42.1 | 33.1 | 6.3 | 3.8 | 2.6 | 45.2 | 10.6 | |
| 2009 | 4.8 | – | – | – | 16.5 | 42.4 | 33.0 | 6.4 | 3.2 | 2.3 | 44.6 | 10.2 | |
| 2010 | 4.5 | – | – | – | 16.5 | 41.7 | 33.9 | 6.1 | 3.8 | 2.5 | 41.8 | 10.4 | |
| 2011 | 4.3 | – | – | 0.1 | 16.3 | 39.6 | 33.7 | 6.3 | 3.5 | 2.5 | 42.6 | 10.0 | |
| 2012 | 4.5 | – | – | 0.1 | 15.7 | 38.8 | 35.1 | 6.3 | 3.5 | 2.7 | 41.4 | 9.4 | |
| 2013 | 4.5 | – | – | 0.1 | 14.9 | 38.0 | 35.4 | 6.5 | 3.3 | 2.4 | 42.1 | 8.4 | |
| 2014 | 4.7 | – | – | 0.1 | 14.5 | 38.1 | 36.3 | 6.3 | 3.7 | 2.7 | 39.5 | 8.3 | |
| 2015 | 4.7 | 4.7 | 0.0 | 0.1 | 14.1 | 37.8 | 36.4 | 6.4 | 3.1 | 2.3 | 39.9 | 7.7 | |
| 2016* | 4.8 | 4.6 | 0.2 | 0.0 | 13.5 | 37.6 | 36.5 | 6.4 | 3.3 | 2.4 | 39.4 | 7.1 | |
| 2017 | 4.6 | 4.4 | 0.2 | – | 12.9 | 37.9 | 37.6 | 6.4 | 2.8 | 2.2 | 38.5 | 6.6 | |
| 1 Rates are calculated per 1,000 Usual Residence population figures. | |||||||||||||
| 2 First births divided by the total number of live births (excluding those with unstated parity), multiplied by 100. | |||||||||||||
| 3 Infant mortality is the number of infant deaths per 1,000 live births. | |||||||||||||
| 4 Neonatal mortality is the number of neonatal (infants aged under 4 weeks) deaths per 1,000 live births. | |||||||||||||
| Rates have been revised for intercensal years (2012-2015) | |||||||||||||
| *Rates for 2016 have also been revised (See background notes) | |||||||||||||
| Table 2 Births registered, classified by age of mother at maternity between 2015 and 2017 and their corresponding annual age specific (asfr) and total period fertility rates (tpfr) | |||||||||
| Period | Under 20 | 20-24 | 25-29 | 30-34 | 35-39 | 40-44 | 45 and over | Age not stated | All ages |
| Number of live births | |||||||||
| Quarter 1 | |||||||||
| 2015 | 299 | 1,498 | 3,205 | 6,217 | 4,796 | 1,109 | 58 | 1 | 17,183 |
| 2016 | 318 | 1,413 | 2,940 | 5,850 | 4,801 | 1,097 | 61 | – | 16,480 |
| 2017 | 297 | 1,367 | 2,896 | 5,784 | 5,033 | 1,021 | 89 | – | 16,487 |
| Quarter 2 | |||||||||
| 2015 | 285 | 1,355 | 3,077 | 5,836 | 4,517 | 941 | 52 | 1 | 16,064 |
| 2016 | 262 | 1,370 | 2,860 | 5,818 | 4,813 | 1,022 | 74 | – | 16,219 |
| 2017 | 253 | 1,280 | 2,646 | 5,239 | 4,698 | 1,038 | 68 | – | 15,222 |
| Quarter 3 | |||||||||
| 2015 | 330 | 1,511 | 3,236 | 6,160 | 4,842 | 987 | 62 | – | 17,128 |
| 2016 | 266 | 1,332 | 3,020 | 6,025 | 4,724 | 1,016 | 75 | – | 16,458 |
| 2017 | 272 | 1,302 | 2,772 | 5,582 | 4,710 | 920 | 77 | – | 15,635 |
| Quarter 4 | |||||||||
| 2015 | 273 | 1,368 | 2,885 | 5,643 | 4,372 | 941 | 52 | – | 15,534 |
| 2016 | 252 | 1,101 | 2,558 | 5,311 | 4,470 | 963 | 85 | – | 14,740 |
| 2017 | 219 | 1,194 | 2,572 | 5,157 | 4,538 | 954 | 75 | – | 14,709 |
| Total | |||||||||
| 2015 | 1,187 | 5,732 | 12,403 | 23,856 | 18,527 | 3,978 | 224 | 2 | 65,909 |
| 2016 | 1,098 | 5,216 | 11,378 | 23,004 | 18,808 | 4,098 | 295 | – | 63,897 |
| 2017 | 1,041 | 5,143 | 10,886 | 21,762 | 18,979 | 3,933 | 309 | – | 62,053 |
| Live births per 1,000 relevant female population (ASFR) | TPFR | ||||||||
| Quarter 1 | |||||||||
| 2015 | 8.5 | 43.7 | 80.8 | 125.9 | 102.1 | 25.4 | 1.5 | – | 1.9 |
| 2016 | 8.8 | 41.7 | 75.9 | 121.8 | 99.5 | 24.7 | 1.5 | – | 1.9 |
| 2017 | 8.1 | 40.5 | 76.5 | 123.2 | 101.9 | 22.8 | 2.2 | – | 1.9 |
| Quarter 2 | |||||||||
| 2015 | 7.9 | 40.0 | 79.4 | 121.5 | 93.7 | 21.1 | 1.3 | – | 1.8 |
| 2016 | 7.1 | 40.6 | 75.5 | 123.9 | 97.5 | 22.8 | 1.8 | – | 1.8 |
| 2017 | 6.7 | 37.7 | 71.4 | 115.4 | 93.1 | 22.7 | 1.6 | – | 1.7 |
| Quarter 3 | |||||||||
| 2015 | 9.2 | 44.6 | 83.5 | 128.2 | 100.4 | 22.2 | 1.6 | – | 1.9 |
| 2016 | 7.2 | 39.4 | 79.7 | 128.3 | 95.7 | 22.7 | 1.8 | – | 1.9 |
| 2017 | 7.2 | 38.3 | 74.8 | 123.0 | 93.3 | 20.1 | 1.8 | – | 1.8 |
| Quarter 4 | |||||||||
| 2015 | 7.6 | 40.4 | 74.5 | 117.5 | 90.7 | 21.1 | 1.3 | – | 1.8 |
| 2016 | 6.9 | 32.6 | 67.5 | 113.1 | 90.5 | 21.5 | 2.1 | – | 1.7 |
| 2017 | 5.8 | 35.2 | 69.4 | 113.6 | 89.9 | 20.9 | 1.8 | – | 1.7 |
| Total | |||||||||
| 2015 | 8.2 | 42.3 | 80.0 | 124.1 | 96.0 | 22.4 | 1.4 | – | 1.9 |
| 2016 | 7.5 | 38.6 | 75.1 | 122.5 | 95.2 | 22.9 | 1.8 | – | 1.8 |
| 2017 | 6.9 | 37.9 | 73.5 | 119.9 | 94.0 | 21.5 | 1.9 | – | 1.8 |
| Rates have been revised for intercensal year (2015) | |||||||||
| 2016 Usual Residence Population figures have been revised (See background notes) | |||||||||
| Table 3 Births registered, classified by area of residence of mother, 2017 | ||||
| Area of residence | Total | Male | Female | Rate1 |
| STATE | 62,053 | 31,855 | 30,198 | 12.9 |
| LEINSTER | 35,606 | 18,147 | 17,459 | 13.4 |
| Carlow | 766 | 353 | 413 | 13.3 |
| Dublin City | 7,045 | 3,551 | 3,494 | 12.9 |
| South Dublin | 4,000 | 2,068 | 1,932 | 18.0 |
| Fingal | 4,552 | 2,300 | 2,252 | 15.2 |
| Dun Laoghaire Rathdown | 2,597 | 1,313 | 1,284 | 9.3 |
| Kildare | 3,182 | 1,609 | 1,573 | 14.1 |
| Kilkenny | 1,183 | 648 | 535 | 11.9 |
| Laois | 1,207 | 623 | 584 | 14.0 |
| Longford | 558 | 275 | 283 | 13.4 |
| Louth | 1,738 | 914 | 824 | 13.3 |
| Meath | 2,752 | 1,399 | 1,353 | 13.8 |
| Offaly | 990 | 510 | 480 | 12.5 |
| Westmeath | 1,234 | 622 | 612 | 13.7 |
| Wexford | 1,911 | 960 | 951 | 12.6 |
| Wicklow | 1,891 | 1,002 | 889 | 13.0 |
| MUNSTER | 15,914 | 8,235 | 7,679 | 12.4 |
| Clare | 1,430 | 721 | 709 | 12.0 |
| Cork City | 1,372 | 716 | 656 | 11.2 |
| Cork County | 5,472 | 2,824 | 2,648 | 12.9 |
| Kerry | 1,626 | 806 | 820 | 11.1 |
| Limerick City | 783 | 395 | 388 | 13.6 |
| Limerick County | 1,790 | 971 | 819 | 13.0 |
| North Tipperary | 940 | 496 | 444 | 13.0 |
| South Tipperary | 1,095 | 572 | 523 | 12.2 |
| Waterford City | 567 | 289 | 278 | 11.9 |
| Waterford County | 839 | 445 | 394 | 12.2 |
| CONNACHT | 6,787 | 3,507 | 3,280 | 12.3 |
| Galway City | 916 | 455 | 461 | 12.3 |
| Galway County | 2,412 | 1,270 | 1,142 | 13.3 |
| Leitrim | 408 | 204 | 204 | 12.6 |
| Mayo | 1,542 | 799 | 743 | 11.8 |
| Roscommon | 772 | 400 | 372 | 11.8 |
| Sligo | 737 | 379 | 358 | 11.3 |
| ULSTER (PART OF) | 3,746 | 1,966 | 1,780 | 12.5 |
| Cavan | 1,081 | 579 | 502 | 14.1 |
| Donegal | 1,864 | 948 | 916 | 11.6 |
| Monaghan | 801 | 439 | 362 | 12.8 |
| REGIONAL AUTHORITIES: | ||||
| Border | 6,629 | 3,463 | 3,166 | 12.6 |
| Midland | 3,989 | 2,030 | 1,959 | 13.4 |
| West | 5,642 | 2,924 | 2,718 | 12.5 |
| Dublin | 18,194 | 9,232 | 8,962 | 13.5 |
| Mid-East | 7,825 | 4,010 | 3,815 | 13.7 |
| Mid-West | 4,943 | 2,583 | 2,360 | 12.8 |
| South-East | 6,361 | 3,267 | 3,094 | 12.3 |
| South-West | 8,470 | 4,346 | 4,124 | 12.3 |
| 1 Births per year per 1,000 population. Annual rates based on estimated usual residence 2017 population. | ||||
| Table 4 Births registered, classified by age of mother and previous number of liveborn children, 2017 | ||||||||
| Previous number of liveborn children | ||||||||
| Age of mother at maternity | Total | 0 | 1 | 2 | 3 | 4 | 5 or more | Not stated |
| All ages | 62,053 | 23,527 | 21,615 | 11,275 | 3,671 | 1,145 | 819 | 1 |
| 15 and under | 19 | 18 | 1 | – | – | – | – | – |
| 16 | 54 | 52 | 2 | – | – | – | – | – |
| 17 | 138 | 126 | 11 | 1 | – | – | – | – |
| 18 | 293 | 267 | 20 | 6 | – | – | – | – |
| 19 | 537 | 460 | 65 | 11 | – | 1 | – | – |
| Under 20 | 1,041 | 923 | 99 | 18 | – | 1 | – | – |
| 20 | 710 | 531 | 159 | 17 | 3 | – | – | – |
| 21 | 794 | 568 | 183 | 36 | 5 | 2 | – | – |
| 22 | 1,011 | 645 | 276 | 72 | 16 | – | 2 | – |
| 23 | 1,232 | 700 | 388 | 110 | 29 | 2 | 3 | – |
| 24 | 1,396 | 738 | 457 | 146 | 40 | 9 | 6 | – |
| 20-24 | 5,143 | 3,182 | 1,463 | 381 | 93 | 13 | 11 | – |
| 25 | 1,649 | 821 | 554 | 196 | 57 | 17 | 4 | – |
| 26 | 1,825 | 879 | 614 | 231 | 71 | 22 | 8 | – |
| 27 | 2,086 | 889 | 730 | 317 | 107 | 31 | 12 | – |
| 28 | 2,396 | 1,047 | 807 | 357 | 124 | 50 | 11 | – |
| 29 | 2,930 | 1,302 | 994 | 408 | 138 | 53 | 34 | 1 |
| 25-29 | 10,886 | 4,938 | 3,699 | 1,509 | 497 | 173 | 69 | 1 |
| 30 | 3,521 | 1,594 | 1,214 | 480 | 143 | 61 | 29 | – |
| 31 | 4,067 | 1,693 | 1,456 | 635 | 178 | 57 | 48 | – |
| 32 | 4,310 | 1,767 | 1,575 | 658 | 199 | 63 | 48 | – |
| 33 | 4,860 | 1,801 | 1,833 | 832 | 265 | 71 | 58 | – |
| 34 | 5,004 | 1,710 | 1,940 | 949 | 270 | 76 | 59 | – |
| 30-34 | 21,762 | 8,565 | 8,018 | 3,554 | 1,055 | 328 | 242 | – |
| 35 | 4,918 | 1,453 | 1,919 | 1,060 | 324 | 91 | 71 | – |
| 36 | 4,609 | 1,247 | 1,749 | 1,100 | 327 | 94 | 92 | – |
| 37 | 3,884 | 920 | 1,369 | 1,103 | 324 | 94 | 74 | – |
| 38 | 3,156 | 699 | 1,087 | 876 | 347 | 84 | 63 | – |
| 39 | 2,412 | 529 | 805 | 711 | 239 | 74 | 54 | – |
| 35-39 | 18,979 | 4,848 | 6,929 | 4,850 | 1,561 | 437 | 354 | – |
| 40 | 1,578 | 328 | 550 | 408 | 184 | 61 | 47 | – |
| 41 | 1,031 | 241 | 350 | 240 | 117 | 47 | 36 | – |
| 42 | 682 | 179 | 225 | 138 | 75 | 40 | 25 | – |
| 43 | 404 | 107 | 122 | 96 | 48 | 16 | 15 | – |
| 44 | 238 | 83 | 71 | 39 | 23 | 12 | 10 | – |
| 40-44 | 3,933 | 938 | 1,318 | 921 | 447 | 176 | 133 | – |
| 45 and over | 309 | 133 | 89 | 42 | 18 | 17 | 10 | – |
| Age not stated | – | – | – | – | – | – | – | – |
| Table 5 Number and percentage of births registered within and outside marriage/civil partnership, classified by age of mother, 2017 | ||||||||
| Age of mother at maternity | Total | Married/Civil partnership parents | Unmarried/non Civil partnership parents | Married/Civil partnership parents | Unmarried/non Civil partnership parents | |||
| Total | Same address | Total | Same address | |||||
| Number | Percentage | |||||||
| All ages | 62,053 | 38,713 | 23,340 | 13,745 | 62.4 | 37.6 | 22.2 | |
| 15 and under | 19 | – | 19 | 2 | – | 100.0 | 10.5 | |
| 16 | 54 | 4 | 50 | 7 | 7.4 | 92.6 | 13.0 | |
| 17 | 138 | 13 | 125 | 21 | 9.4 | 90.6 | 15.2 | |
| 18 | 293 | 41 | 252 | 48 | 14.0 | 86.0 | 16.4 | |
| 19 | 537 | 66 | 471 | 120 | 12.3 | 87.7 | 22.3 | |
| Under 20 | 1,041 | 124 | 917 | 198 | 11.9 | 88.1 | 19.0 | |
| 20 | 710 | 106 | 604 | 194 | 14.9 | 85.1 | 27.3 | |
| 21 | 794 | 123 | 671 | 247 | 15.5 | 84.5 | 31.1 | |
| 22 | 1,011 | 194 | 817 | 303 | 19.2 | 80.8 | 30.0 | |
| 23 | 1,232 | 249 | 983 | 435 | 20.2 | 79.8 | 35.3 | |
| 24 | 1,396 | 311 | 1,085 | 522 | 22.3 | 77.7 | 37.4 | |
| 20-24 | 5,143 | 983 | 4,160 | 1,701 | 19.1 | 80.9 | 33.1 | |
| 25 | 1,649 | 412 | 1,237 | 605 | 25.0 | 75.0 | 36.7 | |
| 26 | 1,825 | 520 | 1,305 | 719 | 28.5 | 71.5 | 39.4 | |
| 27 | 2,086 | 782 | 1,304 | 729 | 37.5 | 62.5 | 34.9 | |
| 28 | 2,396 | 1,089 | 1,307 | 763 | 45.5 | 54.5 | 31.8 | |
| 29 | 2,930 | 1,539 | 1,391 | 845 | 52.5 | 47.5 | 28.8 | |
| 25-29 | 10,886 | 4,342 | 6,544 | 3,661 | 39.9 | 60.1 | 33.6 | |
| 30 | 3,521 | 2,165 | 1,356 | 887 | 61.5 | 38.5 | 25.2 | |
| 31 | 4,067 | 2,773 | 1,294 | 884 | 68.2 | 31.8 | 21.7 | |
| 32 | 4,310 | 3,082 | 1,228 | 851 | 71.5 | 28.5 | 19.7 | |
| 33 | 4,860 | 3,612 | 1,248 | 886 | 74.3 | 25.7 | 18.2 | |
| 34 | 5,004 | 3,850 | 1,154 | 844 | 76.9 | 23.1 | 16.9 | |
| 30-34 | 21,762 | 15,482 | 6,280 | 4,352 | 71.1 | 28.9 | 20.0 | |
| 35 | 4,918 | 3,828 | 1,090 | 794 | 77.8 | 22.2 | 16.1 | |
| 36 | 4,609 | 3,587 | 1,022 | 727 | 77.8 | 22.2 | 15.8 | |
| 37 | 3,884 | 3,037 | 847 | 593 | 78.2 | 21.8 | 15.3 | |
| 38 | 3,156 | 2,441 | 715 | 512 | 77.3 | 22.7 | 16.2 | |
| 39 | 2,412 | 1,849 | 563 | 417 | 76.7 | 23.3 | 17.3 | |
| 35-39 | 18,979 | 14,742 | 4,237 | 3,043 | 77.7 | 22.3 | 16.0 | |
| 40 | 1,578 | 1,151 | 427 | 294 | 72.9 | 27.1 | 18.6 | |
| 41 | 1,031 | 747 | 284 | 200 | 72.5 | 27.5 | 19.4 | |
| 42 | 682 | 484 | 198 | 117 | 71.0 | 29.0 | 17.2 | |
| 43 | 404 | 277 | 127 | 84 | 68.6 | 31.4 | 20.8 | |
| 44 | 238 | 170 | 68 | 42 | 71.4 | 28.6 | 17.6 | |
| 40-44 | 3,933 | 2,829 | 1,104 | 737 | 71.9 | 28.1 | 18.7 | |
| 45 and over | 309 | 211 | 98 | 53 | 68.3 | 31.7 | 17.2 | |
| Age not stated | – | – | – | – | – | – | – | |
| Table 6 Number and percentage of births registered within and outside marriage/civil partnership classified by area of residence of mother, 2017 | ||||||||
| Area of residence | Total | Married/Civil partnership parents | Unmarried/non Civil partnership parents | Married/Civil partnership parents | Unmarried/non Civil partnership parents | |||
| Total | Same address | Total | Same address | |||||
| Number | Percentage | |||||||
| STATE | 62,053 | 38,713 | 23,340 | 13,745 | 62.4 | 37.6 | 22.2 | |
| LEINSTER | 35,606 | 21,896 | 13,710 | 7,855 | 61.5 | 38.5 | 22.1 | |
| Carlow | 766 | 452 | 314 | 193 | 59.0 | 41.0 | 25.2 | |
| Dublin City | 7,045 | 4,032 | 3,013 | 1,421 | 57.2 | 42.8 | 20.2 | |
| South Dublin | 4,000 | 2,331 | 1,669 | 863 | 58.3 | 41.7 | 21.6 | |
| Fingal | 4,552 | 3,021 | 1,531 | 981 | 66.4 | 33.6 | 21.6 | |
| Dun Laoghaire Rathdown | 2,597 | 1,937 | 660 | 424 | 74.6 | 25.4 | 16.3 | |
| Kildare | 3,182 | 2,066 | 1,116 | 678 | 64.9 | 35.1 | 21.3 | |
| Kilkenny | 1,183 | 770 | 413 | 252 | 65.1 | 34.9 | 21.3 | |
| Laois | 1,207 | 725 | 482 | 292 | 60.1 | 39.9 | 24.2 | |
| Longford | 558 | 327 | 231 | 150 | 58.6 | 41.4 | 26.9 | |
| Louth | 1,738 | 970 | 768 | 414 | 55.8 | 44.2 | 23.8 | |
| Meath | 2,752 | 1,781 | 971 | 612 | 64.7 | 35.3 | 22.2 | |
| Offaly | 990 | 624 | 366 | 226 | 63.0 | 37.0 | 22.8 | |
| Westmeath | 1,234 | 749 | 485 | 325 | 60.7 | 39.3 | 26.3 | |
| Wexford | 1,911 | 993 | 918 | 548 | 52.0 | 48.0 | 28.7 | |
| Wicklow | 1,891 | 1,118 | 773 | 476 | 59.1 | 40.9 | 25.2 | |
| MUNSTER | 15,914 | 9,797 | 6,117 | 3,684 | 61.6 | 38.4 | 23.1 | |
| Clare | 1,430 | 931 | 499 | 327 | 65.1 | 34.9 | 22.9 | |
| Cork City | 1,372 | 733 | 639 | 306 | 53.4 | 46.6 | 22.3 | |
| Cork County | 5,472 | 3,724 | 1,748 | 1,182 | 68.1 | 31.9 | 21.6 | |
| Kerry | 1,626 | 1,004 | 622 | 415 | 61.7 | 38.3 | 25.5 | |
| Limerick City | 783 | 337 | 446 | 195 | 43.0 | 57.0 | 24.9 | |
| Limerick County | 1,790 | 1,137 | 653 | 397 | 63.5 | 36.5 | 22.2 | |
| North Tipperary | 940 | 619 | 321 | 219 | 65.9 | 34.1 | 23.3 | |
| South Tipperary | 1,095 | 572 | 523 | 283 | 52.2 | 47.8 | 25.8 | |
| Waterford City | 567 | 260 | 307 | 159 | 45.9 | 54.1 | 28.0 | |
| Waterford County | 839 | 480 | 359 | 201 | 57.2 | 42.8 | 24.0 | |
| CONNACHT | 6,787 | 4,661 | 2,126 | 1,397 | 68.7 | 31.3 | 20.6 | |
| Galway City | 916 | 595 | 321 | 219 | 65.0 | 35.0 | 23.9 | |
| Galway County | 2,412 | 1,756 | 656 | 451 | 72.8 | 27.2 | 18.7 | |
| Leitrim | 408 | 295 | 113 | 82 | 72.3 | 27.7 | 20.1 | |
| Mayo | 1,542 | 1,012 | 530 | 333 | 65.6 | 34.4 | 21.6 | |
| Roscommon | 772 | 540 | 232 | 161 | 69.9 | 30.1 | 20.9 | |
| Sligo | 737 | 463 | 274 | 151 | 62.8 | 37.2 | 20.5 | |
| ULSTER (PART OF) | 3,746 | 2,359 | 1,387 | 809 | 63.0 | 37.0 | 21.6 | |
| Cavan | 1,081 | 704 | 377 | 255 | 65.1 | 34.9 | 23.6 | |
| Donegal | 1,864 | 1,129 | 735 | 396 | 60.6 | 39.4 | 21.2 | |
| Monaghan | 801 | 526 | 275 | 158 | 65.7 | 34.3 | 19.7 | |
| REGIONAL AUTHORITIES: | ||||||||
| Border | 6629 | 4087 | 2542 | 1456 | 61.7 | 38.3 | 22.0 | |
| Midland | 3,989 | 2,425 | 1,564 | 993 | 60.8 | 39.2 | 24.9 | |
| West | 5,642 | 3,903 | 1,739 | 1,164 | 69.2 | 30.8 | 20.6 | |
| Dublin | 18,194 | 11,321 | 6,873 | 3,689 | 62.2 | 37.8 | 20.3 | |
| Mid-East | 7,825 | 4,965 | 2,860 | 1,766 | 63.5 | 36.5 | 22.6 | |
| Mid-West | 4,943 | 3,024 | 1,919 | 1,138 | 61.2 | 38.8 | 23.0 | |
| South-East | 6,361 | 3,527 | 2,834 | 1,636 | 55.4 | 44.6 | 25.7 | |
| South-West | 8,470 | 5,461 | 3,009 | 1,903 | 64.5 | 35.5 | 22.5 | |
| Table 7 Births registered, classified by area of residence and age of mother, 2017 | ||||||||||
| Area of residence | Total | Under 20 | 20-24 | 25-29 | 30-34 | 35-39 | 40 and over | Age not stated | Average age of mother at maternity | |
| All births | First births | |||||||||
| STATE | 62,053 | 1,041 | 5,143 | 10,886 | 21,762 | 18,979 | 4,242 | – | 32.8 | 31.0 |
| LEINSTER | 35,606 | 640 | 3,049 | 6,323 | 12,356 | 10,835 | 2,403 | – | 32.7 | 31.0 |
| Carlow | 766 | 11 | 90 | 165 | 263 | 191 | 46 | – | 31.9 | 30.1 |
| Dublin City | 7,045 | 153 | 686 | 1,314 | 2,286 | 2,120 | 486 | – | 32.5 | 31.3 |
| South Dublin | 4,000 | 60 | 370 | 802 | 1,406 | 1,096 | 266 | – | 32.4 | 30.5 |
| Fingal | 4,552 | 49 | 300 | 801 | 1,611 | 1,482 | 309 | – | 33.1 | 31.4 |
| Dun Laoghaire Rathdown | 2,597 | 33 | 78 | 226 | 929 | 1,100 | 231 | – | 34.7 | 33.1 |
| Kildare | 3,182 | 62 | 234 | 497 | 1,155 | 1,013 | 221 | – | 33.0 | 31.0 |
| Kilkenny | 1,183 | 20 | 86 | 183 | 426 | 377 | 91 | – | 33.2 | 31.4 |
| Laois | 1,207 | 27 | 126 | 221 | 446 | 320 | 67 | – | 32.1 | 29.8 |
| Longford | 558 | 25 | 87 | 115 | 162 | 146 | 23 | – | 31.0 | 28.3 |
| Louth | 1,738 | 44 | 177 | 359 | 606 | 460 | 92 | – | 31.9 | 29.7 |
| Meath | 2,752 | 30 | 213 | 461 | 1,010 | 858 | 180 | – | 32.9 | 31.1 |
| Offaly | 990 | 18 | 125 | 202 | 320 | 264 | 61 | – | 31.9 | 29.8 |
| Westmeath | 1,234 | 21 | 115 | 255 | 432 | 343 | 68 | – | 32.2 | 30.7 |
| Wexford | 1,911 | 54 | 216 | 380 | 640 | 502 | 119 | – | 31.9 | 30.0 |
| Wicklow | 1,891 | 33 | 146 | 342 | 664 | 563 | 143 | – | 32.8 | 30.8 |
| MUNSTER | 15,914 | 254 | 1,314 | 2,709 | 5,683 | 4,889 | 1,065 | – | 32.8 | 31.0 |
| Clare | 1,430 | 19 | 122 | 222 | 501 | 464 | 102 | – | 33.0 | 31.5 |
| Cork City | 1,372 | 37 | 159 | 274 | 452 | 356 | 94 | – | 32.0 | 30.4 |
| Cork County | 5,472 | 46 | 291 | 774 | 2,085 | 1,890 | 386 | – | 33.6 | 31.9 |
| Kerry | 1,626 | 21 | 138 | 262 | 599 | 481 | 125 | – | 32.9 | 31.0 |
| Limerick City | 783 | 36 | 123 | 181 | 252 | 161 | 30 | – | 30.6 | 28.0 |
| Limerick County | 1,790 | 22 | 125 | 314 | 662 | 555 | 112 | – | 32.9 | 31.6 |
| North Tipperary | 940 | 22 | 78 | 142 | 322 | 309 | 67 | – | 32.9 | 30.8 |
| South Tipperary | 1,095 | 21 | 130 | 245 | 357 | 289 | 53 | – | 31.7 | 29.8 |
| Waterford City | 567 | 15 | 69 | 149 | 166 | 134 | 34 | – | 31.4 | 29.3 |
| Waterford County | 839 | 15 | 79 | 146 | 287 | 250 | 62 | – | 32.7 | 31.0 |
| CONNACHT | 6,787 | 80 | 453 | 1,066 | 2,340 | 2,272 | 576 | – | 33.4 | 31.7 |
| Galway City | 916 | 9 | 60 | 157 | 305 | 296 | 89 | – | 33.5 | 32.9 |
| Galway County | 2,412 | 25 | 140 | 333 | 806 | 883 | 225 | – | 33.8 | 32.0 |
| Leitrim | 408 | 2 | 29 | 54 | 156 | 140 | 27 | – | 33.4 | 31.5 |
| Mayo | 1,542 | 14 | 102 | 264 | 561 | 466 | 135 | – | 33.2 | 31.4 |
| Roscommon | 772 | 16 | 55 | 123 | 277 | 256 | 45 | – | 32.9 | 31.3 |
| Sligo | 737 | 14 | 67 | 135 | 235 | 231 | 55 | – | 32.7 | 30.3 |
| ULSTER (PART OF) | 3,746 | 67 | 327 | 788 | 1,383 | 983 | 198 | – | 32.2 | 29.8 |
| Cavan | 1,081 | 18 | 100 | 208 | 433 | 264 | 58 | – | 32.2 | 30.2 |
| Donegal | 1,864 | 38 | 164 | 417 | 637 | 511 | 97 | – | 32.1 | 29.6 |
| Monaghan | 801 | 11 | 63 | 163 | 313 | 208 | 43 | – | 32.4 | 29.8 |
| REGIONAL AUTHORITIES: | ||||||||||
| Border | 6,629 | 127 | 600 | 1,336 | 2,380 | 1,814 | 372 | – | 32.3 | 29.9 |
| Midland | 3,989 | 91 | 453 | 793 | 1,360 | 1,073 | 219 | – | 31.9 | 29.9 |
| West | 5,642 | 64 | 357 | 877 | 1,949 | 1,901 | 494 | – | 33.5 | 31.9 |
| Dublin | 18,194 | 295 | 1,434 | 3,143 | 6,232 | 5,798 | 1,292 | – | 33.0 | 31.4 |
| Mid-East | 7,825 | 125 | 593 | 1,300 | 2,829 | 2,434 | 544 | – | 32.9 | 31.0 |
| Mid-West | 4,943 | 99 | 448 | 859 | 1,737 | 1,489 | 311 | – | 32.6 | 30.8 |
| South-East | 6,361 | 136 | 670 | 1,268 | 2,139 | 1,743 | 405 | – | 32.2 | 30.3 |
| South-West | 8,470 | 104 | 588 | 1,310 | 3,136 | 2,727 | 605 | – | 33.2 | 31.4 |
| Table 8 Births registered outside marriage/civil partnership, classified by area of residence and age of mother, 2017 | |||||||||||
| Area of residence | Total | Under 25 | 25-29 | 30-34 | 35-39 | 40 and over | Age not stated | Average age of mother at maternity | |||
| All births | First births | ||||||||||
| STATE | 23,340 | 5,077 | 6,544 | 6,280 | 4,237 | 1,202 | – | 30.2 | 28.7 | ||
| LEINSTER | 13,710 | 3,018 | 3,771 | 3,737 | 2,472 | 712 | – | 30.2 | 28.8 | ||
| Carlow | 314 | 83 | 93 | 81 | 40 | 17 | – | 29.4 | 27.3 | ||
| Dublin City | 3,013 | 684 | 801 | 787 | 578 | 163 | – | 30.2 | 29.1 | ||
| South Dublin | 1,669 | 361 | 506 | 454 | 260 | 88 | – | 30.0 | 28.6 | ||
| Fingal | 1,531 | 255 | 395 | 449 | 345 | 87 | – | 31.1 | 29.8 | ||
| Dun Laoghaire Rathdown | 660 | 92 | 112 | 209 | 191 | 56 | – | 32.4 | 31.3 | ||
| Kildare | 1,116 | 247 | 296 | 303 | 210 | 60 | – | 30.2 | 28.5 | ||
| Kilkenny | 413 | 84 | 124 | 122 | 60 | 23 | – | 30.1 | 28.4 | ||
| Laois | 482 | 129 | 136 | 129 | 67 | 21 | – | 29.3 | 27.6 | ||
| Longford | 231 | 83 | 56 | 47 | 40 | 5 | – | 28.3 | 25.5 | ||
| Louth | 768 | 189 | 233 | 205 | 114 | 27 | – | 29.4 | 27.4 | ||
| Meath | 971 | 205 | 264 | 273 | 185 | 44 | – | 30.3 | 28.6 | ||
| Offaly | 366 | 108 | 111 | 92 | 42 | 13 | – | 28.7 | 27.1 | ||
| Westmeath | 485 | 107 | 148 | 142 | 65 | 23 | – | 29.6 | 28.4 | ||
| Wexford | 918 | 231 | 278 | 233 | 137 | 39 | – | 29.4 | 27.8 | ||
| Wicklow | 773 | 160 | 218 | 211 | 138 | 46 | – | 30.4 | 28.9 | ||
| MUNSTER | 6,117 | 1,338 | 1,721 | 1,651 | 1,111 | 296 | – | 30.1 | 28.6 | ||
| Clare | 499 | 120 | 135 | 134 | 90 | 20 | – | 29.9 | 28.8 | ||
| Cork City | 639 | 171 | 167 | 164 | 113 | 24 | – | 29.6 | 28.2 | ||
| Cork County | 1,748 | 291 | 474 | 505 | 370 | 108 | – | 31.0 | 29.5 | ||
| Kerry | 622 | 129 | 171 | 189 | 101 | 32 | – | 30.3 | 28.9 | ||
| Limerick City | 446 | 145 | 128 | 99 | 64 | 10 | – | 28.6 | 26.0 | ||
| Limerick County | 653 | 115 | 187 | 181 | 127 | 43 | – | 30.8 | 29.5 | ||
| North Tipperary | 321 | 78 | 91 | 87 | 52 | 13 | – | 29.5 | 28.3 | ||
| South Tipperary | 523 | 135 | 174 | 132 | 66 | 16 | – | 29.1 | 27.5 | ||
| Waterford City | 307 | 74 | 101 | 67 | 53 | 12 | – | 29.5 | 27.4 | ||
| Waterford County | 359 | 80 | 93 | 93 | 75 | 18 | – | 30.4 | 29.2 | ||
| CONNACHT | 2,126 | 377 | 606 | 568 | 439 | 136 | – | 30.9 | 29.5 | ||
| Galway City | 321 | 41 | 84 | 88 | 77 | 31 | – | 32.1 | 31.9 | ||
| Galway County | 656 | 107 | 185 | 177 | 152 | 35 | – | 30.9 | 29.5 | ||
| Leitrim | 113 | 20 | 28 | 30 | 26 | 9 | – | 31.1 | 29.7 | ||
| Mayo | 530 | 85 | 165 | 147 | 95 | 38 | – | 31.0 | 29.2 | ||
| Roscommon | 232 | 54 | 70 | 62 | 36 | 10 | – | 29.6 | 28.4 | ||
| Sligo | 274 | 70 | 74 | 64 | 53 | 13 | – | 29.8 | 27.9 | ||
| ULSTER (PART OF) | 1,387 | 344 | 446 | 324 | 215 | 58 | – | 29.4 | 27.2 | ||
| Cavan | 377 | 101 | 122 | 82 | 53 | 19 | – | 29.2 | 27.3 | ||
| Donegal | 735 | 180 | 237 | 170 | 119 | 29 | – | 29.4 | 27.2 | ||
| Monaghan | 275 | 63 | 87 | 72 | 43 | 10 | – | 29.6 | 27.1 | ||
| REGIONAL AUTHORITIES: | |||||||||||
| Border | 2,542 | 623 | 781 | 623 | 408 | 107 | – | 29.5 | 27.5 | ||
| Midland | 1,564 | 427 | 451 | 410 | 214 | 62 | – | 29.1 | 27.4 | ||
| West | 1739 | 287 | 504 | 474 | 360 | 114 | – | 31.0 | 29.7 | ||
| Dublin | 6,873 | 1,392 | 1,814 | 1,899 | 1,374 | 394 | – | 30.6 | 29.4 | ||
| Mid-East | 2,860 | 612 | 778 | 787 | 533 | 150 | – | 30.3 | 28.7 | ||
| Mid-West | 1,919 | 458 | 541 | 501 | 333 | 86 | – | 29.8 | 28.3 | ||
| South-East | 2,834 | 687 | 863 | 728 | 431 | 125 | – | 29.6 | 27.9 | ||
| South-West | 3,009 | 591 | 812 | 858 | 584 | 164 | – | 30.6 | 29.1 | ||
| Table 9 Births registered, classified by nationality of mother, marital status and age, 2017 | |||||||
| Nationality of mother | Total births | Births inside marriage/civil partnership | Births outside marriage/civil partnership | Average age of mother at maternity | |||
| Number | Percentage | Number | Percentage | Number | Percentage | ||
| TOTAL | 62,053 | 100.0 | 38,713 | 62.4 | 23,340 | 37.6 | 32.8 |
| Ireland | 47,991 | 77.3 | 29,700 | 61.9 | 18,291 | 38.1 | 33.1 |
| United Kingdom | 1,338 | 2.2 | 736 | 55.0 | 602 | 45.0 | 32.3 |
| EU15 excl. Irl & UK | 1,148 | 1.9 | 692 | 60.3 | 456 | 39.7 | 34.2 |
| EU15 to EU 28 * | 7,119 | 11.5 | 4,114 | 57.8 | 3,005 | 42.2 | 31.2 |
| Other | 4,402 | 7.1 | 3,429 | 77.9 | 973 | 22.1 | 32.0 |
| Not stated | 55 | 0.1 | 42 | 76.4 | 13 | 23.6 | 33.4 |
| * Croatia included in EU 15 to EU 28 from q3 2013. | |||||||
| Table 10 Deaths registered by county of residence of deceased, 2017 | ||||
| Area of residence | Total | Male | Female | Rate1 |
| STATE | 30,484 | 15,497 | 14,987 | 6.4 |
| LEINSTER | 15,487 | 7,777 | 7,710 | 5.8 |
| Carlow | 389 | 203 | 186 | 6.8 |
| Dublin City | 4,165 | 2,029 | 2,136 | 7.6 |
| South Dublin | 1,278 | 688 | 590 | 5.7 |
| Fingal | 1,055 | 533 | 522 | 3.5 |
| Dun Laoghaire Rathdown | 1,490 | 667 | 823 | 5.3 |
| Kildare | 1,029 | 534 | 495 | 4.5 |
| Kilkenny | 633 | 317 | 316 | 6.3 |
| Laois | 485 | 264 | 221 | 5.6 |
| Longford | 299 | 140 | 159 | 7.2 |
| Louth | 805 | 389 | 416 | 6.2 |
| Meath | 883 | 467 | 416 | 4.4 |
| Offaly | 489 | 245 | 244 | 6.2 |
| Westmeath | 556 | 282 | 274 | 6.2 |
| Wexford | 1,081 | 572 | 509 | 7.1 |
| Wicklow | 850 | 447 | 403 | 5.9 |
| MUNSTER | 9,047 | 4,573 | 4,474 | 7.0 |
| Clare | 799 | 388 | 411 | 6.7 |
| Cork City | 1,129 | 576 | 553 | 9.2 |
| Cork County | 2,624 | 1,320 | 1,304 | 6.2 |
| Kerry | 1,140 | 608 | 532 | 7.8 |
| Limerick City | 540 | 252 | 288 | 9.4 |
| Limerick County | 789 | 387 | 402 | 5.7 |
| North Tipperary | 556 | 279 | 277 | 7.7 |
| South Tipperary | 705 | 351 | 354 | 7.9 |
| Waterford City | 324 | 170 | 154 | 6.8 |
| Waterford County | 441 | 242 | 199 | 6.4 |
| CONNACHT | 3,847 | 2,028 | 1,819 | 7.0 |
| Galway City | 381 | 191 | 190 | 5.1 |
| Galway County | 1,179 | 630 | 549 | 6.5 |
| Leitrim | 263 | 150 | 113 | 8.1 |
| Mayo | 1,076 | 554 | 522 | 8.2 |
| Roscommon | 455 | 243 | 212 | 6.9 |
| Sligo | 493 | 260 | 233 | 7.5 |
| ULSTER (PART OF) | 2,103 | 1,119 | 984 | 7.0 |
| Cavan | 488 | 265 | 223 | 6.4 |
| Donegal | 1,186 | 638 | 548 | 7.4 |
| Monaghan | 429 | 216 | 213 | 6.9 |
| REGIONAL AUTHORITIES: | ||||
| Border | 3,664 | 1,918 | 1,746 | 6.9 |
| Midland | 1,829 | 931 | 898 | 6.2 |
| West | 3,091 | 1,618 | 1,473 | 6.8 |
| Dublin | 7,988 | 3,917 | 4,071 | 5.9 |
| Mid-East | 2,762 | 1,448 | 1,314 | 4.8 |
| Mid-West | 2,684 | 1,306 | 1,378 | 6.9 |
| South-East | 3,573 | 1,855 | 1,718 | 6.9 |
| South-West | 4,893 | 2,504 | 2,389 | 7.1 |
| 1 Deaths per year per 1,000 population. Annual rates based on estimated 2017 Usual Residence population. | ||||
| Table 11 Deaths registered by cause of death and county of residence of deceased, 2017 | ||||||
| Area of residence | Total Deaths | Malignant Neoplasms | Diseases of the Circulatory system | Diseases of the Respiratory system | External causes | All other causes |
| STATE | 30,484 | 9,175 | 8,927 | 4,079 | 1,315 | 6,988 |
| LEINSTER | 15,487 | 4,797 | 4,408 | 2,048 | 632 | 3,602 |
| Carlow | 389 | 104 | 125 | 49 | 14 | 97 |
| Dublin City | 4,165 | 1,227 | 1,188 | 562 | 154 | 1,034 |
| South Dublin | 1,278 | 414 | 346 | 162 | 58 | 298 |
| Fingal | 1,055 | 373 | 267 | 133 | 50 | 232 |
| Dun Laoghaire Rathdown | 1,490 | 438 | 441 | 207 | 33 | 371 |
| Kildare | 1,029 | 328 | 307 | 124 | 54 | 216 |
| Kilkenny | 633 | 205 | 203 | 80 | 24 | 121 |
| Laois | 485 | 138 | 145 | 60 | 23 | 119 |
| Longford | 299 | 75 | 86 | 57 | 15 | 66 |
| Louth | 805 | 253 | 200 | 135 | 38 | 179 |
| Meath | 883 | 303 | 227 | 118 | 50 | 185 |
| Offaly | 489 | 144 | 141 | 56 | 27 | 121 |
| Westmeath | 556 | 176 | 165 | 66 | 23 | 126 |
| Wexford | 1,081 | 350 | 348 | 136 | 40 | 207 |
| Wicklow | 850 | 269 | 219 | 103 | 29 | 230 |
| MUNSTER | 9,047 | 2,667 | 2,722 | 1,228 | 405 | 2,025 |
| Clare | 799 | 221 | 230 | 131 | 36 | 181 |
| Cork City | 1,129 | 344 | 352 | 142 | 74 | 217 |
| Cork County | 2,624 | 769 | 793 | 325 | 123 | 614 |
| Kerry | 1,140 | 315 | 377 | 151 | 37 | 260 |
| Limerick City | 540 | 157 | 156 | 85 | 17 | 125 |
| Limerick County | 789 | 253 | 215 | 114 | 21 | 186 |
| North Tipperary | 556 | 155 | 177 | 79 | 32 | 113 |
| South Tipperary | 705 | 214 | 202 | 92 | 27 | 170 |
| Waterford City | 324 | 103 | 95 | 42 | 16 | 68 |
| Waterford County | 441 | 136 | 125 | 67 | 22 | 91 |
| CONNACHT | 3,847 | 1,096 | 1,179 | 514 | 185 | 873 |
| Galway City | 381 | 118 | 103 | 34 | 30 | 96 |
| Galway County | 1,179 | 324 | 375 | 148 | 58 | 274 |
| Leitrim | 263 | 68 | 87 | 39 | 13 | 56 |
| Mayo | 1,076 | 304 | 334 | 165 | 35 | 238 |
| Roscommon | 455 | 137 | 127 | 68 | 25 | 98 |
| Sligo | 493 | 145 | 153 | 60 | 24 | 111 |
| ULSTER (PART OF) | 2,103 | 615 | 618 | 289 | 93 | 488 |
| Cavan | 488 | 159 | 139 | 57 | 28 | 105 |
| Donegal | 1,186 | 336 | 336 | 172 | 43 | 299 |
| Monaghan | 429 | 120 | 143 | 60 | 22 | 84 |
| REGIONAL AUTHORITIES: | ||||||
| Border | 3,664 | 1,081 | 1,058 | 523 | 168 | 834 |
| Midland | 1,829 | 533 | 537 | 239 | 88 | 432 |
| West | 3,091 | 883 | 939 | 415 | 148 | 706 |
| Dublin | 7,988 | 2,452 | 2,242 | 1,064 | 295 | 1,935 |
| Mid-East | 2,762 | 900 | 753 | 345 | 133 | 631 |
| Mid-West | 2,684 | 786 | 778 | 409 | 106 | 605 |
| South-East | 3,573 | 1,112 | 1,098 | 466 | 143 | 754 |
| South-West | 4,893 | 1,428 | 1,522 | 618 | 234 | 1,091 |
| Table 12 Deaths registered classified by cause and age-group, 2017 | ||||||||||||||||
| Age Group | ||||||||||||||||
| Cause of Death | 65 COD | ICD-10 | Total | Under 1 | 1-4 | 5-14 | 15-24 | 25-34 | 35-44 | 45-54 | 55-64 | 65-74 | 75-84 | 85 and | ||
| Code | Code | Deaths | over | |||||||||||||
| Total deaths | 0 | A00-Y89 | 30,484 | 174 | 28 | 45 | 175 | 306 | 679 | 1,312 | 2,739 | 5,364 | 8,994 | 10,668 | ||
| Infectious and parasitic diseases:- | 1 | A00-B99 | 291 | – | 1 | 1 | – | 6 | 15 | 20 | 23 | 48 | 77 | 100 | ||
| Tuberculosis | 2 | A15-A19,B90 | 15 | – | – | – | – | – | 1 | 3 | 1 | 2 | 1 | 7 | ||
| Meningococcal infection | 3 | A39 | 4 | – | – | 1 | – | – | – | – | 1 | – | 1 | 1 | ||
| AIDS (HIV Disease) | 4 | B20-B24 | 11 | – | – | – | – | 2 | 3 | 2 | 3 | 1 | – | – | ||
| Viral Hepatitis | 5 | B15-B19 | 26 | – | – | – | – | 2 | 7 | 7 | 5 | 3 | 1 | 1 | ||
| Other infectious and parasitic | 235 | – | 1 | – | – | 2 | 4 | 8 | 13 | 42 | 74 | 91 | ||||
| diseases | ||||||||||||||||
| Neoplasms | 6 | C00-D48 | 9,441 | – | 7 | 11 | 18 | 57 | 198 | 583 | 1,370 | 2,514 | 2,971 | 1,712 | ||
| Malignant Neoplasms of the:- | 7 | C00-C97 | 9,175 | – | 7 | 11 | 16 | 57 | 193 | 578 | 1,356 | 2,473 | 2,876 | 1,608 | ||
| Lip, oral cavity, pharynx | 8 | C00-C14 | 195 | – | – | – | – | 1 | 3 | 21 | 43 | 72 | 35 | 20 | ||
| Oesophagus | 9 | C15 | 393 | – | – | – | – | 3 | 7 | 23 | 70 | 118 | 117 | 55 | ||
| Stomach | 10 | C16 | 318 | – | – | – | – | 2 | 8 | 26 | 44 | 85 | 95 | 58 | ||
| Colon | 11 | C18 | 469 | – | – | – | – | 2 | 10 | 25 | 67 | 107 | 140 | 118 | ||
| Rectum and anus | 12 | C19-C21 | 555 | – | – | – | – | 2 | 9 | 45 | 85 | 148 | 181 | 85 | ||
| Liver and the intrahepatic bile ducts | 13 | C22 | 382 | – | – | – | – | 3 | 5 | 19 | 62 | 109 | 131 | 53 | ||
| Pancreas | 14 | C25 | 525 | – | – | – | – | – | 5 | 39 | 75 | 157 | 158 | 91 | ||
| Larynx and trachea/bronchus /lung | 15 | C32-C34 | 1,997 | – | – | 1 | 1 | 1 | 14 | 89 | 343 | 657 | 659 | 232 | ||
| Skin | 16 | C43 | 148 | – | – | – | – | 4 | 10 | 11 | 24 | 23 | 39 | 37 | ||
| Breast | 17 | C50 | 758 | – | – | – | – | 4 | 42 | 103 | 128 | 161 | 184 | 136 | ||
| Cervix uteri | 18 | C53 | 82 | – | 1 | – | – | 3 | 9 | 15 | 17 | 18 | 15 | 4 | ||
| Other parts of uterus | 19 | C54-C55 | 126 | – | – | – | – | – | – | 6 | 16 | 43 | 44 | 17 | ||
| Ovary | 20 | C56 | 305 | – | – | – | – | 1 | 4 | 15 | 68 | 97 | 82 | 38 | ||
| Prostate | 21 | C61 | 583 | – | – | – | – | – | – | 4 | 35 | 127 | 234 | 183 | ||
| Kidney | 22 | C64 | 194 | – | – | – | – | – | 6 | 21 | 31 | 50 | 57 | 29 | ||
| Bladder | 23 | C67 | 213 | – | – | – | – | – | 2 | 6 | 20 | 40 | 84 | 61 | ||
| Lymph/haematopoietic tissue | 24 | C81-C96 | 774 | – | – | 4 | 6 | 7 | 17 | 30 | 65 | 182 | 284 | 179 | ||
| Other malignant neoplasms | 1,158 | – | 6 | 6 | 9 | 24 | 42 | 80 | 163 | 279 | 337 | 212 | ||||
| Diseases of the blood and | ||||||||||||||||
| blood-forming organs, | ||||||||||||||||
| immunological disorders | 25 | D50-D89 | 97 | 1 | – | – | – | 1 | 4 | 4 | 12 | 20 | 25 | 30 | ||
| Endocrine, Nutritional and metabolic | ||||||||||||||||
| diseases | 26 | E00-E90 | 749 | 2 | 1 | 2 | 6 | 10 | 18 | 16 | 34 | 131 | 271 | 258 | ||
| Diabetes mellitus | 27 | E10-E14 | 551 | – | – | – | – | 3 | 6 | 9 | 20 | 98 | 220 | 195 | ||
| Mental and behavioural disorders | 28 | F00-F99 | 1,726 | – | – | – | 2 | – | 1 | 4 | 19 | 96 | 492 | 1,112 | ||
| Alcohol abuse (including alcoholic | ||||||||||||||||
| psychosis) | 29 | F10 | 13 | – | – | – | – | – | – | 2 | 1 | 5 | 5 | – | ||
| Drug dependence, toxicomania | 30 | F11-F16,F18-F19 | – | – | – | – | – | – | – | – | – | – | – | – | ||
| Diseases of the nervous system and | ||||||||||||||||
| the sense organs | 31 | G00-H95 | 1,544 | 4 | 3 | 8 | 15 | 13 | 32 | 45 | 110 | 237 | 545 | 532 | ||
| Meningitis | 32 | G00-G03 | 6 | 1 | – | – | – | – | – | 2 | 1 | – | 1 | 1 | ||
| Diseases of the Circulatory System:- | 33 | I00-I99 | 8,927 | 1 | 1 | – | 8 | 24 | 109 | 278 | 641 | 1,297 | 2,589 | 3,979 | ||
| Ischaemic heart disease | 34 | I20-I25 | 4,238 | – | – | – | – | 4 | 51 | 164 | 383 | 732 | 1,252 | 1,652 | ||
| of which: (Acute myocardial infarction) | I21 | 1,744 | – | – | – | – | 2 | 15 | 56 | 146 | 262 | 531 | 732 | |||
| Other heart disease | 35 | I30-I33,I39-I52 | 1,652 | – | – | – | 6 | 9 | 22 | 30 | 91 | 170 | 407 | 917 | ||
| Cerebrovascular disease | 36 | I60-I69 | 1,710 | – | – | – | 1 | 5 | 24 | 44 | 92 | 226 | 498 | 820 | ||
| Other diseases of circulatory system | 1,327 | 1 | 1 | – | 1 | 6 | 12 | 40 | 75 | 169 | 432 | 590 | ||||
| Diseases of the Respiratory system | 37 | J00-J99 | 4,079 | 2 | 3 | 4 | 2 | 8 | 12 | 41 | 161 | 569 | 1,342 | 1,935 | ||
| Influenza | 38 | J10-J11 | 56 | – | – | 1 | – | – | – | 1 | 2 | 9 | 19 | 24 | ||
| Pneumonia | 39 | J12-J19 | 1,109 | – | 2 | 1 | 1 | 3 | 2 | 10 | 27 | 60 | 268 | 735 | ||
| Chronic Lower respiratory disease | 40 | J40-J47 | 1,610 | – | – | 2 | 1 | 1 | 2 | 16 | 78 | 313 | 602 | 595 | ||
| of which: Asthma | 41 | J45-J46 | 56 | – | – | 2 | 1 | 1 | 1 | – | 4 | 9 | 15 | 23 | ||
| Other diseases of the respiratory | 1,304 | 2 | 1 | – | – | 4 | 8 | 14 | 54 | 187 | 453 | 581 | ||||
| system | ||||||||||||||||
| Diseases of the Digestive system | 42 | K00-K93 | 1,059 | – | 1 | – | 2 | 7 | 56 | 92 | 157 | 178 | 265 | 301 | ||
| Ulcer of stomach, duodenum and | ||||||||||||||||
| jejunum | 43 | K25-K28 | 64 | – | – | – | – | – | 6 | 2 | 9 | 9 | 18 | 20 | ||
| Chronic liver disease | 44 | K70,K73-K74 | 285 | – | – | – | – | 2 | 38 | 53 | 97 | 57 | 29 | 9 | ||
| Other diseases of the digestive | 710 | – | 1 | – | 2 | 5 | 12 | 37 | 51 | 112 | 218 | 272 | ||||
| system | ||||||||||||||||
| Diseases of the skin and subcutaneous | ||||||||||||||||
| tissue | 45 | L00-L99 | 57 | – | – | – | – | – | – | 1 | 1 | 10 | 11 | 34 | ||
| Diseases of the musculoskeletal | ||||||||||||||||
| system/connective tissue | 46 | M00-M99 | 234 | – | – | – | 2 | 1 | 2 | 8 | 6 | 41 | 76 | 98 | ||
| Rheumatoid arthritis and | ||||||||||||||||
| osteoarthrosis | 47 | M05-M06,M15-M19 | 65 | – | – | – | – | – | – | – | 1 | 9 | 29 | 26 | ||
| Diseases of the genitourinary system | 48 | N00-N99 | 611 | – | – | – | 1 | 1 | 1 | 5 | 17 | 61 | 186 | 339 | ||
| Diseases of the kidney and ureter | 49 | N00-N29 | 425 | – | – | – | 1 | 1 | 1 | 4 | 14 | 47 | 140 | 217 | ||
| Complications of pregnancy, childbirth | ||||||||||||||||
| and puerperium | 50 | O00-O99 | 2 | – | – | – | – | 1 | 1 | – | – | – | – | – | ||
| Certain conditions originating in the | ||||||||||||||||
| perinatal period1 | 51 | P00-P96 | 82 | 81 | – | – | – | – | – | 1 | – | – | – | – | ||
| Congenital malformations and | ||||||||||||||||
| chromosomal abnomalities | 52 | Q00-Q99 | 155 | 72 | 6 | 9 | 6 | 4 | 11 | 12 | 17 | 11 | 6 | 1 | ||
| Congenital malformations of the:- | ||||||||||||||||
| Nervous system | 53 | Q00-Q07 | 23 | 11 | 2 | 2 | 3 | 1 | 1 | 2 | 1 | – | – | – | ||
| Circulatory system | 54 | Q20-Q28 | 37 | 15 | 1 | 4 | 1 | 1 | 6 | 2 | 1 | 3 | 2 | 1 | ||
| Symptoms, signs, abnormal | ||||||||||||||||
| findings, ill-defined causes | 55 | R00-R99 | 115 | 9 | 1 | – | 1 | 1 | 3 | 9 | 5 | 3 | 8 | 75 | ||
| Sudden infant death syndrome | 56 | R95 | 8 | 8 | – | – | – | – | – | – | – | – | – | – | ||
| Unknown and unspecified causes | 57 | R96-R99 | 23 | – | 1 | – | 1 | 1 | 3 | 9 | 3 | 2 | – | 3 | ||
| External causes of injury and poisoning | 58 | V01-Y89 | 1,315 | 2 | 4 | 10 | 112 | 172 | 216 | 193 | 166 | 148 | 130 | 162 | ||
| Accidents | 59 | V01-X59 | 858 | 1 | 3 | 6 | 45 | 85 | 123 | 104 | 102 | 114 | 119 | 156 | ||
| of which: Transport accidents | 60 | V01-V99 | 145 | – | 1 | 5 | 20 | 23 | 22 | 18 | 15 | 21 | 10 | 10 | ||
| Accidental falls | 61 | W00-W19 | 219 | – | – | – | – | 3 | 9 | 18 | 21 | 41 | 59 | 68 | ||
| Accidental poisoning | 62 | X40-X49 | 231 | – | – | – | 15 | 43 | 76 | 48 | 31 | 13 | 5 | – | ||
| other accidents | 263 | 1 | 2 | 1 | 10 | 16 | 16 | 20 | 35 | 39 | 45 | 78 | ||||
| Suicide and intentional self harm | 63 | X60-X84 | 392 | – | – | 4 | 60 | 73 | 84 | 80 | 54 | 25 | 9 | 3 | ||
| Homicide/assault | 64 | X85-Y09 | 31 | – | 1 | – | 5 | 9 | 7 | 4 | 4 | 1 | – | – | ||
| Events of undetermined intent | 65 | Y10-Y34 | 27 | 1 | – | – | 2 | 5 | 2 | 5 | 6 | 5 | 1 | – | ||
| All other external causes | 7 | – | – | – | – | – | – | – | – | 3 | 1 | 3 | ||||
| 1 Stillbirths not included. | ||||||||||||||||
| Table 13 Male deaths registered classified by cause and age group, 2017 | ||||||||||||||||
| Age Group | ||||||||||||||||
| Cause of Death | 65 COD | ICD-10 | Total | Under 1 | 1-4 | 5-14 | 15-24 | 25-34 | 35-44 | 45-54 | 55-64 | 65-74 | 75-84 | 85 and | ||
| Code | Code | Males | over | |||||||||||||
| Total Male Deaths | 0 | A00-Y89 | 15,497 | 90 | 19 | 24 | 127 | 208 | 439 | 808 | 1,631 | 3,189 | 4,922 | 4,040 | ||
| Infectious and parasitic diseases:- | 1 | A00-B99 | 124 | – | 1 | – | – | 3 | 11 | 15 | 10 | 22 | 32 | 30 | ||
| Tuberculosis | 2 | A15-A19,B90 | 5 | – | – | – | – | – | 1 | 3 | 1 | – | – | – | ||
| Meningococcal infection | 3 | A39 | – | – | – | – | – | – | – | – | – | – | – | – | ||
| AIDS (HIV Disease) | 4 | B20-B24 | 7 | – | – | – | – | 1 | 1 | 2 | 2 | 1 | – | – | ||
| Viral Hepatitis | 5 | B15-B19 | 18 | – | – | – | – | 1 | 6 | 6 | 3 | 1 | 1 | – | ||
| Other infectious and parasitic | 94 | – | 1 | – | – | 1 | 3 | 4 | 4 | 20 | 31 | 30 | ||||
| diseases | ||||||||||||||||
| Neoplasms | 6 | C00-D48 | 5,022 | – | 5 | 4 | 13 | 30 | 85 | 282 | 734 | 1,403 | 1,643 | 823 | ||
| Malignant Neoplasms of the:- | 7 | C00-C97 | 4,874 | – | 5 | 4 | 11 | 30 | 81 | 279 | 725 | 1,371 | 1,590 | 778 | ||
| Lip, oral cavity, pharynx | 8 | C00-C14 | 141 | – | – | – | – | – | 3 | 16 | 34 | 54 | 22 | 12 | ||
| Oesophagus | 9 | C15 | 256 | – | – | – | – | 1 | 6 | 20 | 53 | 80 | 69 | 27 | ||
| Stomach | 10 | C16 | 221 | – | – | – | – | 1 | 6 | 20 | 34 | 62 | 64 | 34 | ||
| Colon | 11 | C18 | 268 | – | – | – | – | 1 | 7 | 17 | 34 | 69 | 80 | 60 | ||
| Rectum and anus | 12 | C19-C21 | 342 | – | – | – | – | 1 | 4 | 24 | 57 | 93 | 117 | 46 | ||
| Liver and the intrahepatic bile ducts | 13 | C22 | 241 | – | – | – | – | 2 | 4 | 10 | 45 | 67 | 94 | 19 | ||
| Pancreas | 14 | C25 | 260 | – | – | – | – | – | 2 | 17 | 44 | 86 | 88 | 23 | ||
| Larynx and trachea/bronchus /lung | 15 | C32-C34 | 1,097 | – | – | – | – | – | 9 | 55 | 200 | 371 | 342 | 120 | ||
| Skin | 16 | C43 | 83 | – | – | – | – | 1 | 6 | 7 | 12 | 14 | 25 | 18 | ||
| Breast | 17 | C50 | 6 | – | – | – | – | – | – | – | 1 | 4 | – | 1 | ||
| Cervix uteri | 18 | C53 | – | – | – | – | – | – | – | – | – | – | – | – | ||
| Other parts of uterus | 19 | C54-C55 | – | – | – | – | – | – | – | – | – | – | – | – | ||
| Ovary | 20 | C56 | – | – | – | – | – | – | – | – | – | – | – | – | ||
| Prostate | 21 | C61 | 583 | – | – | – | – | – | – | 4 | 35 | 127 | 234 | 183 | ||
| Kidney | 22 | C64 | 131 | – | – | – | – | – | 4 | 20 | 25 | 36 | 30 | 16 | ||
| Bladder | 23 | C67 | 150 | – | – | – | – | – | 1 | 3 | 15 | 28 | 59 | 44 | ||
| Lymph/haematopoietic tissue | 24 | C81-C96 | 448 | – | – | 3 | 5 | 5 | 6 | 20 | 39 | 111 | 169 | 90 | ||
| Other malignant neoplasms | 647 | – | 5 | 1 | 6 | 18 | 23 | 46 | 97 | 169 | 197 | 85 | ||||
| Diseases of the blood and | ||||||||||||||||
| blood-forming organs, | ||||||||||||||||
| immunological disorders | 25 | D50-D89 | 52 | – | – | – | – | 1 | 3 | 4 | 9 | 9 | 18 | 8 | ||
| Endocrine, Nutritional and metabolic | ||||||||||||||||
| diseases | 26 | E00-E90 | 404 | 1 | 1 | 1 | 4 | 2 | 12 | 12 | 17 | 81 | 153 | 120 | ||
| Diabetes mellitus | 27 | E10-E14 | 309 | – | – | – | – | 1 | 5 | 8 | 9 | 62 | 128 | 96 | ||
| Mental and behavioural disorders | 28 | F00-F99 | 582 | – | – | – | – | – | – | 3 | 5 | 47 | 241 | 286 | ||
| Alcohol abuse (including alcoholic | ||||||||||||||||
| psychosis) | 29 | F10 | 7 | – | – | – | – | – | – | 1 | – | 3 | 3 | – | ||
| Drug dependence, toxicomania | 30 | F11-F16,F18-F19 | – | – | – | – | – | – | – | – | – | – | – | – | ||
| Diseases of the nervous system and | ||||||||||||||||
| the sense organs | 31 | G00-H95 | 739 | 1 | 1 | 5 | 9 | 9 | 17 | 23 | 63 | 135 | 277 | 199 | ||
| Meningitis | 32 | G00-G03 | 4 | – | – | – | – | – | – | 1 | 1 | – | 1 | 1 | ||
| Diseases of the Circulatory System:- | 33 | I00-I99 | 4,589 | – | – | – | 7 | 17 | 79 | 216 | 464 | 890 | 1,493 | 1,423 | ||
| Ischaemic heart disease | 34 | I20-I25 | 2,526 | – | – | – | – | 3 | 45 | 134 | 302 | 556 | 789 | 697 | ||
| of which: (Acute myocardial infarction) | I21 | 980 | – | – | – | – | 2 | 12 | 45 | 111 | 199 | 327 | 284 | |||
| Other heart disease | 35 | I30-I33,I39-I52 | 752 | – | – | – | 6 | 8 | 17 | 23 | 70 | 108 | 230 | 290 | ||
| Cerebrovascular disease | 36 | I60-I69 | 719 | – | – | – | 1 | 3 | 11 | 29 | 42 | 127 | 254 | 252 | ||
| Other diseases of circulatory system | 592 | – | – | – | – | 3 | 6 | 30 | 50 | 99 | 220 | 184 | ||||
| Diseases of the Respiratory system | 37 | J00-J99 | 1,946 | 2 | 3 | 3 | 1 | 4 | 8 | 34 | 85 | 322 | 727 | 757 | ||
| Influenza | 38 | J10-J11 | 20 | – | – | 1 | – | – | – | 1 | 1 | 3 | 7 | 7 | ||
| Pneumonia | 39 | J12-J19 | 451 | – | 2 | – | 1 | – | 1 | 8 | 15 | 34 | 138 | 252 | ||
| Chronic Lower respiratory disease | 40 | J40-J47 | 804 | – | – | 2 | – | – | 2 | 12 | 34 | 168 | 323 | 263 | ||
| of which: Asthma | 41 | J45-J46 | 15 | – | – | 2 | – | – | 1 | – | 2 | 3 | 4 | 3 | ||
| Other diseases of the respiratory | 671 | 2 | 1 | – | – | 4 | 5 | 13 | 35 | 117 | 259 | 235 | ||||
| system | ||||||||||||||||
| Diseases of the Digestive system | 42 | K00-K93 | 553 | – | 1 | – | 2 | 5 | 41 | 60 | 90 | 102 | 129 | 123 | ||
| Ulcer of stomach, duodenum and | ||||||||||||||||
| jejunum | 43 | K25-K28 | 39 | – | – | – | – | – | 5 | 2 | 6 | 7 | 11 | 8 | ||
| Chronic liver disease | 44 | K70,K73-K74 | 182 | – | – | – | – | 1 | 25 | 35 | 59 | 43 | 13 | 6 | ||
| Other diseases of the digestive | 332 | – | 1 | – | 2 | 4 | 11 | 23 | 25 | 52 | 105 | 109 | ||||
| system | ||||||||||||||||
| Diseases of the skin and subcutaneous | ||||||||||||||||
| tissue | 45 | L00-L99 | 21 | – | – | – | – | – | – | 1 | 1 | 2 | 5 | 12 | ||
| Diseases of the musculoskeletal | ||||||||||||||||
| system/connective tissue | 46 | M00-M99 | 86 | – | – | – | 2 | – | 2 | 1 | 3 | 19 | 31 | 28 | ||
| Rheumatoid arthritis and | ||||||||||||||||
| osteoarthrosis | 47 | M05-M06,M15-M19 | 19 | – | – | – | – | – | – | – | – | 5 | 8 | 6 | ||
| Diseases of the genitourinary system | 48 | N00-N99 | 292 | – | – | – | 1 | – | – | 4 | 10 | 44 | 93 | 140 | ||
| Diseases of the kidney and ureter | 49 | N00-N29 | 214 | – | – | – | 1 | – | – | 3 | 8 | 33 | 72 | 97 | ||
| Complications of pregnancy, childbirth | ||||||||||||||||
| and puerperium | 50 | O00-O99 | – | – | – | – | – | – | – | – | – | – | – | – | ||
| Certain conditions originating in the | ||||||||||||||||
| perinatal period1 | 51 | P00-P96 | 45 | 44 | – | – | – | – | – | 1 | – | – | – | – | ||
| Congenital malformations and | ||||||||||||||||
| chromosomal abnomalities | 52 | Q00-Q99 | 71 | 37 | 3 | 3 | – | 2 | 8 | 3 | 9 | 5 | 1 | – | ||
| Congenital malformations of the:- | ||||||||||||||||
| Nervous system | 53 | Q00-Q07 | 8 | 5 | – | 1 | – | 1 | – | – | 1 | – | – | – | ||
| Circulatory system | 54 | Q20-Q28 | 20 | 9 | 1 | – | – | 1 | 6 | 2 | – | 1 | – | – | ||
| Symptoms, signs, abnormal | ||||||||||||||||
| findings, ill-defined causes | 55 | R00-R99 | 41 | 4 | – | – | – | – | 3 | 3 | 2 | – | 4 | 25 | ||
| Sudden infant death syndrome | 56 | R95 | 4 | 4 | – | – | – | – | – | – | – | – | – | – | ||
| Unknown and unspecified causes | 57 | R96-R99 | 7 | – | – | – | – | – | 3 | 3 | 1 | – | – | – | ||
| External causes of injury and poisoning | 58 | V01-Y89 | 930 | 1 | 4 | 8 | 88 | 135 | 170 | 146 | 129 | 108 | 75 | 66 | ||
| Accidents | 59 | V01-X59 | 572 | 1 | 3 | 6 | 41 | 64 | 91 | 77 | 76 | 85 | 65 | 63 | ||
| of which: Transport accidents | 60 | V01-V99 | 113 | – | 1 | 5 | 19 | 18 | 15 | 17 | 12 | 13 | 6 | 7 | ||
| Accidental falls | 61 | W00-W19 | 139 | – | – | – | – | 3 | 8 | 11 | 18 | 33 | 33 | 33 | ||
| Accidental poisoning | 62 | X40-X49 | 168 | – | – | – | 13 | 30 | 58 | 36 | 20 | 8 | 3 | – | ||
| other accidents | 152 | 1 | 2 | 1 | 9 | 13 | 10 | 13 | 26 | 31 | 23 | 23 | ||||
| Suicide and intentional self harm | 63 | X60-X84 | 312 | – | – | 2 | 42 | 60 | 71 | 61 | 46 | 19 | 9 | 2 | ||
| Homicide/assault | 64 | X85-Y09 | 28 | – | 1 | – | 4 | 8 | 7 | 4 | 4 | – | – | – | ||
| Events of undetermined intent | 65 | Y10-Y34 | 16 | – | – | – | 1 | 3 | 1 | 4 | 3 | 3 | 1 | – | ||
| All other external causes | 2 | – | – | – | – | – | – | – | – | 1 | – | 1 | ||||
| 1 Stillbirths not included. | ||||||||||||||||
| Table 14 Female deaths registered classified by cause and age group, 2017 | ||||||||||||||||
| Age Group | ||||||||||||||||
| Cause of Death | 65 COD | ICD-10 | Total | Under 1 | 1-4 | 5-14 | 15-24 | 25-34 | 35-44 | 45-54 | 55-64 | 65-74 | 75-84 | 85 and | ||
| Code | Code | Females | over | |||||||||||||
| Total Female Deaths | 0 | A00-Y89 | 14,987 | 84 | 9 | 21 | 48 | 98 | 240 | 504 | 1,108 | 2,175 | 4,072 | 6,628 | ||
| Infectious and parasitic diseases:- | 1 | A00-B99 | 167 | – | – | 1 | – | 3 | 4 | 5 | 13 | 26 | 45 | 70 | ||
| Tuberculosis | 2 | A15-A19,B90 | 10 | – | – | – | – | – | – | – | – | 2 | 1 | 7 | ||
| Meningococcal infection | 3 | A39 | 4 | – | – | 1 | – | – | – | – | 1 | – | 1 | 1 | ||
| AIDS (HIV Disease) | 4 | B20-B24 | 4 | – | – | – | – | 1 | 2 | – | 1 | – | – | – | ||
| Viral Hepatitis | 5 | B15-B19 | 8 | – | – | – | – | 1 | 1 | 1 | 2 | 2 | – | 1 | ||
| Other infectious and parasitic | 141 | – | – | – | – | 1 | 1 | 4 | 9 | 22 | 43 | 61 | ||||
| diseases | ||||||||||||||||
| Neoplasms | 6 | C00-D48 | 4,419 | – | 2 | 7 | 5 | 27 | 113 | 301 | 636 | 1,111 | 1,328 | 889 | ||
| Malignant Neoplasms of the:- | 7 | C00-C97 | 4,301 | – | 2 | 7 | 5 | 27 | 112 | 299 | 631 | 1,102 | 1,286 | 830 | ||
| Lip, oral cavity, pharynx | 8 | C00-C14 | 54 | – | – | – | – | 1 | – | 5 | 9 | 18 | 13 | 8 | ||
| Oesophagus | 9 | C15 | 137 | – | – | – | – | 2 | 1 | 3 | 17 | 38 | 48 | 28 | ||
| Stomach | 10 | C16 | 97 | – | – | – | – | 1 | 2 | 6 | 10 | 23 | 31 | 24 | ||
| Colon | 11 | C18 | 201 | – | – | – | – | 1 | 3 | 8 | 33 | 38 | 60 | 58 | ||
| Rectum and anus | 12 | C19-C21 | 213 | – | – | – | – | 1 | 5 | 21 | 28 | 55 | 64 | 39 | ||
| Liver and the intrahepatic bile ducts | 13 | C22 | 141 | – | – | – | – | 1 | 1 | 9 | 17 | 42 | 37 | 34 | ||
| Pancreas | 14 | C25 | 265 | – | – | – | – | – | 3 | 22 | 31 | 71 | 70 | 68 | ||
| Larynx and trachea/bronchus /lung | 15 | C32-C34 | 900 | – | – | 1 | 1 | 1 | 5 | 34 | 143 | 286 | 317 | 112 | ||
| Skin | 16 | C43 | 65 | – | – | – | – | 3 | 4 | 4 | 12 | 9 | 14 | 19 | ||
| Breast | 17 | C50 | 752 | – | – | – | – | 4 | 42 | 103 | 127 | 157 | 184 | 135 | ||
| Cervix uteri | 18 | C53 | 82 | – | 1 | – | – | 3 | 9 | 15 | 17 | 18 | 15 | 4 | ||
| Other parts of uterus | 19 | C54-C55 | 126 | – | – | – | – | – | – | 6 | 16 | 43 | 44 | 17 | ||
| Ovary | 20 | C56 | 305 | – | – | – | – | 1 | 4 | 15 | 68 | 97 | 82 | 38 | ||
| Prostate | 21 | C61 | – | – | – | – | – | – | – | – | – | – | – | – | ||
| Kidney | 22 | C64 | 63 | – | – | – | – | – | 2 | 1 | 6 | 14 | 27 | 13 | ||
| Bladder | 23 | C67 | 63 | – | – | – | – | – | 1 | 3 | 5 | 12 | 25 | 17 | ||
| Lymph/haematopoietic tissue | 24 | C81-C96 | 326 | – | – | 1 | 1 | 2 | 11 | 10 | 26 | 71 | 115 | 89 | ||
| Other malignant neoplasms | 511 | – | 1 | 5 | 3 | 6 | 19 | 34 | 66 | 110 | 140 | 127 | ||||
| Diseases of the blood and | ||||||||||||||||
| blood-forming organs, | ||||||||||||||||
| immunological disorders | 25 | D50-D89 | 45 | 1 | – | – | – | – | 1 | – | 3 | 11 | 7 | 22 | ||
| Endocrine, Nutritional and metabolic | ||||||||||||||||
| diseases | 26 | E00-E90 | 345 | 1 | – | 1 | 2 | 8 | 6 | 4 | 17 | 50 | 118 | 138 | ||
| Diabetes mellitus | 27 | E10-E14 | 242 | – | – | – | – | 2 | 1 | 1 | 11 | 36 | 92 | 99 | ||
| Mental and behavioural disorders | 28 | F00-F99 | 1,144 | – | – | – | 2 | – | 1 | 1 | 14 | 49 | 251 | 826 | ||
| Alcohol abuse (including alcoholic | ||||||||||||||||
| psychosis) | 29 | F10 | 6 | – | – | – | – | – | – | 1 | 1 | 2 | 2 | – | ||
| Drug dependence, toxicomania | 30 | F11-F16,F18-F19 | – | – | – | – | – | – | – | – | – | – | – | – | ||
| Diseases of the nervous system and | ||||||||||||||||
| the sense organs | 31 | G00-H95 | 805 | 3 | 2 | 3 | 6 | 4 | 15 | 22 | 47 | 102 | 268 | 333 | ||
| Meningitis | 32 | G00-G03 | 2 | 1 | – | – | – | – | – | 1 | – | – | – | – | ||
| Diseases of the Circulatory System:- | 33 | I00-I99 | 4,338 | 1 | 1 | – | 1 | 7 | 30 | 62 | 177 | 407 | 1,096 | 2,556 | ||
| Ischaemic heart disease | 34 | I20-I25 | 1,712 | – | – | – | – | 1 | 6 | 30 | 81 | 176 | 463 | 955 | ||
| of which: (Acute myocardial infarction) | I21 | 764 | – | – | – | – | – | 3 | 11 | 35 | 63 | 204 | 448 | |||
| Other heart disease | 35 | I30-I33,I39-I52 | 900 | – | – | – | – | 1 | 5 | 7 | 21 | 62 | 177 | 627 | ||
| Cerebrovascular disease | 36 | I60-I69 | 991 | – | – | – | – | 2 | 13 | 15 | 50 | 99 | 244 | 568 | ||
| Other diseases of circulatory system | 735 | 1 | 1 | – | 1 | 3 | 6 | 10 | 25 | 70 | 212 | 406 | ||||
| Diseases of the Respiratory system | 37 | J00-J99 | 2,133 | – | – | 1 | 1 | 4 | 4 | 7 | 76 | 247 | 615 | 1178 | ||
| Influenza | 38 | J10-J11 | 36 | – | – | – | – | – | – | – | 1 | 6 | 12 | 17 | ||
| Pneumonia | 39 | J12-J19 | 658 | – | – | 1 | – | 3 | 1 | 2 | 12 | 26 | 130 | 483 | ||
| Chronic Lower respiratory disease | 40 | J40-J47 | 806 | – | – | – | 1 | 1 | – | 4 | 44 | 145 | 279 | 332 | ||
| of which: Asthma | 41 | J45-J46 | 41 | – | – | – | 1 | 1 | – | – | 2 | 6 | 11 | 20 | ||
| Other diseases of the respiratory | 633 | – | – | – | – | – | 3 | 1 | 19 | 70 | 194 | 346 | ||||
| system | ||||||||||||||||
| Diseases of the Digestive system | 42 | K00-K93 | 506 | – | – | – | – | 2 | 15 | 32 | 67 | 76 | 136 | 178 | ||
| Ulcer of stomach, duodenum and | 25 | – | – | – | – | – | 1 | – | 3 | 2 | 7 | 12 | ||||
| jejunum | 43 | K25-K28 | 103 | – | – | – | – | 1 | 13 | 18 | 38 | 14 | 16 | 3 | ||
| Chronic liver disease | 44 | K70,K73-K74 | 378 | – | – | – | – | 1 | 1 | 14 | 26 | 60 | 113 | 163 | ||
| Other diseases of the digestive | ||||||||||||||||
| system | ||||||||||||||||
| Diseases of the skin and subcutaneous | ||||||||||||||||
| tissue | 45 | L00-L99 | 36 | – | – | – | – | – | – | – | – | 8 | 6 | 22 | ||
| Diseases of the musculoskeletal | ||||||||||||||||
| system/connective tissue | 46 | M00-M99 | 148 | – | – | – | – | 1 | – | 7 | 3 | 22 | 45 | 70 | ||
| Rheumatoid arthritis and | ||||||||||||||||
| osteoarthrosis | 47 | M05-M06,M15-M19 | 46 | – | – | – | – | – | – | – | 1 | 4 | 21 | 20 | ||
| Diseases of the genitourinary system | 48 | N00-N99 | 319 | – | – | – | – | 1 | 1 | 1 | 7 | 17 | 93 | 199 | ||
| Diseases of the kidney and ureter | 49 | N00-N29 | 211 | – | – | – | – | 1 | 1 | 1 | 6 | 14 | 68 | 120 | ||
| Complications of pregnancy, childbirth | ||||||||||||||||
| and puerperium | 50 | O00-O99 | 2 | – | – | – | – | 1 | 1 | – | – | – | – | – | ||
| Certain conditions originating in the | ||||||||||||||||
| perinatal period1 | 51 | P00-P96 | 37 | 37 | – | – | – | – | – | – | – | – | – | – | ||
| Congenital malformations and | ||||||||||||||||
| chromosomal abnomalities | 52 | Q00-Q99 | 84 | 35 | 3 | 6 | 6 | 2 | 3 | 9 | 8 | 6 | 5 | 1 | ||
| Congenital malformations of the:- | 15 | 6 | 2 | 1 | 3 | – | 1 | 2 | – | – | – | – | ||||
| Nervous system | 53 | Q00-Q07 | 17 | 6 | – | 4 | 1 | – | – | – | 1 | 2 | 2 | 1 | ||
| Circulatory system | 54 | Q20-Q28 | ||||||||||||||
| Symptoms, signs, abnormal | ||||||||||||||||
| findings, ill-defined causes | 55 | R00-R99 | 74 | 5 | 1 | – | 1 | 1 | – | 6 | 3 | 3 | 4 | 50 | ||
| Sudden infant death syndrome | 56 | R95 | 4 | 4 | – | – | – | – | – | – | – | – | – | – | ||
| Unknown and unspecified causes | 57 | R96-R99 | 16 | – | 1 | – | 1 | 1 | – | 6 | 2 | 2 | – | 3 | ||
| External causes of injury and poisoning | 58 | V01-Y89 | 385 | 1 | – | 2 | 24 | 37 | 46 | 47 | 37 | 40 | 55 | 96 | ||
| Accidents | 59 | V01-X59 | 286 | – | – | – | 4 | 21 | 32 | 27 | 26 | 29 | 54 | 93 | ||
| of which: Transport accidents | 60 | V01-V99 | 32 | – | – | – | 1 | 5 | 7 | 1 | 3 | 8 | 4 | 3 | ||
| Accidental falls | 61 | W00-W19 | 80 | – | – | – | – | – | 1 | 7 | 3 | 8 | 26 | 35 | ||
| Accidental poisoning | 62 | X40-X49 | 63 | – | – | – | 2 | 13 | 18 | 12 | 11 | 5 | 2 | – | ||
| other accidents | 111 | – | – | – | 1 | 3 | 6 | 7 | 9 | 8 | 22 | 55 | ||||
| Suicide and intentional self harm | 63 | X60-X84 | 80 | – | – | 2 | 18 | 13 | 13 | 19 | 8 | 6 | – | 1 | ||
| Homicide/assault | 64 | X85-Y09 | 3 | – | – | – | 1 | 1 | – | – | – | 1 | – | – | ||
| Events of undetermined intent | 65 | Y10-Y34 | 11 | 1 | – | – | 1 | 2 | 1 | 1 | 3 | 2 | – | – | ||
| All other external causes | 5 | – | – | – | – | – | – | – | – | 2 | 1 | 2 | ||||
| 1 Stillbirths not included. | ||||||||||||||||
| Table 15 Infant and neonatal mortality by area of residence of deceased, 2017 | |||||
| Infant mortality | Neonatal mortality | ||||
| Area of residence | Number | Rate | Number | Rate | |
| STATE | 174 | 2.8 | 138 | 2.2 | |
| LEINSTER | 96 | 2.7 | 75 | 2.1 | |
| Carlow | 4 | 5.2 | 2 | 2.6 | |
| Dublin City | 15 | 2.1 | 11 | 1.6 | |
| South Dublin | 19 | 4.8 | 16 | 4.0 | |
| Fingal | 7 | 1.5 | 7 | 1.5 | |
| Dun Laoghaire Rathdown | 6 | 2.3 | 6 | 2.3 | |
| Kildare | 9 | 2.8 | 6 | 1.9 | |
| Kilkenny | 1 | 0.8 | 1 | 0.8 | |
| Laois | 2 | 1.7 | 1 | 0.8 | |
| Longford | 3 | 5.4 | 1 | 1.8 | |
| Louth | 6 | 3.5 | 5 | 2.9 | |
| Meath | 5 | 1.8 | 3 | 1.1 | |
| Offaly | 2 | 2.0 | 1 | 1.0 | |
| Westmeath | 4 | 3.2 | 2 | 1.6 | |
| Wexford | 5 | 2.6 | 5 | 2.6 | |
| Wicklow | 8 | 4.2 | 8 | 4.2 | |
| MUNSTER | 42 | 2.6 | 33 | 2.1 | |
| Clare | 4 | 2.8 | 1 | 0.7 | |
| Cork City | 4 | 2.9 | 4 | 2.9 | |
| Cork County | 9 | 1.6 | 7 | 1.3 | |
| Kerry | 6 | 3.7 | 5 | 3.1 | |
| Limerick City | 2 | 2.6 | 2 | 2.6 | |
| Limerick County | 2 | 1.1 | 2 | 1.1 | |
| North Tipperary | 1 | 1.1 | 1 | 1.1 | |
| South Tipperary | 6 | 5.5 | 5 | 4.6 | |
| Waterford City | 3 | 5.3 | 2 | 3.5 | |
| Waterford County | 5 | 6.0 | 4 | 4.8 | |
| CONNACHT | 18 | 2.7 | 14 | 2.1 | |
| Galway City | 3 | 3.3 | 2 | 2.2 | |
| Galway County | 5 | 2.1 | 4 | 1.7 | |
| Leitrim | 0 | 0.0 | 0 | 0.0 | |
| Mayo | 5 | 3.2 | 4 | 2.6 | |
| Roscommon | 1 | 1.3 | 1 | 1.3 | |
| Sligo | 4 | 5.4 | 3 | 4.1 | |
| ULSTER (PART OF) | 18 | 4.8 | 16 | 4.3 | |
| Cavan | 3 | 2.8 | 3 | 2.8 | |
| Donegal | 10 | 5.4 | 9 | 4.8 | |
| Monaghan | 5 | 6.2 | 4 | 5.0 | |
| REGIONAL AUTHORITIES: | |||||
| Border | 28 | 4.2 | 24 | 3.6 | |
| Midland | 11 | 2.8 | 5 | 1.3 | |
| West | 14 | 2.5 | 11 | 1.9 | |
| Dublin | 47 | 2.6 | 40 | 2.2 | |
| Mid-East | 22 | 2.8 | 17 | 2.2 | |
| Mid-West | 9 | 1.8 | 6 | 1.2 | |
| South-East | 24 | 3.8 | 19 | 3.0 | |
| South-West | 19 | 2.2 | 16 | 1.9 | |
| Infant mortality rates: Deaths of infants under one year per 1,000 live births, classified by area of residence of mother. | |||||
| Neonatal mortality rates: Deaths of infants under 28 days per 1,000 live births, classified by area of residence of mother. | |||||
| Infant and neonatal mortality rates in some areas, based on small numbers are subject to considerable fluctuation and caution should be exercised in their interpretation. | |||||
| Table 16 Suicides classified by county of residence of deceased, 20121, 20162 and 20172 | |||||||||||||||
| 2017 | |||||||||||||||
| Number of suicides | Suicide rate3 all persons | Suicide rate3 males | Suicide rate3 females | ||||||||||||
| Area of residence | Total | Male | Female | 2017 | 2016 | 2012 | 2017 | 2016 | 2012 | 2017 | 2016 | 2012 | |||
| STATE | 392 | 312 | 80 | 8.2 | 8.4 | 11.8 | 13.2 | 13.6 | 19.6 | 3.3 | 3.4 | 4.1 | |||
| LEINSTER | 167 | 123 | 44 | 6.3 | 6.7 | 10.7 | 9.4 | 11.4 | 18.8 | 3.3 | 2.3 | 4.3 | |||
| Carlow | 5 | 2 | 3 | 8.7 | 19.5 | 9.1 | 7.0 | 28.4 | 18.1 | 10.4 | 10.6 | 0.0 | |||
| Dublin City | 19 | 9 | 10 | 3.5 | 5.8 | 11.9 | 3.4 | 8.8 | 18.5 | 3.6 | 2.9 | 5.7 | |||
| South Dublin | 11 | 7 | 4 | 4.9 | 3.1 | 5.6 | 6.5 | 5.0 | 9.2 | 3.5 | 1.4 | 2.2 | |||
| Fingal | 11 | 8 | 3 | 3.7 | 2.7 | 6.2 | 5.4 | 4.8 | 10.4 | 2.0 | 0.7 | 2.1 | |||
| Dun Laoghaire Rathdown | 6 | 4 | 2 | 2.1 | 0.5 | 7.8 | 2.9 | 1.0 | 9.2 | 1.4 | 0.0 | 6.5 | |||
| Kildare | 19 | 13 | 6 | 8.4 | 9.4 | 11.2 | 11.5 | 16.3 | 15.1 | 5.3 | 2.7 | 7.4 | |||
| Kilkenny | 10 | 9 | 1 | 10.0 | 10.2 | 12.5 | 18.0 | 12.2 | 22.9 | 2.0 | 8.2 | 2.1 | |||
| Laois | 12 | 10 | 2 | 13.9 | 11.9 | 12.2 | 23.0 | 21.3 | 21.8 | 4.7 | 2.4 | 2.4 | |||
| Longford | 4 | 3 | 1 | 9.6 | 12.2 | 7.5 | 14.3 | 19.4 | 15.0 | 4.8 | 4.9 | 0.0 | |||
| Louth | 11 | 9 | 2 | 8.4 | 9.3 | 17.0 | 13.9 | 17.2 | 30.9 | 3.0 | 1.5 | 3.2 | |||
| Meath | 12 | 10 | 2 | 6.0 | 7.1 | 9.5 | 10.1 | 11.2 | 14.9 | 2.0 | 3.0 | 4.2 | |||
| Offaly | 11 | 10 | 1 | 13.9 | 10.1 | 15.4 | 25.3 | 17.7 | 25.7 | 2.5 | 2.5 | 5.1 | |||
| Westmeath | 7 | 5 | 2 | 7.8 | 9.0 | 10.3 | 11.2 | 18.1 | 20.8 | 4.4 | 0.0 | 0.0 | |||
| Wexford | 16 | 15 | 1 | 10.6 | 12.0 | 22.5 | 20.1 | 21.5 | 35.8 | 1.3 | 2.6 | 9.5 | |||
| Wicklow | 13 | 9 | 4 | 9.0 | 7.7 | 7.2 | 12.6 | 15.6 | 11.7 | 5.4 | 0.0 | 2.8 | |||
| MUNSTER | 145 | 115 | 30 | 11.3 | 10.4 | 13.9 | 18.0 | 16.7 | 26.8 | 4.6 | 4.2 | 3.5 | |||
| Clare | 17 | 14 | 3 | 14.2 | 13.5 | 12.7 | 23.7 | 23.7 | 18.7 | 5.0 | 3.4 | 6.8 | |||
| Cork City | 22 | 19 | 3 | 18.0 | 14.5 | 23.1 | 31.4 | 20.9 | 38.3 | 4.8 | 8.4 | 8.4 | |||
| Cork County | 47 | 32 | 15 | 11.1 | 9.8 | 9.1 | 15.2 | 15.4 | 15.3 | 7.0 | 4.3 | 2.9 | |||
| Kerry | 15 | 13 | 2 | 10.3 | 14.9 | 22.2 | 17.9 | 24.4 | 44.3 | 2.7 | 5.4 | 0.0 | |||
| Limerick City | 3 | 3 | 0 | 5.2 | 8.8 | 26.5 | 10.5 | 10.8 | 43.1 | 0.0 | 6.9 | 10.5 | |||
| Limerick County | 8 | 7 | 1 | 5.8 | 5.9 | 14.1 | 10.1 | 8.7 | 23.4 | 1.5 | 2.9 | 4.5 | |||
| North Tipperary | 11 | 8 | 3 | 15.2 | 11.2 | 7.0 | 22.1 | 19.5 | 13.8 | 8.3 | 2.8 | 0.0 | |||
| South Tipperary | 11 | 9 | 2 | 12.3 | 7.9 | 14.6 | 20.1 | 11.3 | 26.9 | 4.5 | 4.5 | 2.2 | |||
| Waterford City | 3 | 3 | 0 | 6.3 | 6.3 | 8.6 | 12.7 | 12.8 | 17.6 | 0.0 | 0.0 | 0.0 | |||
| Waterford County | 8 | 7 | 1 | 11.6 | 8.7 | 10.3 | 20.3 | 17.4 | 20.7 | 2.9 | 0.0 | 0.0 | |||
| CONNACHT | 47 | 44 | 3 | 8.5 | 9.4 | 13.1 | 16.1 | 14.4 | 27.1 | 1.1 | 4.4 | 5.6 | |||
| Galway City | 10 | 8 | 2 | 13.4 | 8.4 | 4.2 | 22.1 | 8.7 | 5.9 | 5.2 | 8.2 | 2.7 | |||
| Galway County | 16 | 16 | 0 | 8.8 | 7.2 | 14.3 | 17.6 | 11.1 | 22.7 | 0.0 | 3.4 | 5.8 | |||
| Leitrim | 5 | 4 | 1 | 15.4 | 9.3 | 9.4 | 24.6 | 18.5 | 12.3 | 6.2 | 0.0 | 6.3 | |||
| Mayo | 6 | 6 | 0 | 4.6 | 11.4 | 19.2 | 9.2 | 18.2 | 33.9 | 0.0 | 4.5 | 4.6 | |||
| Roscommon | 2 | 2 | 0 | 3.1 | 10.8 | 10.9 | 6.1 | 18.3 | 15.5 | 0.0 | 3.1 | 6.3 | |||
| Sligo | 8 | 8 | 0 | 12.2 | 10.8 | 10.8 | 24.7 | 15.6 | 12.4 | 0.0 | 6.1 | 9.3 | |||
| ULSTER (PART OF) | 33 | 30 | 3 | 11.0 | 12.8 | 10.5 | 20.0 | 17.6 | 72.4 | 2.0 | 8.1 | 3.4 | |||
| Cavan | 9 | 7 | 2 | 11.7 | 16.2 | 9.5 | 18.1 | 21.5 | 18.8 | 5.3 | 10.8 | 0.0 | |||
| Donegal | 12 | 11 | 1 | 7.5 | 12.4 | 7.5 | 13.7 | 16.2 | 14.8 | 1.2 | 8.7 | 0.0 | |||
| Monaghan | 12 | 12 | 0 | 19.2 | 9.8 | 19.7 | 38.3 | 16.3 | 25.9 | 0.0 | 3.3 | 13.3 | |||
| REGIONAL AUTHORITIES: | |||||||||||||||
| Border | 57 | 51 | 6 | 10.8 | 11.5 | 12.0 | 19.4 | 17.3 | 20.1 | 2.3 | 5.7 | 3.9 | |||
| Midland | 34 | 28 | 6 | 11.4 | 10.6 | 11.8 | 18.8 | 19.1 | 21.6 | 4.0 | 2.0 | 2.1 | |||
| West | 34 | 32 | 2 | 7.5 | 9.2 | 13.7 | 14.2 | 13.9 | 22.4 | 0.9 | 4.5 | 5.0 | |||
| Dublin | 47 | 28 | 19 | 3.5 | 3.7 | 8.6 | 4.2 | 5.8 | 13.2 | 2.8 | 1.6 | 4.3 | |||
| Mid-East | 44 | 32 | 12 | 7.7 | 8.2 | 9.6 | 11.3 | 14.4 | 14.1 | 4.2 | 2.1 | 5.1 | |||
| Mid-West | 39 | 32 | 7 | 10.1 | 9.6 | 14.2 | 16.6 | 15.7 | 23.0 | 3.6 | 3.6 | 5.3 | |||
| South-East | 53 | 45 | 8 | 10.3 | 10.8 | 14.8 | 17.6 | 17.3 | 26.1 | 3.1 | 4.3 | 3.6 | |||
| South-West | 84 | 64 | 20 | 12.1 | 11.7 | 14.4 | 18.7 | 18.3 | 25.6 | 5.7 | 5.2 | 3.3 | |||
| Rates have been revised for intercensal years (2012-2015) | |||||||||||||||
| *Rates for 2016 have also been revised (See background notes) | |||||||||||||||
| 1 2012 deaths are by year of occurrence and are final figures. | |||||||||||||||
| 2 2016 and 2017 deaths are by year of registration and are subject to future revision. | |||||||||||||||
| 3 Deaths per year per 100,000 population. Rates are based on usual residence population concept. | |||||||||||||||
| Table 17 Divorce, Judicial Separation and Nullity applications received and granted by the courts in the year ending December 2015 | ||||||||||||
| Divorce applications | Judicial Separation applications | Nullity applications | Civil Partnership applications | |||||||||
| County | Received | Granted | Received | Granted | Received | Granted | Received | Granted | ||||
| Total | 4,314 | 3,289 | 1,419 | 827 | 35 | 14 | 78 | 22 | ||||
| Circuit Court | ||||||||||||
| Leinster | 2,528 | 1,976 | 785 | 523 | 13 | 7 | 51 | 14 | ||||
| Carlow | Carlow | 68 | 52 | 14 | 10 | – | – | – | – | |||
| Dublin | Dublin | 1,552 | 1,235 | 440 | 283 | 10 | 5 | 41 | 12 | |||
| Naas | Kildare | 141 | 115 | 103 | 130 | – | 2 | – | – | |||
| Kilkenny | Kilkenny | 78 | 50 | 31 | 8 | – | – | 2 | – | |||
| Portlaoise | Laois | 64 | 48 | 19 | 10 | – | – | 3 | 2 | |||
| Longford | Longford | 26 | 22 | 8 | 3 | – | – | 1 | – | |||
| Dundalk | Louth | 100 | 102 | 48 | 23 | – | – | 2 | – | |||
| Trim | Meath | 115 | 116 | 37 | 21 | – | – | – | – | |||
| Tullamore | Offaly | 63 | 40 | 21 | 9 | – | – | – | – | |||
| Mullingar | Westmeath | 77 | 66 | 25 | 7 | 1 | – | – | – | |||
| Wexford | Wexford | 143 | 76 | 24 | 8 | 1 | – | – | – | |||
| Wicklow | Wicklow | 101 | 54 | 15 | 11 | 1 | – | 2 | – | |||
| Munster | 1,128 | 902 | 372 | 202 | 12 | 6 | 20 | 6 | ||||
| Ennis | Clare | 104 | 71 | 34 | 23 | 1 | – | – | – | |||
| Cork | Cork | 481 | 376 | 166 | 87 | 7 | 1 | 2 | 2 | |||
| Tralee | Kerry | 111 | 92 | 37 | 28 | 1 | 2 | 11 | 4 | |||
| Limerick | Limerick | 172 | 156 | 57 | 33 | 2 | 1 | – | – | |||
| Clonmel | Tipperary | 142 | 118 | 46 | 24 | 1 | – | 7 | – | |||
| Waterford | Waterford | 118 | 89 | 32 | 7 | – | 2 | – | – | |||
| Connacht | 464 | 218 | 155 | 43 | 6 | 1 | 2 | 1 | ||||
| Galway | Galway | 261 | 33 | 98 | 3 | 5 | – | 2 | – | |||
| Carrick on Shannon | Leitrim | 18 | 28 | 6 | 3 | – | – | – | – | |||
| Castlebar | Mayo | 100 | 82 | 26 | 10 | 1 | – | – | 1 | |||
| Roscommon | Roscommon | 36 | 27 | 13 | 9 | – | – | – | – | |||
| Sligo | Sligo | 49 | 48 | 12 | 18 | – | 1 | – | – | |||
| Ulster | 170 | 168 | 72 | 21 | 2 | – | 2 | 1 | ||||
| Cavan | Cavan | 64 | 49 | 21 | 5 | – | – | 1 | – | |||
| Letterkenny | Donegal | 80 | 82 | 27 | 7 | 1 | – | 1 | 1 | |||
| Monaghan | Monaghan | 26 | 37 | 24 | 9 | 1 | – | – | – | |||
| Total Circuit Court | 4,290 | 3,264 | 1,384 | 789 | 33 | 14 | 75 | 22 | ||||
| 1High Court | 24 | 25 | 35 | 38 | 2 | – | 3 | – | ||||
| Supreme Court | – | – | – | – | – | – | – | – | ||||
| 1High Court figures are provisional | ||||||||||||
| Source: Courts Service | ||||||||||||
| 2015 is the latest available data | ||||||||||||
| Table A Estimated population classified by sex and age group, 2012 - 20171 | ||||||
| thousands | ||||||
| Persons in April of each year | ||||||
| Sex and Age Group | 20123 | 20133 | 20143 | 20153 | 20162 | 20173 |
| Total Persons | 4,593.7 | 4,614.7 | 4,645.4 | 4,687.8 | 4739.6 | 4792.5 |
| 0 - 4 years | 358.2 | 353.0 | 345.4 | 337.9 | 331.4 | 324.6 |
| 5 - 9 " | 325.3 | 333.0 | 342.1 | 349.3 | 355.3 | 359.1 |
| 10 - 14 " | 304.5 | 307.9 | 310.1 | 314.4 | 318.9 | 323.3 |
| 15 - 19 " | 281.5 | 284.4 | 290.6 | 296.1 | 301.2 | 308.5 |
| 20 - 24 " | 285.1 | 278.9 | 276.6 | 275.5 | 273.5 | 276.3 |
| 25 - 29 " | 341.5 | 321.8 | 305.9 | 298.7 | 296.7 | 292.4 |
| 30 - 34 " | 394.0 | 391.4 | 382.5 | 369.2 | 360.3 | 347.9 |
| 35 - 39 " | 365.2 | 366.8 | 371.6 | 379.8 | 388.1 | 394.6 |
| 40 - 44 " | 334.6 | 341.0 | 347.4 | 353.0 | 356.5 | 363.1 |
| 45 - 49 " | 307.7 | 310.1 | 312.6 | 317.0 | 324.9 | 333.1 |
| 50 - 54 " | 278.2 | 282.8 | 289.2 | 295.2 | 298.4 | 303.3 |
| 55 - 59 " | 248.0 | 251.1 | 255.7 | 260.6 | 268.2 | 274.0 |
| 60 - 64 " | 219.9 | 223.2 | 226.4 | 230.8 | 236.5 | 242.3 |
| 65 - 69 " | 181.6 | 190.0 | 197.2 | 203.6 | 208.0 | 211.3 |
| 70 - 74 " | 133.1 | 138.7 | 144.4 | 150.8 | 159.9 | 169.2 |
| 75 - 79 " | 103.9 | 106.4 | 109.1 | 112.2 | 114.2 | 116.8 |
| 80 - 84 " | 71.5 | 73.4 | 76.1 | 78.8 | 80.5 | 82.9 |
| 85 years and over | 59.8 | 60.7 | 62.7 | 64.9 | 67.3 | 69.7 |
| Total males | 2,275.0 | 2,286.1 | 2,299.0 | 2,317.7 | 2346.5 | 2372.1 |
| 0 - 4 years | 182.7 | 180.0 | 176.0 | 172.4 | 169.7 | 166.1 |
| 5 - 9 " | 166.4 | 170.7 | 175.1 | 178.5 | 181.4 | 183.1 |
| 10 - 14 " | 156.3 | 157.1 | 158.4 | 160.9 | 163.1 | 165.5 |
| 15 - 19 " | 144.3 | 145.9 | 149.1 | 152.0 | 154.4 | 157.6 |
| 20 - 24 " | 141.5 | 140.1 | 139.4 | 139.9 | 138.4 | 140.4 |
| 25 - 29 " | 163.4 | 154.7 | 147.2 | 143.7 | 145.2 | 144.3 |
| 30 - 34 " | 193.3 | 190.7 | 184.9 | 177.0 | 172.5 | 166.3 |
| 35 - 39 " | 182.3 | 182.7 | 183.8 | 186.9 | 190.6 | 192.7 |
| 40 - 44 " | 168.0 | 170.9 | 172.9 | 175.0 | 177.2 | 180.1 |
| 45 - 49 " | 153.0 | 154.4 | 156.1 | 158.4 | 162.5 | 166.2 |
| 50 - 54 " | 138.3 | 140.6 | 143.4 | 146.1 | 147.7 | 150.1 |
| 55 - 59 " | 123.8 | 125.1 | 127.2 | 129.3 | 133.1 | 135.9 |
| 60 - 64 " | 110.1 | 111.5 | 112.9 | 115.0 | 117.7 | 120.5 |
| 65 - 69 " | 90.6 | 94.9 | 98.5 | 101.2 | 103.4 | 104.8 |
| 70 - 74 " | 64.6 | 67.4 | 70.4 | 73.6 | 78.4 | 82.9 |
| 75 - 79 " | 47.8 | 49.2 | 50.7 | 52.4 | 53.5 | 55.1 |
| 80 - 84 " | 29.6 | 30.8 | 32.6 | 34.1 | 34.9 | 36.2 |
| 85 years and over | 19.0 | 19.3 | 20.3 | 21.4 | 23.0 | 24.3 |
| Total females | 2,318.7 | 2,328.5 | 2,346.4 | 2,370.1 | 2393.1 | 2420.4 |
| 0 - 4 years | 175.4 | 173.1 | 169.3 | 165.6 | 161.7 | 158.5 |
| 5 - 9 " | 159.0 | 162.3 | 167.0 | 170.8 | 173.9 | 176.0 |
| 10 - 14 " | 148.3 | 150.8 | 151.6 | 153.6 | 155.7 | 157.8 |
| 15 - 19 " | 137.2 | 138.5 | 141.4 | 144.1 | 146.9 | 151.0 |
| 20 - 24 " | 143.6 | 138.8 | 137.3 | 135.6 | 135.1 | 135.9 |
| 25 - 29 " | 178.1 | 167.1 | 158.7 | 155.0 | 151.5 | 148.2 |
| 30 - 34 " | 200.8 | 200.6 | 197.6 | 192.2 | 187.8 | 181.6 |
| 35 - 39 " | 182.9 | 184.2 | 187.8 | 192.9 | 197.5 | 201.9 |
| 40 - 44 " | 166.6 | 170.1 | 174.4 | 178.0 | 179.3 | 183.0 |
| 45 - 49 " | 154.7 | 155.7 | 156.5 | 158.6 | 162.4 | 166.9 |
| 50 - 54 " | 139.9 | 142.2 | 145.8 | 149.1 | 150.8 | 153.2 |
| 55 - 59 " | 124.2 | 126.0 | 128.5 | 131.3 | 135.1 | 138.2 |
| 60 - 64 " | 109.8 | 111.7 | 113.4 | 115.9 | 118.7 | 121.8 |
| 65 - 69 " | 91.0 | 95.1 | 98.7 | 102.3 | 104.5 | 106.4 |
| 70 - 74 " | 68.5 | 71.3 | 74.0 | 77.2 | 81.6 | 86.3 |
| 75 - 79 " | 56.1 | 57.2 | 58.4 | 59.7 | 60.7 | 61.7 |
| 80 - 84 " | 41.9 | 42.5 | 43.5 | 44.7 | 45.5 | 46.6 |
| 85 years and over | 40.8 | 41.4 | 42.4 | 43.5 | 44.4 | 45.3 |
| 2 Census of Population | ||||||
| 3 Preliminary | ||||||
| Population figures for years 2012 - 2016 have been updated based on revised Census of Population Usual Residence figures. | ||||||
| Table B - Deaths which were registered on the authority1 of the Superintendent Registrars in 2017, classified by principal groups of causes, sex and year of occurrence | ||||||||||||||
| Year of occurrence | ||||||||||||||
| Cause of Death | 2015 | 2014 | 2013 | 2012 | 2011 | 2010 | 2009 | 2008 | 2007 | 2006 | 2005 | 2004 & earlier | Total | |
| Total deaths | M | 327 | 53 | 14 | 9 | 7 | 7 | 3 | 5 | 2 | 1 | 3 | 54 | 485 |
| F | 183 | 29 | 13 | 11 | 5 | 9 | 1 | 6 | 6 | 5 | 5 | 61 | 334 | |
| Malignant Neoplasms | M | 18 | 6 | 2 | 1 | 2 | 1 | 1 | 1 | 0 | 0 | 1 | 7 | 40 |
| F | 17 | 5 | 2 | 4 | 0 | 2 | 0 | 0 | 2 | 0 | 1 | 9 | 42 | |
| Diseases of the Circulatory system | M | 45 | 13 | 2 | 3 | 0 | 0 | 0 | 2 | 2 | 0 | 0 | 18 | 85 |
| F | 26 | 11 | 2 | 2 | 0 | 5 | 0 | 4 | 3 | 3 | 2 | 20 | 78 | |
| Diseases of the Respiratory system | M | 12 | 7 | 0 | 1 | 0 | 2 | 1 | 0 | 0 | 0 | 0 | 6 | 29 |
| F | 13 | 5 | 1 | 1 | 1 | 0 | 0 | 0 | 0 | 0 | 0 | 8 | 29 | |
| External causes | M | 218 | 20 | 6 | 1 | 3 | 3 | 1 | 2 | 0 | 0 | 1 | 3 | 258 |
| F | 90 | 5 | 4 | 1 | 1 | 0 | 0 | 0 | 0 | 1 | 0 | 2 | 104 | |
| All other causes | M | 34 | 7 | 4 | 3 | 2 | 1 | 0 | 0 | 0 | 1 | 1 | 20 | 73 |
| F | 37 | 3 | 4 | 3 | 3 | 2 | 1 | 2 | 1 | 1 | 2 | 22 | 81 | |
| 1 See definition in background notes - "issue of authority of the Superintendent Registrars". | ||||||||||||||
This report has been prepared by the Central Statistics Office for the Minister for Social Protection in accordance with the provisions of Section 2 of the Vital Statistics and Births, Deaths and Marriages Registration Act, 1952 and Government Order SI 831 of 2007.
All figures in this report are classified by year of registration. The Yearly Summary publication is a summary of the 4 quarterly publications for the reference year.
The extension of the Limerick City boundary, which came into operation on 1st March 2008, has been taken into account in the compilation of the statistics from the Second Quarter of 2008. As a result, data for Limerick City and County are not directly comparable with any quarter prior to the Second Quarter 2008.
This publication continues with the 3 major changes in the methods by which mortality statistics are compiled. These changes were introduced in the Vital Statistics First Quarter 2007 publication.
1) Underlying Cause of Death is classified according to International Classification of Diseases, Version 10 (ICD10) instead of to International Classification of Diseases, Version 9 (ICD9). In addition, this and future publications will incorporate certain official updates to ICD-10. In particular, mental and behavioural disorders due to psychoactive substance use (F10-F19), with mention of intestinal infectious diseases (A00-A09), accidental, intentional self and undetermined intent poisoning by and exposure to noxious substances (X40-X49, X60-X69, Y10-Y19) or assault by chemical or noxious substance (X85-X90), are now coded to the latter. http://www.who.int/classifications/icd/OfficialWHOUpdatesCombined1996-2008VOLUME2.pdf
2) Deaths where there was not an inquest have been coded using the automated coding system developed by the U.S National Centre for Health Statistics (NCHS). Previously the Underlying Cause of Death was chosen manually for all deaths.
3) All deaths registered in the quarter/year have been included in the statistics, in some cases with a provisional cause of death. Previously the practice was not to include deaths in the annual summary statistics until the cause of death had been definitely established.
Because of these changes, caution should be taken in directly comparing these mortality statistics with those of previous quarters/years. Many countries have found that moving to ICD10 does affect certain specific categories of causes of death. In particular, a significant drop in the number of deaths attributed to pneumonia and bronchopneumonia has been observed in some countries after moving to ICD10. These deaths were instead assigned to other conditions included on the death certificate.
The effect of the third change above has been to increase the number of deaths in our statistics as compared with previous years. Statistics for deaths due to external causes are particularly affected by this change. The previous method meant that some deaths were included in a later quarter of the year from when they had been registered, because of the delay involved in establishing a definite cause of death.
Births and deaths (where no inquest has been held) which have not been registered within one year of their occurrence can be registered only on the authority of the Superintendent Registrars. The tables in the main body of this report exclude such births and deaths. The Appendix to the report contains an analysis of late death registrations in 2016 and of some deaths where an inquest has been held. The number of such deaths registered in 2016 was 758.
The regional classifications in this release are based on the NUTS (Nomenclature of Territorial Units) classification used by Eurostat. The NUTS3 regions correspond to the eight Regional Authorities established under the Local Government Act, 1991 (Regional Authorities) (Establishment) Order, 1993, which came into operation on 1 January 1994. The NUTS2 regions, which were proposed by Government and agreed by Eurostat in 1999, are groupings of the NUTS3 regions. The composition of the regions is set out below.
| Border | Cavan | Dublin | Dublin City | |
| Donegal | Dun Laoghaire-Rathdown | |||
| Leitrim | Fingal | |||
| Louth | South Dublin | |||
| Monaghan | ||||
| Sligo | Mid-East | Kildare | ||
| Meath | ||||
| Midland | Laois | Wicklow | ||
| Longford | ||||
| Offaly | Mid-West | Clare | ||
| Westmeath | Limerick City | |||
| Limerick County | ||||
| West | Galway City | North Tipperary | ||
| Galway County | ||||
| Mayo | South-East | Carlow | ||
| Roscommon | Kilkenny | |||
| South Tipperary | ||||
| Waterford City | ||||
| Waterford County | ||||
| Wexford | ||||
| South-West | Cork City | |||
| Cork County | ||||
| Kerry |
Austria, Belgium, Bulgaria, Croatia, Cyprus, Czech Republic, Denmark, Estonia, Finland, France, Germany, Greece, Hungary, Ireland, Italy, Latvia, Lithuania, Luxembourg, Malta, the Netherlands, Poland, Portugal, Romania, Slovakia, Slovenia, Spain, Sweden, United Kingdom.
The Marriage Act 2015 (No. 35/2015) effective from the 16th November 2015 (S.I. 504/2015) refers, allows parties of the same sex to marry.
The fourth quarter and yearly summary publications from 2014 onwards are available in separate electronic publications on the cso website. The quarterly publications (from Quarter 1, 2014) and the yearly summary publications (from 2014 onwards) are no longer available in hard copy.
Rates for Births, Deaths and Marriages in Yearly Summary 2017 have been revised for intercensal years 2012 to 2015 based on revised estimated usual residence population data. Rates for 2016 have also been revised based on updated usual residence Census of population figures.
For the purpose of this release the population concept of usual residence has been used, i.e. all persons usually resident and present in the State on census night, plus absent persons who are usually resident in Ireland, but are temporarily away from home and outside the State on Census night. All persons are classified according to the region of their usual residence.
 Hide Background Notes
Scan the QR code below to view this release online or go to
http://www.cso.ie/en/releasesandpublications/ep/p-vsys/vitalstatisticsyearlysummary2017/
 Hide Table 1a Marriages, Civil partnerships, Births, Deaths and natural increase by number 2007-2017