
| Quarter 4 2019 | Quarter 4 2018 | |
| Births | 14,135 | 14,510 |
| Deaths | 7,639 | 7,103 |
| Marriages | 4,596 | 4,905 |
| Natural increase | 6,496 | 7,407 |
There were 14,135 births in quarter 4 2019, 375 births or 2.6% less than the same period in 2018. This corresponds to a birth rate of 11.5 per 1,000 population, a decrease of 0.4 per thousand population from quarter 4 2018.
There were 7,639 deaths in quarter 4 2019, an increase of 7.5% (or 536 deaths) from quarter 4 2018. This equates to a death rate of 6.2 per 1,000 population, an increase of 0.4 points from quarter 4 2018.
There were 44 infant deaths registered in quarter 4 2019 giving an infant mortality rate of 3.1 per 1,000 live births.
The number of births less the number of deaths in quarter 4 2019 resulted in a natural increase of population of 6,496 persons.
Births
There were 7,214 male births and 6,921 female births in quarter 4 2019. The 14,135 births represent an annual birth rate of 11.5 per thousand population, a decrease of 0.4 in the rate recorded in quarter 4 2018. See tables 4 and 5.
Age of mothers
The average age of first time mothers was 31.4, up 0.2 years from the same period in the previous year. The average age of all mothers at maternity for births registered in quarter 4 2019 was 33.2 years, which is an increase of 0.2 years from the 33.0 years recorded in quarter 4 2018. The average age of first time mothers outside marriage/civil partnership was 29.3 while the average age of all mothers outside marriage/civil partnership was 30.7 years. In the same quarter in 2018, the average age of mothers having their first baby outside marriage/civil partnership was 28.9 years while the average age of all mothers was 30.4 years. See tables 9 and 10.
Births and marriage/civil partnerships
In quarter 4 2019 there were 8,883 (62.8%) births registered as within marriage/civil partnership.
There were 5,252 births registered as outside marriage/civil partnership accounting for 37.2% of all births in quarter 4 2019. The highest percentage of births outside marriage/civil partnership was in Limerick City at 60.8% and the lowest was in Dún Laoghaire-Rathdown with 21.8%. In the same quarter in 2018, there were 5,419 births registered as outside marriage/civil partnership accounting for 37.3% of all births. See table 8.
Location of births
The highest number of births registered was in Dublin City with 1,617 (11.4% of total live births in the country) followed by Cork County with 1,252 (8.9%) registered births. Leitrim had the lowest number with 102 (0.7%) registered births in quarter 4 2019. The same pattern was reflected in quarter 4 2018 when Dublin City accounted for 1,638 or 11.3% of births followed by Cork County with 1,340 (9.2%). Leitrim had the lowest number, 95 births (0.7%), registered in quarter 4 2018. See table 8.
Area of residence of mother
From January 2018 onwards where births take place within the State and the mother is residing outside the State, the area of residence of the mother is recorded as outside the State. Prior to quarter 1, 2018, cases where the mother was residing outside the State, the mother's area of residence was assigned to the location where the birth took place within the State.
There were 12 babies born to mothers who were resident outside the Republic of Ireland in quarter 4 2019. This accounts for 0.1% of total live births registered in the quarter. See tables 5, 8, 9 and 10.
Nationality of mothers
Of the 14,135 births in quarter 4 2019, there were 10,936 babies (77.4%) born to mothers of Irish nationality compared to 11,304 (77.9%) in quarter 4 2018. See table 11.
Birth order
A total of 5,650 births (40.0%) were to first time mothers in quarter 4 2019 while 4,858 (34.4%) were to second time mothers. These accounted for a total of 74.3% of births of stated parity in quarter 4 2019. See table 6 and figure 2.
| For long labels below use to display on multiple lines | Birth Order Q4 2019 (%) |
|---|---|
| 1st | 40 |
| 2nd | 34.4 |
| 3rd | 16.9 |
| 4th | 6 |
| 5th and over | 2.8 |
Deaths
There were 7,639 deaths registered in quarter 4 2019, of these 3,975 were male and 3,664 were female. The quarter 4 2019 total is 7.5% more than in the corresponding quarter of 2018 when 7,103 deaths were registered. See table 12.
Infant and neonatal mortality
There were 44 infant deaths registered in quarter 4 2019 giving an infant mortality rate of 3.1 deaths per 1,000 live births, an increase of 0.3 points on that recorded in quarter 4 of 2018. Neonatal deaths are deaths of infants at ages under 4 weeks. There were 34 neonatal deaths registered in quarter 4 2019, giving a neonatal mortality rate of 2.4 deaths per 1,000 live births, which was an increase of 0.3 from quarter 4 2018. See tables 3, 4 and figure 3.
| Under 1 yr rates | infant | neonatal |
|---|---|---|
| Q4 2016 | 3.3 | 2.4 |
| Q1 2017 | 2.4 | 1.9 |
| Q2 2017 | 3 | 2.4 |
| Q3 2017 | 3.1 | 2.6 |
| Q4 2017 | 2.7 | 1.9 |
| Q1 2018 | 3.5 | 2.8 |
| Q2 2018 | 3 | 2.2 |
| Q3 2018 | 2.9 | 2 |
| Q4 2018 | 2.8 | 2.1 |
| Q1 2019 | 3.3 | 2.6 |
| Q2 2019 | 3.3 | 2.4 |
| Q3 2019 | 3 | 2.3 |
| Q4 2019 | 3.1 | 2.4 |
Cause of death
Diseases of the circulatory system:
Diseases of the circulatory system accounted for 2,151 deaths, or an annual rate of 1.7 per 1,000 population. Of these, 996 were due to ischaemic heart disease and 376 to cerebrovascular disease. See tables 2a, 2b, 13, 14 and figure 4.
Malignant neoplasms (Cancer):
There were 2,351 deaths from malignant neoplasms. This is equivalent to an annual rate of 1.9 per 1,000 population.
Diseases of the respiratory system:
Deaths from chronic lower respiratory disease numbered 374, pneumonia accounted for 207 deaths and 229 deaths resulted from all other respiratory diseases.
Accidents, suicides and other:
There were 525 deaths due to accidents, suicides and other external causes. Accidents accounted for 64.6% (339) of these deaths while suicides accounted for 29.7% (156). Of these external cause deaths, 66.9% were male (351)
Dementia and Alzheimer's:
In Quarter 4 2019 there were 473 deaths due to dementia of which 294 (or 62.2%) were female. There were 126 deaths due to Alzheimer's of which 83 (or 65.9%) were female. See tables 18 and 19.
| For long labels below use to display on multiple lines | Principal causes of death Q3 2019 (%) |
|---|---|
| Respiratory | 10.6 |
| Circulatory | 28.2 |
| External | 6.9 |
| Remainder | 23.6 |
| Malignant Cancer | 30.8 |
Age at death
The leading cause of death in quarter 4 2019 varied widely by age-group. For those aged from 15 to 34 years, external causes of death including accidents, suicide and other ranked first (111 deaths). Among individuals aged 35-74, malignant neoplasm (cancer) was the leading cause (1,160), while for those aged 75 and older, it was diseases of the circulatory system (1,579 deaths). See table 14.
There were 6,144 deaths of persons aged 65 and over registered in quarter 4 2019. This represents an annual death rate of 35.3 per 1,000 population aged 65 and over and represents an increase of 1.5 when compared with the corresponding quarter of 2018. See tables 3, 4 and figure 5.
The average (mean) time-lag between the date of death and the registration of death was 63 days while the median (mid-point in data) was 18 days for quarter 4 2019.
Natural Increase
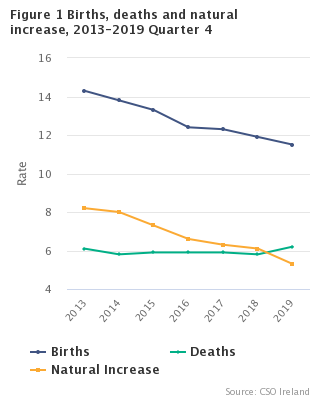
The natural increase in the population (births minus deaths) for quarter 4 2019 was 6,496. This represents a rate of 5.3 per 1,000 population, 0.8 less than quarter 4 2018. See tables 3, 4 and figure 1.
Marriages
The number of marriages registered during the quarter was 4,596 of which 157 were same-sex marriages. This is equivalent to an annual marriage rate of 3.7 per 1,000 population, a decrease of 0.3 from quarter 4 2018. See tables 3 and 4.
Same-sex marriage legislation came into effect on the 16th November 2015.
Population
The estimated population (usual residence) in April 2019 was 4,921,496.
| Code Generator for HighCharts V1.1 | Cancer | Disease of the circulatory system | Disease of the respiratory system | Accident, suicide, homicide and undetermined | Other |
|---|---|---|---|---|---|
| Under 15 | 4.47761194029851 | 1.49253731343284 | 1.49253731343284 | 11.9402985074627 | 80.5970149253731 |
| 15-34 | 14.4578313253012 | 5.42168674698795 | 0.602409638554217 | 66.8674698795181 | 12.6506024096386 |
| 35-74 | 44.1400304414003 | 21.3850837138508 | 7.07762557077625 | 11.7199391171994 | 15.6773211567732 |
| 75 and over | 24.3616575973211 | 33.0473001255756 | 13.0179991628296 | 2.05106739221432 | 27.5219757220594 |
| Table 1 Births classified by age of mother at maternity by quarter, 2014, 2018 and 2019 and their corresponding annual age specific (asfr) and total period fertility rates (tpfr) | |||||||||||||||
| Q4 2014 | Q4 2018 | Q3 2019 | Q4 2019 | ||||||||||||
| % of | Fertility | % of | Fertility | % of | Fertility | % of | Fertility | ||||||||
| Age of mother | Number | total | rate | Number | total | rate | Number | total | rate | Number | total | rate | |||
| < 20 years | 297 | 1.8 | 8.4 | 232 | 1.6 | 6.0 | 248 | 1.6 | 6.3 | 182 | 1.3 | 4.6 | |||
| 20-24 years | 1,417 | 8.8 | 41.3 | 1,223 | 8.4 | 34.5 | 1,291 | 8.4 | 35.2 | 1049 | 7.4 | 28.6 | |||
| 25-29 years | 3,143 | 19.6 | 79.2 | 2,348 | 16.2 | 64.4 | 2,619 | 17.0 | 72.8 | 2379 | 16.8 | 66.1 | |||
| 30-34 years | 5,927 | 36.9 | 120.0 | 5,008 | 34.5 | 114.6 | 5,237 | 34.1 | 122.5 | 4821 | 34.1 | 112.8 | |||
| 35-39 years | 4,328 | 26.9 | 92.2 | 4,586 | 31.6 | 89.4 | 4,777 | 31.1 | 93.2 | 4637 | 32.8 | 90.4 | |||
| 40-44 years | 896 | 5.6 | 20.6 | 1,044 | 7.2 | 22.4 | 1,124 | 7.3 | 23.4 | 990 | 7.0 | 20.6 | |||
| 45+ years | 55 | 0.3 | 1.4 | 69 | 0.5 | 1.6 | 83 | 0.5 | 1.9 | 77 | 0.5 | 1.7 | |||
| Not stated | 1.0 | – | – | – | – | – | – | – | – | – | – | – | |||
| Total | 16,064 | 100.0 | 1.8 | 14,510 | 100.0 | 1.7 | 15,379 | 100.0 | 1.8 | 14,135 | 100.0 | 1.6 | |||
| 1Fertility rates for Q4 2014 has been revised, based on revised Census of Population usual residence population data | |||||||||||||||
| Table 2a Deaths registered by cause of death and by quarter, 2014, 2018 and 2019 | |||||||||||||||||
| Malignant Cancers | % of total | Diseases of the heart and arteries | % of total | Lung diseases | % of total | Accidents, Suicides & Others | % of total | Other Causes | % of total | Total | % of total | ||||||
| Q4 2019 | 2,351 | 30.8 | 2,151 | 28.2 | 810 | 10.6 | 525 | 6.9 | 1,802 | 23.6 | 7,639 | 100.0 | |||||
| Q3 2019 | 2,368 | 32.2 | 2,196 | 29.8 | 813 | 11.0 | 279 | 3.8 | 1,702 | 23.1 | 7,358 | 100.0 | |||||
| Q4 2018 | 2,153 | 30.3 | 2,067 | 29.1 | 785 | 11.1 | 476 | 6.7 | 1,622 | 22.8 | 7,103 | 100.0 | |||||
| Q4 2014 | 2,114 | 31.1 | 2,015 | 29.7 | 742 | 10.9 | 462 | 6.8 | 1,454 | 21.4 | 6,787 | 100.0 | |||||
| Table 2b Deaths registered by cause of death and age group, Fourth Quarter 2019 | ||||||||||||
| Malignant Cancers | % of total | Diseases of the heart and arteries | % of total | Lung diseases | % of total | Accidents, Suicides & Others | % of total | Other Causes | % of total | Total | % of total | |
| Persons | ||||||||||||
| Under 1 | - | 0.0 | 1 | 0.0 | - | 0.0 | - | 0.0 | 43 | 2.4 | 44 | 0.6 |
| 1 - 4 | - | 0.0 | - | 0.0 | 1 | 0.1 | 4 | 0.8 | 5 | 0.3 | 10 | 0.1 |
| 5 - 14 | 3 | 0.1 | 0 | 0.0 | - | - | 4 | 0.8 | 6 | 0.3 | 13 | 0.2 |
| 15 - 24 | 5 | 0.2 | 2 | 0.1 | 0 | 0.0 | 38 | 7.2 | 6 | 0.3 | 51 | 0.7 |
| 25 - 34 | 19 | 0.8 | 7 | 0.3 | 1 | 0.1 | 73 | 13.9 | 15 | 0.8 | 115 | 1.5 |
| 35 - 44 | 48 | 2.0 | 27 | 1.3 | 5 | 0.6 | 90 | 17.1 | 35 | 1.9 | 205 | 2.7 |
| 45 - 54 | 128 | 5.4 | 68 | 3.2 | 11 | 1.4 | 93 | 17.7 | 55 | 3.1 | 355 | 4.6 |
| 55 - 64 | 336 | 14.3 | 157 | 7.3 | 27 | 3.3 | 76 | 14.5 | 106 | 5.9 | 702 | 9.2 |
| 65 - 74 | 648 | 27.6 | 310 | 14.4 | 143 | 17.7 | 49 | 9.3 | 216 | 12.0 | 1,366 | 17.9 |
| 75 - 84 | 712 | 30.3 | 615 | 28.6 | 259 | 32.0 | 47 | 9.0 | 510 | 28.3 | 2,143 | 28.1 |
| 85 + | 452 | 19.2 | 964 | 44.8 | 363 | 44.8 | 51 | 9.7 | 805 | 44.7 | 2,635 | 34.5 |
| Total | 2,351 | 100.0 | 2,151 | 100.0 | 810 | 100.0 | 525 | 100.0 | 1,802 | 100.0 | 7,639 | 100.0 |
| Males | ||||||||||||
| Under 1 | - | 0.0 | - | 0.0 | - | 0.0 | - | 0.0 | 22 | 1.2 | 22 | 0.3 |
| 1 - 4 | - | 0.0 | - | 0.0 | 1 | 0.1 | 1 | 0.2 | 4 | 0.2 | 6 | 0.1 |
| 5 - 14 | 2 | 0.1 | 0 | 0.0 | - | - | 4 | 0.8 | 4 | 0.2 | 10 | 0.1 |
| 15 - 24 | 2 | 0.1 | 1 | 0.0 | 0 | 0.0 | 33 | 6.3 | 2 | 0.1 | 38 | 0.5 |
| 25 - 34 | 11 | 0.5 | 7 | 0.3 | - | 0.0 | 52 | 9.9 | 11 | 0.6 | 81 | 1.1 |
| 35 - 44 | 13 | 0.6 | 24 | 1.1 | 0 | 0.0 | 63 | 12.0 | 18 | 1.0 | 118 | 1.5 |
| 45 - 54 | 67 | 2.8 | 51 | 2.4 | 6 | 0.7 | 69 | 13.1 | 35 | 1.9 | 228 | 3.0 |
| 55 - 64 | 188 | 8.0 | 125 | 5.8 | 15 | 1.9 | 52 | 9.9 | 67 | 3.7 | 447 | 5.9 |
| 65 - 74 | 373 | 15.9 | 197 | 9.2 | 85 | 10.5 | 33 | 6.3 | 119 | 6.6 | 807 | 10.6 |
| 75 - 84 | 409 | 17.4 | 341 | 15.9 | 132 | 16.3 | 18 | 3.4 | 268 | 14.9 | 1,168 | 15.3 |
| 85 + | 212 | 9.0 | 368 | 17.1 | 149 | 18.4 | 26 | 5.0 | 295 | 16.4 | 1,050 | 13.7 |
| Total | 1,277 | 54.3 | 1,114 | 51.8 | 388 | 47.9 | 351 | 66.9 | 845 | 46.9 | 3,975 | 52.0 |
| Females | ||||||||||||
| Under 1 | - | 0.0 | 1 | 0.0 | - | 0.0 | - | 0.0 | 21 | 1.2 | 22 | 0.3 |
| 1 - 4 | - | 0.0 | - | 0.0 | - | 0.0 | 3 | 0.6 | 1 | 0.1 | 4 | 0.1 |
| 5 - 14 | 1 | 0.0 | - | 0.0 | - | 0.0 | - | 0.0 | 2 | 0.1 | 3 | 0.0 |
| 15 - 24 | 3 | 0.1 | 1 | 0.0 | - | 0.0 | 5 | 1.0 | 4 | 0.2 | 13 | 0.2 |
| 25 - 34 | 8 | 0.3 | 0 | 0.0 | 1 | 0.1 | 21 | 4.0 | 4 | 0.2 | 34 | 0.4 |
| 35 - 44 | 35 | 1.5 | 3 | 0.1 | 5 | 0.6 | 27 | 5.1 | 17 | 0.9 | 87 | 1.1 |
| 45 - 54 | 61 | 2.6 | 17 | 0.8 | 5 | 0.6 | 24 | 4.6 | 20 | 1.1 | 127 | 1.7 |
| 55 - 64 | 148 | 6.3 | 32 | 1.5 | 12 | 1.5 | 24 | 4.6 | 39 | 2.2 | 255 | 3.3 |
| 65 - 74 | 275 | 11.7 | 113 | 5.3 | 58 | 7.2 | 16 | 3.0 | 97 | 5.4 | 559 | 7.3 |
| 75 - 84 | 303 | 12.9 | 274 | 12.7 | 127 | 15.7 | 29 | 5.5 | 242 | 13.4 | 975 | 12.8 |
| 85 + | 240 | 10.2 | 596 | 27.7 | 214 | 26.4 | 25 | 4.8 | 510 | 28.3 | 1,585 | 20.7 |
| Total | 1,074 | 45.7 | 1,037 | 48.2 | 422 | 52.1 | 174 | 33.1 | 957 | 53.1 | 3,664 | 48.0 |
| Table 3 Marriages, civil partnerships, births, deaths and natural increase | ||||||||||||||
| Marriages1 | Live Births | Deaths | ||||||||||||
| Total | Opposite-sex | Same-sex | Civil Partnerships | Total | First | Outside marriage/civil partnerships | Average Age | Total | Infant 2 | Neonatal 3 | 65 & over | Natural Increase | ||
| Quarter 1 | ||||||||||||||
| 2014 | 3,620 | 3,620 | – | 68 | 17,699 | 6,812 | 6,439 | 32.3 | 8,110 | 65 | 56 | 6,640 | 9,589 | |
| 2015 | 3,546 | 3,546 | – | 78 | 17,183 | 6,456 | 6,202 | 32.5 | 8,604 | 55 | 31 | 7,175 | 8,579 | |
| 2016 | 3,503 | 3,320 | 183 | 7 | 16,480 | 6,245 | 6,037 | 32.7 | 8,609 | 63 | 45 | 7,141 | 7,871 | |
| 2017 | 3,459 | 3,329 | 130 | – | 16,487 | 6,181 | 6,229 | 32.8 | 9,067 | 40 | 32 | 7,716 | 7,420 | |
| 2018 | 3,339 | 3,240 | 99 | – | 15,659 | 6,077 | 5,919 | 32.9 | 9,278 | 55 | 44 | 7,869 | 6,381 | |
| 2019 | 3,185 | 3,075 | 110 | – | 15,893 | 6,043 | 6,046 | 33.0 | 8,618 | 52 | 41 | 7,197 | 7,275 | |
| Quarter 2 | ||||||||||||||
| 2014 | 5,431 | 5,431 | – | 96 | 16,502 | 6,169 | 5,949 | 32.3 | 7,197 | 55 | 41 | 5,742 | 9,305 | |
| 2015 | 5,516 | 5,516 | – | 93 | 16,064 | 6,021 | 5,786 | 32.5 | 7,565 | 34 | 30 | 6,168 | 8,499 | |
| 2016 | 5,659 | 5,369 | 290 | – | 16,219 | 5,898 | 5,806 | 32.7 | 7,697 | 48 | 36 | 6,296 | 8,522 | |
| 2017 | 5,597 | 5,422 | 175 | – | 15,222 | 5,734 | 5,675 | 32.8 | 7,315 | 46 | 37 | 5,931 | 7,907 | |
| 2018 | 5,386 | 5,218 | 168 | – | 15,419 | 5,929 | 5,912 | 32.9 | 7,592 | 47 | 34 | 6,296 | 7,827 | |
| 2019 | 5,204 | 5,064 | 140 | – | 14,389 | 5,471 | 5,457 | 33.0 | 7,519 | 48 | 34 | 6,135 | 6,870 | |
| Quarter 3 | ||||||||||||||
| 2014 | 8,038 | 8,038 | – | 119 | 17,197 | 6,239 | 6,239 | 32.3 | 7,001 | 74 | 46 | 5,526 | 10,196 | |
| 2015 | 8,197 | 8,197 | – | 149 | 17,128 | 6,367 | 6,285 | 32.4 | 6,851 | 52 | 42 | 5,483 | 10,277 | |
| 2016 | 8,391 | 8,038 | 353 | – | 16,458 | 6,218 | 6,056 | 32.6 | 7,129 | 49 | 38 | 5,717 | 9,329 | |
| 2017 | 7,916 | 7,644 | 272 | – | 15,635 | 5,962 | 5,902 | 32.7 | 6,987 | 49 | 41 | 5,640 | 8,648 | |
| 2018 | 7,423 | 7,181 | 242 | – | 15,428 | 5,794 | 5,811 | 32.9 | 7,143 | 45 | 31 | 5,771 | 8,285 | |
| 2019 | 7,328 | 7,095 | 233 | – | 15,379 | 5,975 | 6,017 | 32.9 | 7,358 | 46 | 35 | 5,962 | 8,021 | |
| Quarter 4 | ||||||||||||||
| 2014 | 4,956 | 4,956 | – | 109 | 16,064 | 6,231 | 5,863 | 32.3 | 6,787 | 55 | 41 | 5,361 | 9,277 | |
| 2015 | 4,857 | 4,766 | 91 | 56 | 15,534 | 6,023 | 5,717 | 32.5 | 6,932 | 64 | 48 | 5,504 | 8,602 | |
| 2016 | 5,073 | 4,843 | 230 | – | 14,740 | 5,681 | 5,449 | 32.9 | 6,955 | 48 | 36 | 5,642 | 7,785 | |
| 2017 | 5,049 | 4,867 | 182 | – | 14,709 | 5,650 | 5,534 | 32.9 | 7,115 | 39 | 28 | 5,739 | 7,594 | |
| 2018 | 4,905 | 4,750 | 155 | – | 14,510 | 5,708 | 5,419 | 33.0 | 7,103 | 40 | 30 | 5,697 | 7,407 | |
| 2019 | 4,596 | 4,439 | 157 | – | 14,135 | 5,650 | 5,252 | 33.2 | 7,639 | 44 | 34 | 6,144 | 6,496 | |
| Total | ||||||||||||||
| 2014 | 22,045 | 22,045 | – | 392 | 67,462 | 25,635 | 24,389 | 32.3 | 29,095 | 249 | 184 | 23,269 | 38,367 | |
| 2015 | 22,116 | 22,025 | 91 | 376 | 65,909 | 24,867 | 23,990 | 32.5 | 29,952 | 205 | 151 | 24,330 | 35,957 | |
| 2016 | 22,626 | 21,570 | 1,056 | 7 | 63,897 | 24,042 | 23,348 | 32.7 | 30,390 | 208 | 155 | 24,796 | 33,507 | |
| 2017 | 22,021 | 21,262 | 759 | – | 62,053 | 23,527 | 23,340 | 32.8 | 30,484 | 174 | 138 | 25,026 | 31,569 | |
| 2018 | 21,053 | 20,389 | 664 | – | 61,016 | 23,508 | 23,061 | 32.9 | 31,116 | 187 | 139 | 25,633 | 29,900 | |
| 2019 | 20,313 | 19,673 | 640 | – | 59,796 | 23,139 | 22,772 | 33.0 | 31,134 | 190 | 144 | 25,438 | 28,662 | |
| 1 2014 to 2019 Marriage & Civil Partnership figures are final and by month of registration. | ||||||||||||||
| 2 Infant death: Death at ages under 1 year of live born infant. | ||||||||||||||
| 3 Neonatal death: Death at ages under 4 weeks of live born infant. | ||||||||||||||
| Table 4 Annual marriage, civil partnership, birth, death and natural increase rates per 1,000 population1 | |||||||||||||
| Marriages5 | Live Births | Deaths | |||||||||||
| Total | Opposite-sex | Same-sex | Civil Partnerships5 | Total | % First births 2 | % Outside marriage/civil partnerships | Total | Infant 3 Mortality | Neo-natal4 Mortality | 65 & over | Natural Increase | ||
| Quarter 1 | |||||||||||||
| 2014 | 3.1 | – | – | 0.06 | 15.3 | 38.6 | 36.4 | 7.0 | 3.7 | 3.2 | 46.7 | 8.3 | |
| 2015 | 3.1 | – | – | 0.07 | 14.8 | 37.6 | 36.1 | 7.4 | 3.2 | 1.8 | 48.7 | 7.4 | |
| 2016 | 3.0 | 2.8 | 0.2 | 0.01 | 14.1 | 37.9 | 36.6 | 7.3 | 3.8 | 2.7 | 46.8 | 6.7 | |
| 2017 | 2.9 | 2.8 | 0.1 | – | 13.9 | 37.5 | 37.8 | 7.7 | 2.4 | 1.9 | 49.0 | 6.3 | |
| 2018 | 2.7 | 2.7 | 0.1 | – | 13.1 | 38.8 | 37.8 | 7.7 | 3.5 | 2.8 | 48.4 | 5.3 | |
| 2019 | 2.6 | 2.5 | 0.1 | – | 13.1 | 38.0 | 38.0 | 7.1 | 3.3 | 2.6 | 42.8 | 6.0 | |
| Quarter 2 | |||||||||||||
| 2014 | 4.7 | – | – | 0.08 | 14.2 | 37.5 | 36.1 | 6.2 | 3.3 | 2.5 | 39.0 | 8.0 | |
| 2015 | 4.7 | – | – | 0.08 | 13.7 | 37.5 | 36.0 | 6.5 | 2.1 | 1.9 | 40.4 | 7.3 | |
| 2016 | 4.8 | 4.5 | 0.2 | – | 13.7 | 36.4 | 35.8 | 6.5 | 3.0 | 2.2 | 40.0 | 7.2 | |
| 2017 | 4.7 | 4.5 | 0.1 | – | 12.7 | 37.7 | 37.3 | 6.1 | 3.0 | 2.4 | 36.5 | 6.6 | |
| 2018 | 4.4 | 4.3 | 0.1 | – | 12.7 | 38.5 | 38.3 | 6.3 | 3.0 | 2.2 | 37.2 | 6.4 | |
| 2019 | 4.2 | 4.1 | 0.1 | – | 11.7 | 38.0 | 37.9 | 6.1 | 3.3 | 2.4 | 35.2 | 5.6 | |
| Quarter 3 | |||||||||||||
| 2014 | 6.9 | – | – | 0.10 | 14.8 | 37.5 | 36.8 | 6.0 | 4.3 | 2.7 | 37.5 | 8.8 | |
| 2015 | 7.0 | – | – | 0.13 | 14.6 | 37.3 | 36.7 | 5.8 | 3.0 | 2.5 | 35.9 | 8.8 | |
| 2016 | 7.1 | 6.8 | 0.3 | – | 13.9 | 37.8 | 36.8 | 6.0 | 3.0 | 2.3 | 36.3 | 7.9 | |
| 2017 | 6.6 | 6.4 | 0.2 | – | 13.0 | 38.1 | 37.7 | 5.8 | 3.1 | 2.6 | 34.7 | 7.2 | |
| 2018 | 6.1 | 5.9 | 0.2 | – | 12.7 | 37.6 | 37.7 | 5.9 | 2.9 | 2.0 | 34.3 | 6.8 | |
| 2019 | 6.0 | 5.8 | 0.2 | – | 12.5 | 38.9 | 39.1 | 6.0 | 3.0 | 2.3 | 34.3 | 6.5 | |
| Quarter 4 | |||||||||||||
| 2014 | 4.3 | – | – | 0.09 | 13.8 | 38.9 | 36.5 | 5.8 | 3.4 | 2.6 | 36.4 | 8.0 | |
| 2015 | 4.1 | 4.1 | 0.1 | 0.05 | 13.3 | 38.8 | 36.8 | 5.9 | 4.1 | 3.1 | 36.1 | 7.3 | |
| 2016 | 4.3 | 4.1 | 0.2 | – | 12.4 | 38.5 | 37.0 | 5.9 | 3.3 | 2.4 | 35.8 | 6.6 | |
| 2017 | 4.2 | 4.1 | 0.2 | – | 12.3 | 38.4 | 37.6 | 5.9 | 2.7 | 1.9 | 35.3 | 6.3 | |
| 2018 | 4.0 | 3.9 | 0.1 | – | 11.9 | 39.3 | 37.3 | 5.8 | 2.8 | 2.1 | 33.8 | 6.1 | |
| 2019 | 3.7 | 3.6 | 0.1 | – | 11.5 | 40.0 | 37.2 | 6.2 | 3.1 | 2.4 | 35.3 | 5.3 | |
| Total | |||||||||||||
| 2014 | 4.7 | – | – | 0.08 | 14.5 | 38.1 | 36.3 | 6.3 | 3.7 | 2.7 | 39.5 | 8.3 | |
| 2015 | 4.7 | 4.7 | – | 0.08 | 14.1 | 37.8 | 36.4 | 6.4 | 3.1 | 2.3 | 39.9 | 7.7 | |
| 2016 | 4.8 | 4.6 | 0.2 | – | 13.5 | 37.6 | 36.5 | 6.4 | 3.3 | 2.4 | 39.4 | 7.1 | |
| 2017 | 4.6 | 4.4 | 0.2 | – | 12.9 | 37.9 | 37.6 | 6.4 | 2.8 | 2.2 | 38.5 | 6.6 | |
| 2018 | 4.3 | 4.2 | 0.1 | – | 12.6 | 38.5 | 37.8 | 6.4 | 3.1 | 2.3 | 38.1 | 6.2 | |
| 2019 | 4.1 | 4.0 | 0.1 | – | 12.1 | 38.7 | 38.1 | 6.3 | 3.1 | 2.4 | 36.5 | 5.8 | |
| 1 Rates are calculated using the Usual Residence population figures. | |||||||||||||
| 2 First births divided by the total number of live births (excluding those with unstated parity), multiplied by 100. | |||||||||||||
| 3 Infant mortality is the number of infant deaths per 1,000 live births. | |||||||||||||
| 4 Neonatal mortality is the number of neonatal (infants aged under 4 weeks) deaths per 1,000 live births. | |||||||||||||
| 5 2014 to 2019 Marriage & Civil Partnership rates are by month of registration and are final. | |||||||||||||
| Table 5 Births registered, classified by area of residence of mother, October - December 2019 | ||||
| Area of residence | Total | Male | Female | Rate1 |
| State | 14,135 | 7,214 | 6,921 | 11.5 |
| Leinster | 8,172 | 4,124 | 4,048 | 11.9 |
| Carlow | 167 | 79 | 88 | 11.4 |
| Dublin City | 1,617 | 814 | 803 | 11.5 |
| South Dublin | 962 | 472 | 490 | 13.5 |
| Fingal | 1,011 | 526 | 485 | 13.0 |
| Dún Laoghaire-Rathdown | 611 | 309 | 302 | 10.3 |
| Kildare | 759 | 390 | 369 | 13.0 |
| Kilkenny | 268 | 132 | 136 | 10.5 |
| Laois | 281 | 130 | 151 | 12.7 |
| Longford | 133 | 78 | 55 | 12.5 |
| Louth | 386 | 208 | 178 | 11.5 |
| Meath | 628 | 322 | 306 | 12.2 |
| Offaly | 213 | 100 | 113 | 10.4 |
| Westmeath | 262 | 132 | 130 | 11.4 |
| Wexford | 448 | 219 | 229 | 11.6 |
| Wicklow | 426 | 213 | 213 | 11.4 |
| Munster | 3,529 | 1,828 | 1,701 | 10.8 |
| Clare | 316 | 161 | 155 | 10.4 |
| Cork City | 268 | 135 | 133 | 8.6 |
| Cork County | 1,252 | 647 | 605 | 11.6 |
| Kerry | 369 | 185 | 184 | 9.8 |
| Limerick City | 176 | 90 | 86 | 12.1 |
| Limerick County | 402 | 219 | 183 | 11.5 |
| Tipperary | 441 | 229 | 212 | 10.7 |
| Waterford City | 138 | 74 | 64 | 11.3 |
| Waterford County | 167 | 88 | 79 | 9.4 |
| Connacht | 1,640 | 853 | 787 | 11.6 |
| Galway City | 216 | 113 | 103 | 11.4 |
| Galway County | 550 | 265 | 285 | 11.8 |
| Leitrim | 102 | 56 | 46 | 12.3 |
| Mayo | 407 | 231 | 176 | 12.1 |
| Roscommon | 188 | 100 | 88 | 11.2 |
| Sligo | 177 | 88 | 89 | 10.6 |
| Ulster (Part of) | 782 | 401 | 381 | 10.2 |
| Cavan | 211 | 99 | 112 | 10.8 |
| Donegal | 406 | 216 | 190 | 9.9 |
| Monaghan | 165 | 86 | 79 | 10.4 |
| Regional Authorities: | ||||
| Border | 1,061 | 545 | 516 | 10.4 |
| Midland | 889 | 440 | 449 | 11.7 |
| West | 1,361 | 709 | 652 | 11.7 |
| Dublin | 4,201 | 2,121 | 2,080 | 12.0 |
| Mid-East | 2,199 | 1,133 | 1,066 | 12.2 |
| Mid-West | 1,335 | 699 | 636 | 11.0 |
| South-East | 1,188 | 592 | 596 | 10.9 |
| South-West | 1,889 | 967 | 922 | 10.7 |
| Mother Residing Outside the State | 12 | 8 | 4 | – |
| 1 Births per year per 1,000 population. Annual rates based on estimated usual residence 2019 population. | ||||
| Table 6 Births registered, classified by age of mother and previous number of liveborn children, October - December 2019 | |||||||
| Previous number of liveborn children | |||||||
| Age of mother at maternity | Total | 0 | 1 | 2 | 3 | 4 | 5 or more |
| All ages | 14,135 | 5,650 | 4,858 | 2,388 | 842 | 229 | 168 |
| 15 and under | 5 | 5 | – | – | – | – | – |
| 16 | 7 | 7 | – | – | – | – | – |
| 17 | 14 | 14 | – | – | – | – | – |
| 18 | 54 | 51 | 3 | – | – | – | – |
| 19 | 102 | 84 | 13 | 4 | 1 | – | – |
| Under 20 | 182 | 161 | 16 | 4 | 1 | – | – |
| 20 | 146 | 109 | 32 | 5 | – | – | – |
| 21 | 174 | 130 | 36 | 5 | 3 | – | – |
| 22 | 207 | 135 | 46 | 20 | 5 | 1 | – |
| 23 | 237 | 149 | 70 | 13 | 4 | – | 1 |
| 24 | 285 | 159 | 86 | 30 | 9 | 1 | – |
| 20-24 | 1,049 | 682 | 270 | 73 | 21 | 2 | 1 |
| 25 | 332 | 161 | 113 | 45 | 11 | 2 | – |
| 26 | 413 | 225 | 128 | 35 | 19 | 6 | – |
| 27 | 451 | 234 | 144 | 44 | 16 | 8 | 5 |
| 28 | 579 | 269 | 205 | 67 | 27 | 6 | 5 |
| 29 | 604 | 296 | 196 | 66 | 36 | 6 | 4 |
| 25-29 | 2,379 | 1,185 | 786 | 257 | 109 | 28 | 14 |
| 30 | 695 | 358 | 206 | 82 | 34 | 10 | 5 |
| 31 | 869 | 424 | 271 | 118 | 29 | 14 | 13 |
| 32 | 1,040 | 490 | 330 | 140 | 52 | 15 | 13 |
| 33 | 1,124 | 424 | 457 | 163 | 59 | 13 | 8 |
| 34 | 1,093 | 416 | 387 | 197 | 57 | 27 | 9 |
| 30-34 | 4,821 | 2,112 | 1,651 | 700 | 231 | 79 | 48 |
| 35 | 1,109 | 362 | 446 | 215 | 67 | 11 | 8 |
| 36 | 1,130 | 326 | 447 | 249 | 74 | 17 | 17 |
| 37 | 967 | 217 | 376 | 244 | 94 | 22 | 14 |
| 38 | 788 | 174 | 287 | 225 | 69 | 21 | 12 |
| 39 | 643 | 143 | 236 | 162 | 72 | 13 | 17 |
| 35-39 | 4,637 | 1,222 | 1,792 | 1,095 | 376 | 84 | 68 |
| 40 | 409 | 105 | 135 | 109 | 36 | 16 | 8 |
| 41 | 253 | 70 | 84 | 58 | 23 | 9 | 9 |
| 42 | 178 | 40 | 54 | 50 | 19 | 4 | 11 |
| 43 | 99 | 28 | 28 | 29 | 9 | 1 | 4 |
| 44 | 51 | 16 | 16 | 6 | 10 | 2 | 1 |
| 40-44 | 990 | 259 | 317 | 252 | 97 | 32 | 33 |
| 45 and over | 77 | 29 | 26 | 7 | 7 | 4 | 4 |
| Table 7 Number and percentage of births registered within and outside marriage/civil partnership, classified by age of mother, October - December 2019 | |||||||
| Number | Percentage of total births | ||||||
| Age of mother at maternity | Total | Married/Civil partnership parents | Unmarried/non-Civil partnership parents | Married/Civil partnership parents | Unmarried/non-Civil partnership parents | ||
| Total | Same address | Total | Same address | ||||
| All ages | 14,135 | 8,883 | 5,252 | 3,197 | 62.8 | 37.2 | 22.6 |
| 15 and under | 5 | – | 5 | 1 | – | 100.0 | 20 |
| 16 | 7 | 1 | 6 | – | 14.3 | 85.7 | – |
| 17 | 14 | 3 | 11 | 2 | 21.4 | 78.6 | 14.3 |
| 18 | 54 | 7 | 47 | 9 | 13.0 | 87.0 | 16.7 |
| 19 | 102 | 24 | 78 | 30 | 23.5 | 76.5 | 29.4 |
| Under 20 | 182 | 35 | 147 | 42 | 19.2 | 80.8 | 23.1 |
| 20 | 146 | 18 | 128 | 47 | 12.3 | 87.7 | 32.2 |
| 21 | 174 | 22 | 152 | 53 | 12.6 | 87.4 | 30.5 |
| 22 | 207 | 32 | 175 | 67 | 15.5 | 84.5 | 32.4 |
| 23 | 237 | 51 | 186 | 69 | 21.5 | 78.5 | 29.1 |
| 24 | 285 | 72 | 213 | 92 | 25.3 | 74.7 | 32.3 |
| 20-24 | 1,049 | 195 | 854 | 328 | 18.6 | 81.4 | 31.3 |
| 25 | 332 | 93 | 239 | 113 | 28.0 | 72.0 | 34.0 |
| 26 | 413 | 110 | 303 | 167 | 26.6 | 73.4 | 40.4 |
| 27 | 451 | 155 | 296 | 194 | 34.4 | 65.6 | 43.0 |
| 28 | 579 | 254 | 325 | 198 | 43.9 | 56.1 | 34.2 |
| 29 | 604 | 312 | 292 | 178 | 51.7 | 48.3 | 29.5 |
| 25-29 | 2,379 | 924 | 1,455 | 850 | 38.8 | 61.2 | 35.7 |
| 30 | 695 | 399 | 296 | 176 | 57.4 | 42.6 | 25.3 |
| 31 | 869 | 584 | 285 | 198 | 67.2 | 32.8 | 22.8 |
| 32 | 1,040 | 725 | 315 | 220 | 69.7 | 30.3 | 21.2 |
| 33 | 1,124 | 831 | 293 | 204 | 73.9 | 26.1 | 18.1 |
| 34 | 1,093 | 837 | 256 | 193 | 76.6 | 23.4 | 17.7 |
| 30-34 | 4,821 | 3,376 | 1,445 | 991 | 70.0 | 30.0 | 20.6 |
| 35 | 1,109 | 847 | 262 | 189 | 76.4 | 23.6 | 17.0 |
| 36 | 1,130 | 899 | 231 | 180 | 79.6 | 20.4 | 15.9 |
| 37 | 967 | 748 | 219 | 158 | 77.4 | 22.6 | 16.3 |
| 38 | 788 | 610 | 178 | 134 | 77.4 | 22.6 | 17.0 |
| 39 | 643 | 471 | 172 | 120 | 73.3 | 26.7 | 18.7 |
| 35-39 | 4,637 | 3,575 | 1,062 | 781 | 77.1 | 22.9 | 16.8 |
| 40 | 409 | 307 | 102 | 71 | 75.1 | 24.9 | 17.4 |
| 41 | 253 | 184 | 69 | 53 | 72.7 | 27.3 | 20.9 |
| 42 | 178 | 129 | 49 | 34 | 72.5 | 27.5 | 19.1 |
| 43 | 99 | 71 | 28 | 19 | 71.7 | 28.3 | 19.2 |
| 44 | 51 | 36 | 15 | 13 | 70.6 | 29.4 | 25.5 |
| 40-44 | 990 | 727 | 263 | 190 | 73.4 | 26.6 | 19.2 |
| 45 and over | 77 | 51 | 26 | 15 | 66.2 | 33.8 | 19.5 |
| Table 8 Number and percentage of births registered within and outside marriage/civil partnership, classified by area of residence of mother, October - December 2019 | |||||||
| Number | Percentage of total births | ||||||
| Area of residence | Total | Married/Civil partnership parents | Unmarried/non-Civil partnership parents | Married/Civil partnership parents | Unmarried/non-Civil partnership parents | ||
| Total | Same address | Total | Same address | ||||
| State | 14,135 | 8,883 | 5,252 | 3,197 | 62.8 | 37.2 | 22.6 |
| Leinster | 8,172 | 5,076 | 3,096 | 1,841 | 62.1 | 37.9 | 22.5 |
| Carlow | 167 | 84 | 83 | 49 | 50.3 | 49.7 | 29.3 |
| Dublin City | 1,617 | 917 | 700 | 360 | 56.7 | 43.3 | 22.3 |
| South Dublin | 962 | 583 | 379 | 206 | 60.6 | 39.4 | 21.4 |
| Fingal | 1,011 | 689 | 322 | 208 | 68.2 | 31.8 | 20.6 |
| Dún Laoghaire-Rathdown | 611 | 478 | 133 | 80 | 78.2 | 21.8 | 13.1 |
| Kildare | 759 | 509 | 250 | 149 | 67.1 | 32.9 | 19.6 |
| Kilkenny | 268 | 170 | 98 | 67 | 63.4 | 36.6 | 25.0 |
| Laois | 281 | 152 | 129 | 73 | 54.1 | 45.9 | 26.0 |
| Longford | 133 | 74 | 59 | 34 | 55.6 | 44.4 | 25.6 |
| Louth | 386 | 214 | 172 | 106 | 55.4 | 44.6 | 27.5 |
| Meath | 628 | 403 | 225 | 160 | 64.2 | 35.8 | 25.5 |
| Offaly | 213 | 123 | 90 | 58 | 57.7 | 42.3 | 27.2 |
| Westmeath | 262 | 174 | 88 | 62 | 66.4 | 33.6 | 23.7 |
| Wexford | 448 | 245 | 203 | 128 | 54.7 | 45.3 | 28.6 |
| Wicklow | 426 | 261 | 165 | 101 | 61.3 | 38.7 | 23.7 |
| Munster | 3,529 | 2,190 | 1,339 | 841 | 62.1 | 37.9 | 23.8 |
| Clare | 316 | 191 | 125 | 85 | 60.4 | 39.6 | 26.9 |
| Cork City | 268 | 127 | 141 | 72 | 47.4 | 52.6 | 26.9 |
| Cork County | 1,252 | 872 | 380 | 272 | 69.6 | 30.4 | 21.7 |
| Kerry | 369 | 243 | 126 | 91 | 65.9 | 34.1 | 24.7 |
| Limerick City | 176 | 69 | 107 | 48 | 39.2 | 60.8 | 27.3 |
| Limerick County | 402 | 271 | 131 | 93 | 67.4 | 32.6 | 23.1 |
| Tipperary | 441 | 255 | 186 | 94 | 57.8 | 42.2 | 21.3 |
| Waterford City | 138 | 68 | 70 | 38 | 49.3 | 50.7 | 27.5 |
| Waterford County | 167 | 94 | 73 | 48 | 56.3 | 43.7 | 28.7 |
| Connacht | 1,640 | 1,117 | 523 | 350 | 68.1 | 31.9 | 21.3 |
| Galway City | 216 | 143 | 73 | 50 | 66.2 | 33.8 | 23.1 |
| Galway County | 550 | 397 | 153 | 107 | 72.2 | 27.8 | 19.5 |
| Leitrim | 102 | 69 | 33 | 22 | 67.6 | 32.4 | 21.6 |
| Mayo | 407 | 261 | 146 | 94 | 64.1 | 35.9 | 23.1 |
| Roscommon | 188 | 124 | 64 | 45 | 66.0 | 34.0 | 23.9 |
| Sligo | 177 | 123 | 54 | 32 | 69.5 | 30.5 | 18.1 |
| Ulster (Part of) | 782 | 493 | 289 | 163 | 63.0 | 37.0 | 20.8 |
| Cavan | 211 | 138 | 73 | 49 | 65.4 | 34.6 | 23.2 |
| Donegal | 406 | 249 | 157 | 81 | 61.3 | 38.7 | 20.0 |
| Monaghan | 165 | 106 | 59 | 33 | 64.2 | 35.8 | 20.0 |
| Regional Authorities: | |||||||
| Border | 1,061 | 685 | 376 | 217 | 64.6 | 35.4 | 20.5 |
| Midland | 889 | 523 | 366 | 227 | 58.8 | 41.2 | 25.5 |
| West | 1,361 | 925 | 436 | 296 | 68.0 | 32.0 | 21.7 |
| Dublin | 4,201 | 2,667 | 1,534 | 854 | 63.5 | 36.5 | 20.3 |
| Mid-East | 2,199 | 1,387 | 812 | 516 | 63.1 | 36.9 | 23.5 |
| Mid-West | 1,335 | 786 | 549 | 320 | 58.9 | 41.1 | 24.0 |
| South-East | 1,188 | 661 | 527 | 330 | 55.6 | 44.4 | 27.8 |
| South-West | 1,889 | 1,242 | 647 | 435 | 65.7 | 34.3 | 23.0 |
| Mother Residing Outside the State | 12 | 7 | 5 | 2.0 | 58.3 | 41.7 | 16.7 |
| Table 9 Births registered, classified by area of residence and age of mother, October - December 2019 | |||||||||
| Average age of mother at maternity | |||||||||
| Area of residence | Total | Under 20 | 20-24 | 25-29 | 30-34 | 35-39 | 40 and over | All births | First births |
| State | 14,135 | 182 | 1,049 | 2,379 | 4,821 | 4,637 | 1,067 | 33.2 | 31.4 |
| Leinster | 8,172 | 107 | 637 | 1,425 | 2,754 | 2,630 | 619 | 33.1 | 31.3 |
| Carlow | 167 | 4 | 12 | 38 | 58 | 41 | 14 | 32.4 | 30.8 |
| Dublin City | 1,617 | 33 | 157 | 285 | 515 | 508 | 119 | 32.7 | 31.3 |
| South Dublin | 962 | 14 | 86 | 184 | 345 | 266 | 67 | 32.6 | 30.6 |
| Fingal | 1,011 | 7 | 75 | 178 | 352 | 311 | 88 | 33.3 | 31.4 |
| Dún Laoghaire-Rathdown | 611 | – | 13 | 61 | 210 | 264 | 63 | 35.0 | 33.6 |
| Kildare | 759 | 4 | 46 | 118 | 254 | 278 | 59 | 33.6 | 31.8 |
| Kilkenny | 268 | – | 11 | 45 | 91 | 102 | 19 | 33.7 | 31.7 |
| Laois | 281 | 6 | 34 | 55 | 88 | 85 | 13 | 31.9 | 29.8 |
| Longford | 133 | 4 | 19 | 22 | 44 | 34 | 10 | 31.9 | 29.7 |
| Louth | 386 | 15 | 34 | 72 | 133 | 109 | 23 | 32.2 | 30.5 |
| Meath | 628 | 5 | 37 | 109 | 220 | 204 | 53 | 33.4 | 31.7 |
| Offaly | 213 | 3 | 24 | 44 | 77 | 58 | 7 | 31.9 | 29.7 |
| Westmeath | 262 | 4 | 17 | 58 | 74 | 86 | 23 | 33.1 | 31.6 |
| Wexford | 448 | 7 | 45 | 92 | 151 | 132 | 21 | 32.1 | 30.1 |
| Wicklow | 426 | 1 | 27 | 64 | 142 | 152 | 40 | 33.9 | 32.1 |
| Munster | 3,529 | 46 | 242 | 565 | 1,181 | 1,231 | 264 | 33.3 | 31.6 |
| Clare | 316 | 3 | 17 | 52 | 115 | 112 | 17 | 33.4 | 31.7 |
| Cork City | 268 | 5 | 26 | 51 | 85 | 81 | 20 | 32.5 | 31.0 |
| Cork County | 1,252 | 11 | 67 | 163 | 438 | 482 | 91 | 33.9 | 32.2 |
| Kerry | 369 | 4 | 25 | 48 | 115 | 137 | 40 | 33.9 | 32.5 |
| Limerick City | 176 | 5 | 21 | 50 | 46 | 45 | 9 | 31.1 | 29.9 |
| Limerick County | 402 | 3 | 21 | 68 | 142 | 137 | 31 | 33.6 | 32.0 |
| Tipperary | 441 | 7 | 38 | 74 | 143 | 148 | 31 | 33.0 | 31.0 |
| Waterford City | 138 | 6 | 12 | 28 | 45 | 40 | 7 | 32.0 | 30.1 |
| Waterford County | 167 | 2 | 15 | 31 | 52 | 49 | 18 | 33.1 | 30.5 |
| Connacht | 1,640 | 21 | 98 | 259 | 584 | 552 | 126 | 33.4 | 31.9 |
| Galway City | 216 | 6 | 14 | 30 | 75 | 71 | 20 | 33.2 | 32.1 |
| Galway County | 550 | 7 | 35 | 78 | 180 | 198 | 52 | 33.8 | 32.3 |
| Leitrim | 102 | 2 | 6 | 12 | 41 | 34 | 7 | 33.2 | 31.3 |
| Mayo | 407 | 2 | 18 | 72 | 164 | 123 | 28 | 33.4 | 31.0 |
| Roscommon | 188 | 3 | 12 | 39 | 60 | 64 | 10 | 33.1 | 32.1 |
| Sligo | 177 | 1 | 13 | 28 | 64 | 62 | 9 | 33.1 | 32.1 |
| Ulster (Part of) | 782 | 8 | 71 | 129 | 295 | 222 | 57 | 32.7 | 30.1 |
| Cavan | 211 | 1 | 18 | 34 | 69 | 68 | 21 | 33.3 | 30.0 |
| Donegal | 406 | 6 | 43 | 77 | 157 | 99 | 24 | 32.1 | 30.0 |
| Monaghan | 165 | 1 | 10 | 18 | 69 | 55 | 12 | 33.7 | 30.8 |
| Regional Authorities: | |||||||||
| Border | 1,061 | 11 | 90 | 169 | 400 | 318 | 73 | 32.9 | 30.6 |
| Midland | 889 | 17 | 94 | 179 | 283 | 263 | 53 | 32.3 | 30.2 |
| West | 1,361 | 18 | 79 | 219 | 479 | 456 | 110 | 33.5 | 31.9 |
| Dublin | 4,201 | 54 | 331 | 708 | 1,422 | 1,349 | 337 | 33.2 | 31.5 |
| Mid-East | 2,199 | 25 | 144 | 363 | 749 | 743 | 175 | 33.4 | 31.6 |
| Mid-West | 1,335 | 18 | 97 | 244 | 446 | 442 | 88 | 33.0 | 31.3 |
| South-East | 1,188 | 19 | 95 | 234 | 397 | 364 | 79 | 32.6 | 30.6 |
| South-West | 1,889 | 20 | 118 | 262 | 638 | 700 | 151 | 33.7 | 32.0 |
| Mother Residing Outside the State | 12 | – | 1 | 1 | 7 | 2 | 1 | 33.0 | 33.4 |
| Table 10 Births registered outside marriage/civil partnership, classified by area of residence and age of mother, October - December 2019 | ||||||||
| Average age of mother at maternity | ||||||||
| Area of residence | Total | Under 25 | 25-29 | 30-34 | 35-39 | 40 and over | All births | First births |
| State | 5,252 | 1,001 | 1,455 | 1,445 | 1,062 | 289 | 30.7 | 29.3 |
| Leinster | 3,096 | 604 | 845 | 855 | 627 | 165 | 30.6 | 29.3 |
| Carlow | 83 | 16 | 22 | 27 | 16 | 2 | 30.2 | 28.7 |
| Dublin City | 700 | 148 | 174 | 176 | 156 | 46 | 30.8 | 29.7 |
| South Dublin | 379 | 79 | 113 | 108 | 64 | 15 | 30.0 | 28.8 |
| Fingal | 322 | 59 | 89 | 93 | 61 | 20 | 30.9 | 29.6 |
| Dún Laoghaire-Rathdown | 133 | 11 | 26 | 49 | 34 | 13 | 32.9 | 32.3 |
| Kildare | 250 | 44 | 67 | 70 | 58 | 11 | 30.9 | 29.1 |
| Kilkenny | 98 | 10 | 32 | 29 | 22 | 5 | 31.2 | 30.1 |
| Laois | 129 | 37 | 35 | 28 | 27 | 2 | 29.3 | 27.9 |
| Longford | 59 | 19 | 13 | 17 | 10 | – | 28.8 | 27.9 |
| Louth | 172 | 39 | 47 | 45 | 34 | 7 | 29.9 | 28.7 |
| Meath | 225 | 36 | 59 | 68 | 43 | 19 | 31.4 | 29.4 |
| Offaly | 90 | 23 | 27 | 23 | 14 | 3 | 29.5 | 27.9 |
| Westmeath | 88 | 18 | 28 | 19 | 20 | 3 | 30.1 | 28.3 |
| Wexford | 203 | 40 | 71 | 55 | 32 | 5 | 29.4 | 28.0 |
| Wicklow | 165 | 25 | 42 | 48 | 36 | 14 | 31.9 | 30.6 |
| Munster | 1,339 | 238 | 372 | 361 | 293 | 75 | 30.9 | 29.5 |
| Clare | 125 | 18 | 29 | 52 | 23 | 3 | 31.0 | 29.3 |
| Cork City | 141 | 24 | 36 | 39 | 34 | 8 | 31.2 | 30.3 |
| Cork County | 380 | 62 | 96 | 114 | 91 | 17 | 31.2 | 30.0 |
| Kerry | 126 | 23 | 28 | 31 | 30 | 14 | 31.8 | 31.0 |
| Limerick City | 107 | 26 | 38 | 18 | 20 | 5 | 29.4 | 28.0 |
| Limerick County | 131 | 16 | 42 | 29 | 37 | 7 | 31.5 | 30.3 |
| Tipperary | 186 | 38 | 54 | 48 | 33 | 13 | 30.5 | 28.2 |
| Waterford City | 70 | 15 | 22 | 17 | 13 | 3 | 30.0 | 28.5 |
| Waterford County | 73 | 16 | 27 | 13 | 12 | 5 | 29.9 | 27.9 |
| Connacht | 523 | 87 | 157 | 143 | 100 | 36 | 30.8 | 29.3 |
| Galway City | 73 | 15 | 14 | 23 | 15 | 6 | 30.8 | 29.7 |
| Galway County | 153 | 29 | 51 | 39 | 23 | 11 | 30.4 | 29.2 |
| Leitrim | 33 | 6 | 6 | 9 | 9 | 3 | 31.8 | 28.9 |
| Mayo | 146 | 15 | 48 | 46 | 29 | 8 | 31.3 | 28.4 |
| Roscommon | 64 | 10 | 22 | 13 | 14 | 5 | 31.2 | 30.4 |
| Sligo | 54 | 12 | 16 | 13 | 10 | 3 | 30.1 | 30.0 |
| Ulster (Part of) | 289 | 71 | 80 | 85 | 41 | 12 | 29.6 | 27.9 |
| Cavan | 73 | 18 | 23 | 19 | 10 | 3 | 29.5 | 27.8 |
| Donegal | 157 | 42 | 47 | 42 | 20 | 6 | 29.1 | 28.0 |
| Monaghan | 59 | 11 | 10 | 24 | 11 | 3 | 31.0 | 28.0 |
| Regional Authorities: | ||||||||
| Border | 376 | 89 | 102 | 107 | 60 | 18 | 29.9 | 28.4 |
| Midland | 366 | 97 | 103 | 87 | 71 | 8 | 29.5 | 28.0 |
| West | 436 | 69 | 135 | 121 | 81 | 30 | 30.9 | 29.3 |
| Dublin | 1,534 | 297 | 402 | 426 | 315 | 94 | 30.8 | 29.7 |
| Mid-East | 812 | 144 | 215 | 231 | 171 | 51 | 31.0 | 29.4 |
| Mid-West | 549 | 98 | 163 | 147 | 113 | 28 | 30.6 | 29.0 |
| South-East | 527 | 97 | 174 | 141 | 95 | 20 | 30.0 | 28.5 |
| South-West | 647 | 109 | 160 | 184 | 155 | 39 | 31.3 | 30.3 |
| Mother Residing Outside the State | 5 | 1 | 1 | 1 | 1 | 1 | 32.8 | 32.9 |
| Table 11 Births registered, classified by nationality of mother, marital status and age, October - December 2019 | ||||||||||
| Total births | Births inside marriage/civil partnership | Births outside marriage/civil partnership | Average age of mother at maternity | |||||||
| Nationality of mother | Number | Percentage | Number | Percentage | Number | Percentage | ||||
| TOTAL | 14,135 | 100.0 | 8,883 | 62.8 | 5,252 | 37.2 | 33.2 | |||
| Ireland | 10,936 | 77.4 | 6,720 | 61.4 | 4,216 | 38.6 | 33.5 | |||
| United Kingdom | 278 | 2.0 | 152 | 54.7 | 126 | 45.3 | 32.2 | |||
| EU15 excl. Irl & UK | 276 | 2.0 | 170 | 61.6 | 106 | 38.4 | 34.5 | |||
| EU16 to EU 28 | 1,378 | 9.7 | 800 | 58.1 | 578 | 41.9 | 31.4 | |||
| Other 1 | 1,266 | 9.0 | 1,040 | 82.1 | 226 | 17.9 | 32.3 | |||
| Not stated | 1 | 0.0 | 1 | 100.0 | – | – | 30.2 | |||
| 1 Countries excluding Ireland, UK and the EU. | ||||||||||
| Table 12 Deaths registered by county of residence of deceased, October - December 2019 | ||||
| Area of residence | Total | Male | Female | Rate1 |
| State | 7,639 | 3,975 | 3,664 | 6.2 |
| Leinster | 3,942 | 2,098 | 1,844 | 5.8 |
| Carlow | 94 | 48 | 46 | 6.4 |
| Dublin City | 1,097 | 585 | 512 | 7.8 |
| South Dublin | 337 | 192 | 145 | 4.7 |
| Fingal | 277 | 151 | 126 | 3.6 |
| Dún Laoghaire-Rathdown | 361 | 184 | 177 | 6.1 |
| Kildare | 247 | 144 | 103 | 4.2 |
| Kilkenny | 149 | 80 | 69 | 5.8 |
| Laois | 94 | 54 | 40 | 4.2 |
| Longford | 83 | 49 | 34 | 7.8 |
| Louth | 232 | 108 | 124 | 6.9 |
| Meath | 245 | 137 | 108 | 4.8 |
| Offaly | 101 | 54 | 47 | 5.0 |
| Westmeath | 155 | 83 | 72 | 6.7 |
| Wexford | 254 | 127 | 127 | 6.6 |
| Wicklow | 216 | 102 | 114 | 5.8 |
| Munster | 2,214 | 1,123 | 1,091 | 6.8 |
| Clare | 183 | 103 | 80 | 6.0 |
| Cork City | 258 | 139 | 119 | 8.3 |
| Cork County | 612 | 321 | 291 | 5.7 |
| Kerry | 291 | 138 | 153 | 7.8 |
| Limerick City | 126 | 65 | 61 | 8.6 |
| Limerick County | 222 | 107 | 115 | 6.3 |
| Tipperary | 307 | 148 | 159 | 7.4 |
| Waterford City | 85 | 36 | 49 | 7.0 |
| Waterford County | 130 | 66 | 64 | 7.3 |
| Connacht | 959 | 496 | 463 | 6.8 |
| Galway City | 107 | 55 | 52 | 5.6 |
| Galway County | 285 | 148 | 137 | 6.1 |
| Leitrim | 66 | 37 | 29 | 8.0 |
| Mayo | 246 | 126 | 120 | 7.3 |
| Roscommon | 126 | 65 | 61 | 7.5 |
| Sligo | 129 | 65 | 64 | 7.7 |
| Ulster | 524 | 258 | 266 | 6.8 |
| Cavan | 130 | 72 | 58 | 6.7 |
| Donegal | 288 | 145 | 143 | 7.0 |
| Monaghan | 106 | 41 | 65 | 6.7 |
| Regional Authorities: | ||||
| Border | 719 | 360 | 359 | 7.1 |
| Midland | 433 | 240 | 193 | 5.7 |
| West | 764 | 394 | 370 | 6.6 |
| Dublin | 2,072 | 1,112 | 960 | 5.9 |
| Mid-East | 940 | 491 | 449 | 5.2 |
| Mid-West | 838 | 423 | 415 | 6.9 |
| South-East | 712 | 357 | 355 | 6.5 |
| South-West | 1,161 | 598 | 563 | 6.6 |
| 1 Deaths per year per 1,000 population. Annual rates based on estimated 2019 Usual residence population. | ||||
| Table 13 Deaths registered by cause of death and county of residence of deceased, October - December 2019 | ||||||
| Area of residence | Total Deaths | Malignant Neoplasms | Diseases of the Circulatory system | Diseases of the Respiratory system | External causes | All other causes |
| State | 7,639 | 2,351 | 2,151 | 810 | 525 | 1,802 |
| Leinster | 3,942 | 1,225 | 1,126 | 422 | 252 | 917 |
| Carlow | 94 | 36 | 26 | 7 | 4 | 21 |
| Dublin City | 1,097 | 315 | 317 | 119 | 62 | 284 |
| South Dublin | 337 | 113 | 87 | 42 | 27 | 68 |
| Fingal | 277 | 78 | 78 | 26 | 26 | 69 |
| Dún Laoghaire-Rathdown | 361 | 97 | 133 | 32 | 13 | 86 |
| Kildare | 247 | 88 | 59 | 25 | 18 | 57 |
| Kilkenny | 149 | 55 | 37 | 14 | 8 | 35 |
| Laois | 94 | 32 | 24 | 5 | 7 | 26 |
| Longford | 83 | 19 | 32 | 7 | 8 | 17 |
| Louth | 232 | 77 | 49 | 22 | 27 | 57 |
| Meath | 245 | 81 | 62 | 36 | 14 | 52 |
| Offaly | 101 | 32 | 29 | 14 | 5 | 21 |
| Westmeath | 155 | 50 | 45 | 25 | 10 | 25 |
| Wexford | 254 | 78 | 77 | 30 | 15 | 54 |
| Wicklow | 216 | 74 | 71 | 18 | 8 | 45 |
| Munster | 2,214 | 653 | 635 | 226 | 184 | 516 |
| Clare | 183 | 58 | 52 | 25 | 15 | 33 |
| Cork City | 258 | 76 | 78 | 18 | 22 | 64 |
| Cork County | 612 | 187 | 166 | 53 | 47 | 159 |
| Kerry | 291 | 77 | 99 | 26 | 20 | 69 |
| Limerick City | 126 | 26 | 39 | 21 | 19 | 21 |
| Limerick County | 222 | 71 | 57 | 16 | 18 | 60 |
| Tipperary | 307 | 88 | 89 | 35 | 28 | 67 |
| Waterford City | 85 | 25 | 18 | 17 | 10 | 15 |
| Waterford County | 130 | 45 | 37 | 15 | 5 | 28 |
| Connacht | 959 | 301 | 246 | 105 | 61 | 246 |
| Galway City | 107 | 30 | 29 | 5 | 16 | 27 |
| Galway County | 285 | 92 | 76 | 30 | 19 | 68 |
| Leitrim | 66 | 26 | 13 | 8 | 3 | 16 |
| Mayo | 246 | 79 | 69 | 33 | 7 | 58 |
| Roscommon | 126 | 38 | 29 | 18 | 10 | 31 |
| Sligo | 129 | 36 | 30 | 11 | 6 | 46 |
| Ulster (part of) | 524 | 172 | 144 | 57 | 28 | 123 |
| Cavan | 130 | 42 | 32 | 14 | 6 | 36 |
| Donegal | 288 | 101 | 84 | 29 | 10 | 64 |
| Monaghan | 106 | 29 | 28 | 14 | 12 | 23 |
| Regional Authorities: | ||||||
| Border | 719 | 234 | 187 | 76 | 37 | 185 |
| Midland | 433 | 133 | 130 | 51 | 30 | 89 |
| West | 764 | 239 | 203 | 86 | 52 | 184 |
| Dublin | 2,072 | 603 | 615 | 219 | 128 | 507 |
| Mid-East | 940 | 320 | 241 | 101 | 67 | 211 |
| Mid-West | 838 | 243 | 237 | 97 | 80 | 181 |
| South-East | 712 | 239 | 195 | 83 | 42 | 153 |
| South-West | 1,161 | 340 | 343 | 97 | 89 | 292 |
| Table 14 Deaths registered classified by cause of death and age group, October - December 2019 | ||||||||||||||
| Age Group | ||||||||||||||
| Cause of Death | 65 COD | ICD-10 | Total | Under 1 | 1-4 | 5-14 | 15-24 | 25-34 | 35-44 | 45-54 | 55-64 | 65-74 | 75-84 | 85 and |
| Code | Code | Deaths | over | |||||||||||
| Total deaths | 0 | A00-Y89 | 7,639 | 44 | 10 | 13 | 51 | 115 | 205 | 355 | 702 | 1,366 | 2,143 | 2,635 |
| Infectious and parasitic diseases:- | 1 | A00-B99 | 76 | – | – | 1 | – | 1 | 2 | 4 | 3 | 14 | 15 | 36 |
| Tuberculosis | 2 | A15-A19,B90 | – | – | – | – | – | – | – | – | – | – | – | – |
| Meningococcal infection | 3 | A39 | – | – | – | – | – | – | – | – | – | – | – | – |
| AIDS (HIV Disease) | 4 | B20-B24 | 3 | – | – | – | – | 1 | – | – | 1 | 1 | – | – |
| Viral Hepatitis | 5 | B15-B19 | 6 | – | – | – | – | – | 2 | 2 | 1 | – | 1 | – |
| Other infectious and parasitic diseases | 67 | – | – | 1 | – | – | – | 2 | 1 | 13 | 14 | 36 | ||
| Neoplasms | 6 | C00-D48 | 2,424 | 1 | – | 4 | 6 | 19 | 48 | 128 | 340 | 659 | 739 | 480 |
| Malignant neoplasms of the:- | 7 | C00-C97 | 2,351 | – | – | 3 | 5 | 19 | 48 | 128 | 336 | 648 | 712 | 452 |
| Lip, oral cavity, pharynx | 8 | C00-C14 | 51 | – | – | – | – | – | – | 3 | 14 | 18 | 11 | 5 |
| Oesophagus | 9 | C15 | 104 | – | – | – | – | – | 1 | 4 | 21 | 28 | 26 | 24 |
| Stomach | 10 | C16 | 78 | – | – | – | – | 2 | 2 | 4 | 8 | 20 | 27 | 15 |
| Colon | 11 | C18 | 119 | – | – | – | – | – | 2 | 6 | 11 | 31 | 39 | 30 |
| Rectum and anus | 12 | C19-C21 | 160 | – | – | – | – | 1 | 7 | 7 | 21 | 43 | 48 | 33 |
| Liver and the intrahepatic bile ducts | 13 | C22 | 110 | – | – | – | – | 1 | 1 | 5 | 14 | 42 | 34 | 13 |
| Pancreas | 14 | C25 | 132 | – | – | – | – | 2 | – | 3 | 20 | 44 | 43 | 20 |
| Larynx and trachea/bronchus /lung | 15 | C32-C34 | 509 | – | – | – | – | – | 4 | 33 | 85 | 163 | 166 | 58 |
| Skin | 16 | C43 | 33 | – | – | – | – | 1 | 1 | 1 | 5 | 7 | 12 | 6 |
| Breast | 17 | C50 | 158 | – | – | – | – | 2 | 10 | 17 | 21 | 24 | 46 | 38 |
| Cervix uteri | 18 | C53 | 24 | – | – | – | – | 2 | 3 | 2 | 4 | 5 | 5 | 3 |
| Other parts of uterus | 19 | C54-C55 | 36 | – | – | – | – | – | 1 | – | 9 | 16 | 8 | 2 |
| Ovary | 20 | C56 | 85 | – | – | – | 1 | – | 2 | 7 | 13 | 22 | 26 | 14 |
| Prostate | 21 | C61 | 140 | – | – | – | – | – | – | – | 6 | 31 | 61 | 42 |
| Kidney | 22 | C64 | 49 | – | – | – | – | – | – | 4 | 15 | 9 | 8 | 13 |
| Bladder | 23 | C67 | 47 | – | – | – | – | – | – | 2 | 5 | 13 | 8 | 19 |
| Lymph/haematopoietic tissue | 24 | C81-C96 | 203 | – | – | 2 | 2 | 1 | 2 | 8 | 23 | 50 | 66 | 49 |
| Other malignant neoplasms | 313 | – | – | 1 | 2 | 7 | 12 | 22 | 41 | 82 | 78 | 68 | ||
| Diseases of the blood and blood-forming organs, immunological disorders | 25 | D50-D89 | 31 | – | – | 1 | – | – | 3 | 1 | 3 | 4 | 8 | 11 |
| Endocrine, nutritional and metabolic diseases | 26 | E00-E90 | 171 | – | – | – | – | 1 | 3 | 5 | 17 | 26 | 57 | 62 |
| Diabetes mellitus | 27 | E10-E14 | 122 | – | – | – | – | – | – | 3 | 10 | 19 | 48 | 42 |
| Mental and behavioural disorders | 28 | F00-F99 | 482 | – | – | – | – | – | – | 4 | 3 | 25 | 143 | 307 |
| Alcohol abuse (including alcoholic psychosis) | 29 | F10 | 4 | – | – | – | – | – | – | 2 | – | – | 1 | 1 |
| Drug dependence, toxicomania | 30 | F11-F16,F18-F19 | – | – | – | – | – | – | – | – | – | – | – | – |
| Diseases of the nervous system and the sense organs | 31 | G00-H95 | 420 | – | 1 | 1 | 2 | 3 | 8 | 6 | 30 | 69 | 147 | 153 |
| Meningitis | 32 | G00-G03 | – | – | – | – | – | – | – | – | – | – | – | – |
| Diseases of the circulatory system:- | 33 | I00-I99 | 2,151 | 1 | – | – | 2 | 7 | 27 | 68 | 157 | 310 | 615 | 964 |
| Ischaemic heart disease | 34 | I20-I25 | 996 | – | – | – | – | 2 | 14 | 37 | 107 | 169 | 284 | 383 |
| of which: (Acute myocardial infarction) | I21 | 427 | – | – | – | – | 1 | 5 | 13 | 37 | 59 | 121 | 191 | |
| Other heart disease | 35 | I30-I33,I39-I52 | 424 | 1 | – | – | 2 | 2 | 3 | 6 | 23 | 35 | 100 | 252 |
| Cerebrovascular disease | 36 | I60-I69 | 376 | – | – | – | – | 1 | 7 | 16 | 13 | 57 | 122 | 160 |
| Other diseases of circulatory system | 355 | – | – | – | – | 2 | 3 | 9 | 14 | 49 | 109 | 169 | ||
| Diseases of the respiratory system | 37 | J00-J99 | 810 | – | 1 | – | – | 1 | 5 | 11 | 27 | 143 | 259 | 363 |
| Influenza | 38 | J09-J11 | 5 | – | – | – | – | – | 1 | – | 1 | 1 | 1 | 1 |
| Pneumonia | 39 | J12-J19 | 207 | – | 1 | – | – | 1 | 1 | 5 | 5 | 23 | 41 | 130 |
| Chronic lower respiratory disease | 40 | J40-J47 | 374 | – | – | – | – | – | 2 | 3 | 16 | 84 | 143 | 126 |
| of which: Asthma | 41 | J45-J46 | 10 | – | – | – | – | – | – | – | – | 1 | 4 | 5 |
| Other diseases of the respiratory system | 224 | – | – | – | – | – | 1 | 3 | 5 | 35 | 74 | 106 | ||
| Diseases of the digestive system | 42 | K00-K93 | 259 | – | – | – | 1 | 4 | 14 | 29 | 33 | 41 | 60 | 77 |
| Ulcer of stomach, duodenum and jejunum | 43 | K25-K28 | 13 | – | – | – | – | 1 | – | – | 3 | 2 | 5 | 2 |
| Chronic liver disease | 44 | K70,K73-K74 | 71 | – | – | – | – | 3 | 11 | 21 | 11 | 15 | 7 | 3 |
| Other diseases of the digestive system | 175 | – | – | – | 1 | – | 3 | 8 | 19 | 24 | 48 | 72 | ||
| Diseases of the skin and subcutaneous tissue | 45 | L00-L99 | 16 | – | – | – | – | – | 1 | – | – | 3 | 5 | 7 |
| Diseases of the musculoskeletal system/connective tissue | 46 | M00-M99 | 50 | – | – | – | – | 1 | – | 1 | 1 | 8 | 11 | 28 |
| Rheumatoid arthritis and osteoarthrosis | 47 | M05-M06,M15-M19 | 10 | – | – | – | – | – | – | – | – | 2 | 2 | 6 |
| Diseases of the genitourinary system | 48 | N00-N99 | 117 | – | – | – | – | 1 | 1 | 1 | 4 | 9 | 31 | 70 |
| Diseases of the kidney and ureter | 49 | N00-N29 | 70 | – | – | – | – | 1 | – | – | 3 | 8 | 20 | 38 |
| Complications of pregnancy, childbirth and puerperium | 50 | O00-O99 | – | – | – | – | – | – | – | – | – | – | – | – |
| Certain conditions originating in the perinatal period1 | 51 | P00-P96 | 18 | 17 | 1 | – | – | – | – | – | – | – | – | – |
| Congenital malformations and chromosomal abnormalities | 52 | Q00-Q99 | 49 | 22 | 2 | 1 | 2 | 1 | 2 | 4 | 6 | 5 | 3 | 1 |
| Congenital malformations of the nervous system | 53 | Q00-Q07 | 7 | 5 | – | 1 | – | – | – | – | – | – | 1 | – |
| Congenital malformations of the circulatory system | 54 | Q20-Q28 | 8 | 5 | 1 | – | 1 | – | 1 | – | – | – | – | – |
| Symptoms, signs, abnormal findings, ill-defined causes | 55 | R00-R99 | 40 | 3 | 1 | 1 | – | 3 | 1 | – | 2 | 1 | 3 | 25 |
| Sudden infant death syndrome | 56 | R95 | 4 | 3 | 1 | – | – | – | – | – | – | – | – | – |
| Unknown and unspecified causes | 57 | R96-R99 | 9 | – | – | 1 | – | 3 | 1 | – | 2 | – | 2 | – |
| External causes of injury and poisoning | 58 | V01-Y89 | 525 | – | 4 | 4 | 38 | 73 | 90 | 93 | 76 | 49 | 47 | 51 |
| Accidents | 59 | V01-X59 | 339 | – | 3 | 3 | 18 | 43 | 49 | 52 | 45 | 35 | 44 | 47 |
| of which: Transport accidents | 60 | V01-V99 | 38 | – | 2 | 2 | 6 | 4 | 4 | 8 | 3 | 4 | 4 | 1 |
| Accidental falls | 61 | W00-W19 | 79 | – | 1 | – | 1 | 1 | 4 | 9 | 10 | 10 | 24 | 19 |
| Accidental poisoning | 62 | X40-X49 | 120 | – | – | – | 5 | 30 | 29 | 30 | 19 | 4 | 1 | 2 |
| Other accidents | 102 | – | – | 1 | 6 | 8 | 12 | 5 | 13 | 17 | 15 | 25 | ||
| Suicide and intentional self harm | 63 | X60-X84 | 156 | – | – | – | 20 | 26 | 35 | 33 | 27 | 12 | 2 | 1 |
| Homicide/assault | 64 | X85-Y09 | 3 | – | 1 | – | – | 1 | 1 | – | – | – | – | – |
| Events of undetermined intent | 65 | Y10-Y34 | 19 | – | – | – | – | 3 | 5 | 6 | 4 | – | – | 1 |
| All other external causes | 8 | – | – | 1 | – | – | – | 2 | – | 2 | 1 | 2 | ||
| 1 Stillbirths not included. | ||||||||||||||
| Table 15 Male deaths registered classified by cause of death and age group, October - December 2019 | ||||||||||||||
| Age Group | ||||||||||||||
| Cause of Death | 65 COD | ICD-10 | Total | Under 1 | 1-4 | 5-14 | 15-24 | 25-34 | 35-44 | 45-54 | 55-64 | 65-74 | 75-84 | 85 and |
| Code | Code | Males | over | |||||||||||
| Total Male Deaths | 0 | A00-Y89 | 3,975 | 22 | 6 | 10 | 38 | 81 | 118 | 228 | 447 | 807 | 1,168 | 1,050 |
| Infectious and parasitic diseases:- | 1 | A00-B99 | 37 | – | – | 1 | – | 1 | 1 | 2 | 1 | 7 | 9 | 15 |
| Tuberculosis | 2 | A15-A19,B90 | – | – | – | – | – | – | – | – | – | – | – | – |
| Meningococcal infection | 3 | A39 | – | – | – | – | – | – | – | – | – | – | – | – |
| AIDS (HIV Disease) | 4 | B20-B24 | 2 | – | – | – | – | 1 | – | – | – | – | – | – |
| Viral Hepatitis | 5 | B15-B19 | 4 | – | – | – | – | – | 1 | 2 | 1 | – | – | – |
| Other infectious and parasitic diseases | 31 | – | – | 1 | – | – | – | – | – | 6 | 9 | 15 | ||
| Neoplasms | 6 | C00-D48 | 1,319 | 1 | – | 3 | 2 | 11 | 13 | 67 | 192 | 380 | 423 | 227 |
| Malignant neoplasms of the:- | 7 | C00-C97 | 1,277 | – | – | 2 | 2 | 11 | 13 | 67 | 188 | 373 | 409 | 212 |
| Lip, oral cavity, pharynx | 8 | C00-C14 | 35 | – | – | – | – | – | – | 2 | 10 | 14 | 7 | 2 |
| Oesophagus | 9 | C15 | 53 | – | – | – | – | – | – | 2 | 12 | 16 | 12 | 11 |
| Stomach | 10 | C16 | 48 | – | – | – | – | 1 | – | 2 | 7 | 15 | 16 | 7 |
| Colon | 11 | C18 | 69 | – | – | – | – | – | 1 | 2 | 7 | 22 | 25 | 12 |
| Rectum and anus | 12 | C19-C21 | 96 | – | – | – | – | 1 | 2 | 6 | 13 | 29 | 31 | 14 |
| Liver and the intrahepatic bile ducts | 13 | C22 | 69 | – | – | – | – | 1 | 1 | 4 | 10 | 26 | 20 | 7 |
| Pancreas | 14 | C25 | 70 | – | – | – | – | 2 | – | 1 | 13 | 24 | 22 | 8 |
| Larynx and trachea/bronchus /lung | 15 | C32-C34 | 294 | – | – | – | – | – | 2 | 23 | 51 | 87 | 99 | 32 |
| Skin | 16 | C43 | 23 | – | – | – | – | – | 1 | – | 2 | 7 | 10 | 3 |
| Breast | 17 | C50 | 0 | – | – | – | – | – | – | – | – | – | – | – |
| Cervix uteri | 18 | C53 | 0 | – | – | – | – | – | – | – | – | – | – | – |
| Other parts of uterus | 19 | C54-C55 | 0 | – | – | – | – | – | – | – | – | – | – | – |
| Ovary | 20 | C56 | 0 | – | – | – | – | – | – | – | – | – | – | – |
| Prostate | 21 | C61 | 140 | – | – | – | – | – | – | – | 6 | 31 | 61 | 42 |
| Kidney | 22 | C64 | 38 | – | – | – | – | – | – | 3 | 13 | 7 | 7 | 8 |
| Bladder | 23 | C67 | 33 | – | – | – | – | – | – | 2 | 3 | 9 | 7 | 12 |
| Lymph/haematopoietic tissue | 24 | C81-C96 | 119 | – | – | 2 | 2 | 1 | 2 | 4 | 15 | 28 | 40 | 25 |
| Other malignant neoplasms | 190 | – | – | – | – | 5 | 4 | 16 | 26 | 58 | 52 | 29 | ||
| Diseases of the blood and blood-forming organs, immunological disorders | 25 | D50-D89 | 19 | – | – | 1 | – | – | – | – | 3 | 3 | 5 | 7 |
| Endocrine, nutritional and metabolic diseases | 26 | E00-E90 | 87 | – | – | – | – | 1 | 1 | 3 | 12 | 14 | 30 | 26 |
| Diabetes mellitus | 27 | E10-E14 | 65 | – | – | – | – | – | – | 1 | 6 | 11 | 28 | 19 |
| Mental and behavioural disorders | 28 | F00-F99 | 186 | – | – | – | – | – | – | 3 | 1 | 11 | 67 | 104 |
| Alcohol abuse (including alcoholic psychosis) | 29 | F10 | 4 | – | – | – | – | – | – | 2 | – | – | 1 | 1 |
| Drug dependence, toxicomania | 30 | F11-F16,F18-F19 | - | – | – | – | – | – | – | – | – | – | – | – |
| Diseases of the nervous system and the sense organs | 31 | G00-H95 | 205 | – | – | 1 | – | 2 | 4 | 4 | 16 | 39 | 85 | 54 |
| Meningitis | 32 | G00-G03 | – | – | – | – | – | – | – | – | – | – | – | – |
| Diseases of the circulatory system:- | 33 | I00-I99 | 1,114 | – | – | – | 1 | 7 | 24 | 51 | 125 | 197 | 341 | 368 |
| Ischaemic heart disease | 34 | I20-I25 | 602 | – | – | – | – | 2 | 12 | 30 | 89 | 119 | 170 | 180 |
| of which: (Acute myocardial infarction) | I21 | 247 | – | – | – | – | 1 | 3 | 11 | 33 | 45 | 69 | 85 | |
| Other heart disease | 35 | I30-I33,I39-I52 | 192 | – | – | – | 1 | 2 | 3 | 6 | 17 | 26 | 55 | 82 |
| Cerebrovascular disease | 36 | I60-I69 | 169 | – | – | – | – | 1 | 7 | 11 | 11 | 32 | 58 | 49 |
| Other diseases of circulatory system | 151 | – | – | – | – | 2 | 2 | 4 | 8 | 20 | 58 | 57 | ||
| Diseases of the respiratory system | 37 | J00-J99 | 388 | – | 1 | – | – | – | – | 6 | 15 | 85 | 132 | 149 |
| Influenza | 38 | J09-J11 | 3 | – | – | – | – | – | – | – | 1 | 1 | 1 | - |
| Pneumonia | 39 | J12-J19 | 102 | – | 1 | – | – | – | – | 3 | 4 | 12 | 24 | 58 |
| Chronic lower respiratory disease | 40 | J40-J47 | 173 | – | – | – | – | – | – | 2 | 5 | 48 | 67 | 51 |
| of which: Asthma | 41 | J45-J46 | 3 | – | – | – | – | – | – | – | – | – | 3 | – |
| Other diseases of the respiratory system | 110 | – | – | – | – | – | – | 1 | 5 | 24 | 40 | 40 | ||
| – | – | – | ||||||||||||
| Diseases of the digestive system | 42 | K00-K93 | 147 | – | – | – | 1 | 3 | 8 | 18 | 25 | 25 | 33 | 34 |
| Ulcer of stomach, duodenum and jejunum | 43 | K25-K28 | 7 | – | – | – | – | 1 | – | – | 2 | 1 | 1 | 2 |
| Chronic liver disease | 44 | K70,K73-K74 | 48 | – | – | – | – | 2 | 7 | 14 | 8 | 10 | 5 | 2 |
| Other diseases of the digestive system | 92 | – | – | – | 1 | – | 1 | 4 | 15 | 14 | 27 | 30 | ||
| – | ||||||||||||||
| Diseases of the skin and subcutaneous tissue | 45 | L00-L99 | 6 | – | – | – | – | – | 1 | – | – | 1 | 3 | 1 |
| – | ||||||||||||||
| Diseases of the musculoskeletal system/connective tissue | 46 | M00-M99 | 13 | – | – | – | – | – | – | – | – | 4 | 5 | 4 |
| Rheumatoid arthritis and osteoarthrosis | 47 | M05-M06,M15-M19 | 2 | – | – | – | – | – | – | – | – | – | 1 | 1 |
| – | – | – | – | – | ||||||||||
| Diseases of the genitourinary system | 48 | N00-N99 | 50 | – | – | – | – | – | 1 | 1 | 2 | 3 | 14 | 29 |
| Diseases of the kidney and ureter | 49 | N00-N29 | 30 | – | – | – | – | – | – | – | 2 | 3 | 11 | 14 |
| Complications of pregnancy, childbirth and puerperium | 50 | O00-O99 | – | – | – | – | – | – | – | – | – | – | – | – |
| Certain conditions originating in the perinatal period1 | 51 | P00-P96 | 10 | 9 | 1 | – | – | – | – | – | – | – | – | – |
| Congenital malformations and chromosomal abnormalities | 52 | Q00-Q99 | 29 | 11 | 2 | – | 1 | 1 | 1 | 4 | 3 | 4 | 1 | 1 |
| Congenital malformations of the nervous system | 53 | Q00-Q07 | 2 | 2 | – | – | – | – | – | – | – | – | – | – |
| Congenital malformations of the circulatory system | 54 | Q20-Q28 | 2 | 1 | 1 | – | – | – | – | – | – | – | – | – |
| Symptoms, signs, abnormal findings, ill-defined causes | 55 | R00-R99 | 14 | 1 | 1 | – | – | 3 | 1 | 0 | 0 | 1 | 2 | 5 |
| Sudden infant death syndrome | 56 | R95 | 2 | 1 | 1 | – | – | – | – | – | – | – | – | – |
| Unknown and unspecified causes | 57 | R96-R99 | 6 | – | – | – | – | 3 | 1 | – | – | – | 2 | – |
| External causes of injury and poisoning | 58 | V01-Y89 | 351 | – | 1 | 4 | 33 | 52 | 63 | 69 | 52 | 33 | 18 | 26 |
| Accidents | 59 | V01-X59 | 215 | – | 1 | 3 | 17 | 28 | 36 | 40 | 28 | 22 | 16 | 24 |
| of which: Transport accidents | 60 | V01-V99 | 30 | – | – | 2 | 6 | 3 | 4 | 7 | 2 | 3 | 2 | 1 |
| Accidental falls | 61 | W00-W19 | 44 | – | 1 | – | 1 | 1 | 2 | 7 | 9 | 4 | 7 | 12 |
| Accidental poisoning | 62 | X40-X49 | 71 | – | – | – | 4 | 17 | 20 | 21 | 5 | 3 | – | 1 |
| Other accidents | 70 | – | – | 1 | 6 | 7 | 10 | 5 | 12 | 12 | 7 | 10 | ||
| Suicide and intentional self harm | 63 | X60-X84 | 118 | – | – | – | 16 | 22 | 23 | 25 | 20 | 10 | 1 | 1 |
| Homicide/assault | 64 | X85-Y09 | 2 | – | – | – | – | 1 | 1 | – | – | – | – | – |
| Events of undetermined intent | 65 | Y10-Y34 | 12 | – | – | – | – | 1 | 3 | 3 | 4 | – | – | 1 |
| All other external causes | 4 | – | – | 1 | – | – | – | 1 | – | 1 | 1 | – | ||
| 1 Stillbirths not included. | ||||||||||||||
| Table 16 Female deaths registered classified by cause of death and age group, October - December 2019 | ||||||||||||||
| Age Group | ||||||||||||||
| Cause of Death | 65 COD | ICD-10 | Total | Under 1 | 1-4 | 5-14 | 15-24 | 25-34 | 35-44 | 45-54 | 55-64 | 65-74 | 75-84 | 85 and |
| Code | Code | Females | over | |||||||||||
| Total Female Deaths | 0 | A00-Y89 | 3,664 | 22 | 4 | 3 | 13 | 34 | 87 | 127 | 255 | 559 | 975 | 1,585 |
| Infectious and parasitic diseases:- | 1 | A00-B99 | 39 | – | – | – | – | – | 1 | 2 | 2 | 7 | 6 | 21 |
| Tuberculosis | 2 | A15-A19,B90 | – | – | – | – | – | – | – | – | – | – | – | – |
| Meningococcal infection | 3 | A39 | – | – | – | – | – | – | – | – | – | – | – | – |
| AIDS (HIV Disease) | 4 | B20-B24 | 1 | – | – | – | – | – | – | – | 1 | – | – | – |
| Viral Hepatitis | 5 | B15-B19 | 2 | – | – | – | – | – | 1 | – | – | – | 1 | – |
| Other infectious and parasitic diseases | 36 | – | – | – | – | – | – | 2 | 1 | 7 | 5 | 21 | ||
| Neoplasms | 6 | C00-D48 | 1,105 | – | – | 1 | 4 | 8 | 35 | 61 | 148 | 279 | 316 | 253 |
| Malignant neoplasms of the:- | 7 | C00-C97 | 1,074 | – | – | 1 | 3 | 8 | 35 | 61 | 148 | 275 | 303 | 240 |
| Lip, oral cavity, pharynx | 8 | C00-C14 | 16 | – | – | – | – | – | – | 1 | 4 | 4 | 4 | 3 |
| Oesophagus | 9 | C15 | 51 | – | – | – | – | – | 1 | 2 | 9 | 12 | 14 | 13 |
| Stomach | 10 | C16 | 30 | – | – | – | – | 1 | 2 | 2 | 1 | 5 | 11 | 8 |
| Colon | 11 | C18 | 50 | – | – | – | – | – | 1 | 4 | 4 | 9 | 14 | 18 |
| Rectum and anus | 12 | C19-C21 | 64 | – | – | – | – | – | 5 | 1 | 8 | 14 | 17 | 19 |
| Liver and the intrahepatic bile ducts | 13 | C22 | 41 | – | – | – | – | – | – | 1 | 4 | 16 | 14 | 6 |
| Pancreas | 14 | C25 | 62 | – | – | – | – | – | – | 2 | 7 | 20 | 21 | 12 |
| Larynx and trachea/bronchus /lung | 15 | C32-C34 | 215 | – | – | – | – | – | 2 | 10 | 34 | 76 | 67 | 26 |
| Skin | 16 | C43 | 10 | – | – | – | – | 1 | – | 1 | 3 | – | 2 | 3 |
| Breast | 17 | C50 | 158 | – | – | – | – | 2 | 10 | 17 | 21 | 24 | 46 | 38 |
| Cervix uteri | 18 | C53 | 24 | – | – | – | – | 2 | 3 | 2 | 4 | 5 | 5 | 3 |
| Other parts of uterus | 19 | C54-C55 | 36 | – | – | – | – | – | 1 | – | 9 | 16 | 8 | 2 |
| Ovary | 20 | C56 | 85 | – | – | – | 1 | – | 2 | 7 | 13 | 22 | 26 | 14 |
| Prostate | 21 | C61 | – | – | – | – | – | – | – | – | – | – | – | – |
| Kidney | 22 | C64 | 11 | – | – | – | – | – | – | 1 | 2 | 2 | 1 | 5 |
| Bladder | 23 | C67 | 14 | – | – | – | – | – | – | – | 2 | 4 | 1 | 7 |
| Lymph/haematopoietic tissue | 24 | C81-C96 | 84 | – | – | – | – | – | – | 4 | 8 | 22 | 26 | 24 |
| Other malignant neoplasms | 123 | – | – | 1 | 2 | 2 | 8 | 6 | 15 | 24 | 26 | 39 | ||
| Diseases of the blood and blood-forming organs, immunological disorders | 25 | D50-D89 | 12 | – | – | – | – | – | 3 | 1 | – | 1 | 3 | 4 |
| Endocrine, nutritional and metabolic diseases | 26 | E00-E90 | 84 | – | – | – | – | – | 2 | 2 | 5 | 12 | 27 | 36 |
| Diabetes mellitus | 27 | E10-E14 | 57 | – | – | – | – | – | – | 2 | 4 | 8 | 20 | 23 |
| Mental and behavioural disorders | 28 | F00-F99 | 296 | – | – | – | – | – | – | 1 | 2 | 14 | 76 | 203 |
| Alcohol abuse (including alcoholic psychosis) | 29 | F10 | – | – | – | – | – | – | – | – | – | – | – | – |
| Drug dependence, toxicomania | 30 | F11-F16,F18-F19 | – | – | – | – | – | – | – | – | – | – | – | – |
| Diseases of the nervous system and the sense organs | 31 | G00-H95 | 215 | – | 1 | – | 2 | 1 | 4 | 2 | 14 | 30 | 62 | 99 |
| Meningitis | 32 | G00-G03 | – | – | – | – | – | – | – | – | – | – | – | – |
| Diseases of the circulatory system:- | 33 | I00-I99 | 1,037 | 1 | – | – | 1 | – | 3 | 17 | 32 | 113 | 274 | 596 |
| Ischaemic heart disease | 34 | I20-I25 | 394 | – | – | – | – | – | 2 | 7 | 18 | 50 | 114 | 203 |
| of which: (Acute myocardial infarction) | I21 | 180 | – | – | – | – | – | 2 | 2 | 4 | 14 | 52 | 106 | |
| Other heart disease | 35 | I30-I33,I39-I52 | 232 | 1 | – | – | 1 | – | – | – | 6 | 9 | 45 | 170 |
| Cerebrovascular disease | 36 | I60-I69 | 207 | – | – | – | – | – | – | 5 | 2 | 25 | 64 | 111 |
| Other diseases of circulatory system | 204 | – | – | – | – | – | 1 | 5 | 6 | 29 | 51 | 112 | ||
| Diseases of the respiratory system | 37 | J00-J99 | 422 | – | – | – | – | 1 | 5 | 5 | 12 | 58 | 127 | 214 |
| Influenza | 38 | J09-J11 | 2 | – | – | – | – | – | 1 | – | – | – | – | 1 |
| Pneumonia | 39 | J12-J19 | 105 | – | – | – | – | 1 | 1 | 2 | 1 | 11 | 17 | 72 |
| Chronic lower respiratory disease | 40 | J40-J47 | 201 | – | – | – | – | – | 2 | 1 | 11 | 36 | 76 | 75 |
| of which: Asthma | 41 | J45-J46 | 7 | – | – | – | – | – | – | – | – | 1 | 1 | 5 |
| Other diseases of the respiratory system | 114 | – | – | – | – | – | 1 | 2 | – | 11 | 34 | 66 | ||
| Diseases of the digestive system | 42 | K00-K93 | 112 | – | – | – | – | 1 | 6 | 11 | 8 | 16 | 27 | 43 |
| Ulcer of stomach, duodenum and jejunum | 43 | K25-K28 | 6 | – | – | – | – | – | – | – | 1 | 1 | 4 | – |
| Chronic liver disease | 44 | K70,K73-K74 | 23 | – | – | – | – | 1 | 4 | 7 | 3 | 5 | 2 | 1 |
| Other diseases of the digestive system | 83 | – | – | – | – | – | 2 | 4 | 4 | 10 | 21 | 42 | ||
| Diseases of the skin and subcutaneous tissue | 45 | L00-L99 | 10 | – | – | – | – | – | – | – | – | 2 | 2 | 6 |
| Diseases of the musculoskeletal system/connective tissue | 46 | M00-M99 | 37 | – | – | – | – | 1 | – | 1 | 1 | 4 | 6 | 24 |
| Rheumatoid arthritis and osteoarthrosis | 47 | M05-M06,M15-M19 | 8 | – | – | – | – | – | – | – | – | 2 | 1 | 5 |
| Diseases of the genitourinary system | 48 | N00-N99 | 67 | – | – | – | – | 1 | – | – | 2 | 6 | 17 | 41 |
| Diseases of the kidney and ureter | 49 | N00-N29 | 40 | – | – | – | – | 1 | – | – | 1 | 5 | 9 | 24 |
| Complications of pregnancy, childbirth and puerperium | 50 | O00-O99 | – | – | – | – | – | – | – | – | – | – | – | – |
| Certain conditions originating in the perinatal period1 | 51 | P00-P96 | 8 | 8 | – | – | – | – | – | – | – | – | – | – |
| Congenital malformations and chromosomal abnormalities | 52 | Q00-Q99 | 20 | 11 | – | 1 | 1 | – | 1 | – | 3 | 1 | 2 | – |
| Congenital malformations of the nervous system | 53 | Q00-Q07 | 5 | 3 | – | 1 | – | – | – | – | – | – | 1 | – |
| Congenital malformations of the circulatory system | 54 | Q20-Q28 | 6 | 4 | – | – | 1 | – | 1 | – | – | – | – | – |
| Symptoms, signs, abnormal findings, ill-defined causes | 55 | R00-R99 | 26 | 2 | – | 1 | – | – | – | – | 2 | – | 1 | 20 |
| Sudden infant death syndrome | 56 | R95 | 2 | 2 | – | – | – | – | – | – | – | – | – | – |
| Unknown and unspecified causes | 57 | R96-R99 | 3 | – | – | 1 | – | – | – | – | 2 | – | – | – |
| External causes of injury and poisoning | 58 | V01-Y89 | 174 | – | 3 | – | 5 | 21 | 27 | 24 | 24 | 16 | 29 | 25 |
| Accidents | 59 | V01-X59 | 124 | – | 2 | – | 1 | 15 | 13 | 12 | 17 | 13 | 28 | 23 |
| of which: Transport accidents | 60 | V01-V99 | 8 | – | 2 | – | – | 1 | – | 1 | 1 | 1 | 2 | – |
| Accidental falls | 61 | W00-W19 | 35 | – | – | – | – | – | 2 | 2 | 1 | 6 | 17 | 7 |
| Accidental poisoning | 62 | X40-X49 | 49 | – | – | – | 1 | 13 | 9 | 9 | 14 | 1 | 1 | 1 |
| Other accidents | 32 | – | – | – | – | 1 | 2 | – | 1 | 5 | 8 | 15 | ||
| Suicide and intentional self harm | 63 | X60-X84 | 38 | – | – | – | 4 | 4 | 12 | 8 | 7 | 2 | 1 | – |
| Homicide/assault | 64 | X85-Y09 | 1 | – | 1 | – | – | – | – | – | – | – | – | – |
| Events of undetermined intent | 65 | Y10-Y34 | 7 | – | – | – | – | 2 | 2 | 3 | – | – | – | – |
| All other external causes | 4 | – | – | – | – | – | – | 1 | – | 1 | – | 2 | ||
| 1 Stillbirths not included. | ||||||||||||||
| Table 17 Infant and neonatal mortality by area of residence of deceased, October - December 2019 | |||||
| Infant mortality1 | Neonatal mortality2 | ||||
| Area of residence | Number | Rate | Number | Rate3 | |
| STATE | 44 | 3.1 | 34 | 2.4 | |
| LEINSTER | 28 | 3.4 | 22 | 2.7 | |
| Carlow | 0 | 0.0 | 0 | 0.0 | |
| Dublin City | 9 | 5.6 | 7 | 4.3 | |
| South Dublin | 2 | 2.1 | 1 | 1.0 | |
| Fingal | 3 | 3.0 | 2 | 2.0 | |
| Dún Laoghaire Rathdown | 3 | 4.9 | 3 | 4.9 | |
| Kildare | 2 | 2.6 | 2 | 2.6 | |
| Kilkenny | 0 | 0.0 | 0 | 0.0 | |
| Laois | 1 | 3.6 | 0 | 0.0 | |
| Longford | 1 | 7.5 | 1 | 7.5 | |
| Louth | 1 | 2.6 | 1 | 2.6 | |
| Meath | 3 | 4.8 | 2 | 3.2 | |
| Offaly | 0 | 0.0 | 0 | 0.0 | |
| Westmeath | 2 | 7.6 | 2 | 7.6 | |
| Wexford | 0 | 0.0 | 0 | 0.0 | |
| Wicklow | 1 | 2.3 | 1 | 2.3 | |
| MUNSTER | 11 | 3.1 | 8 | 2.3 | |
| Clare | 0 | 0.0 | 0 | 0.0 | |
| Cork City | 1 | 3.7 | 1 | 3.7 | |
| Cork County | 5 | 4.0 | 2 | 1.6 | |
| Kerry | 1 | 2.7 | 1 | 2.7 | |
| Limerick City | 1 | 5.7 | 1 | 5.7 | |
| Limerick County | 1 | 2.5 | 1 | 2.5 | |
| Tipperary | 1 | 2.3 | 1 | 2.3 | |
| Waterford City | 1 | 7.2 | 1 | 7.2 | |
| Waterford County | 0 | 0.0 | 0 | 0.0 | |
| CONNACHT | 1 | 0.6 | 1 | 0.6 | |
| Galway City | 0 | 0.0 | 0 | 0.0 | |
| Galway County | 1 | 1.8 | 1 | 1.8 | |
| Leitrim | 0 | 0.0 | 0 | 0.0 | |
| Mayo | 0 | 0.0 | 0 | 0.0 | |
| Roscommon | 0 | 0.0 | 0 | 0.0 | |
| Sligo | 0 | 0.0 | 0 | 0.0 | |
| ULSTER (PART OF) | 4 | 5.1 | 3 | 3.8 | |
| Cavan | 2 | 9.5 | 2 | 9.5 | |
| Donegal | 2 | 4.9 | 1 | 2.5 | |
| Monaghan | 0 | 0.0 | 0 | 0.0 | |
| REGIONAL AUTHORITIES: | |||||
| Border | 4 | 3.8 | 3 | 2.8 | |
| Midland | 4 | 4.5 | 3 | 3.4 | |
| West | 1 | 0.7 | 1 | 0.7 | |
| Dublin | 17 | 4.0 | 13 | 3.1 | |
| Mid-East | 7 | 3.2 | 6 | 2.7 | |
| Mid-West | 3 | 2.2 | 3 | 2.2 | |
| South-East | 1 | 0.8 | 1 | 0.8 | |
| South-West | 7 | 3.7 | 4 | 2.1 | |
| 1 Infant mortality rates: Deaths of infants under one year per 1,000 live births, classified by area of residence of mother. | |||||
| 2 Neonatal mortality rates: Deaths of infants under 28 days per 1,000 live births, classified by area of residence of mother. | |||||
| 3 Infant and neonatal mortality rates in some areas, based on small numbers, are subject to considerable fluctuation and caution should be exercised in their interpretation. | |||||
 Show Table 18 Dementia deaths registered by county of residence of deceased, October - December 2019
| Table 18 Dementia1 deaths registered by county of residence of deceased, October - December 2019 | |||
| Area of residence | Total | Male | Female |
| State | 473 | 179 | 294 |
| Leinster | 255 | 103 | 152 |
| Carlow | 6 | 2 | 4 |
| Dublin City | 94 | 44 | 50 |
| South Dublin | 21 | 7 | 14 |
| Fingal | 19 | 7 | 12 |
| Dún Laoghaire Rathdown | 30 | 9 | 21 |
| Kildare | 14 | 9 | 5 |
| Kilkenny | 8 | 6 | 2 |
| Laois | 5 | 3 | 2 |
| Longford | 4 | 2 | 2 |
| Louth | 13 | 4 | 9 |
| Meath | 12 | 3 | 9 |
| Offaly | 5 | 2 | 3 |
| Westmeath | 2 | 1 | 1 |
| Wexford | 8 | 1 | 7 |
| Wicklow | 14 | 3 | 11 |
| Munster | 138 | 52 | 86 |
| Clare | 8 | 6 | 2 |
| Cork City | 25 | 13 | 12 |
| Cork County | 44 | 15 | 29 |
| Kerry | 17 | 7 | 10 |
| Limerick City | 8 | 3 | 5 |
| Limerick County | 13 | 2 | 11 |
| Tipperary | 14 | 3 | 11 |
| Waterford City | – | – | – |
| Waterford County | 9 | 3 | 6 |
| Connacht | 57 | 17 | 40 |
| Galway City | 10 | 4 | 6 |
| Galway County | 8 | 1 | 7 |
| Leitrim | 4 | 1 | 3 |
| Mayo | 13 | 2 | 11 |
| Roscommon | 11 | 5 | 6 |
| Sligo | 11 | 4 | 7 |
| Ulster | 23 | 7 | 16 |
| Cavan | 4 | 1 | 3 |
| Donegal | 15 | 4 | 11 |
| Monaghan | 4 | 2 | 2 |
| REGIONAL AUTHORITIES: | |||
| Border | 38 | 12 | 26 |
| Midland | 16 | 8 | 8 |
| West | 42 | 12 | 30 |
| Dublin | 164 | 67 | 97 |
| Mid-East | 53 | 19 | 34 |
| Mid-West | 43 | 14 | 29 |
| South-East | 31 | 12 | 19 |
| South-West | 86 | 35 | 51 |
| 1 From January 1st 2019 these figures include ICD 10 codes F01 and F03 | |||
| Table 19 Alzheimer's deaths registered by county of residence of deceased, October - December 2019 | |||
| Area of residence | Total | Male | Female |
| State | 126 | 43 | 83 |
| Leinster | 56 | 18 | 38 |
| Carlow | 1 | – | 1 |
| Dublin City | 10 | 3 | 7 |
| South Dublin | 5 | 3 | 2 |
| Fingal | 7 | 1 | 6 |
| Dún Laoghaire Rathdown | 5 | 4 | 1 |
| Kildare | 8 | 3 | 5 |
| Kilkenny | 1 | – | 1 |
| Laois | 2 | – | 2 |
| Longford | – | – | – |
| Louth | 6 | 1 | 5 |
| Meath | 5 | – | 5 |
| Offaly | 1 | 1 | – |
| Westmeath | 2 | 1 | 1 |
| Wexford | 1 | – | 1 |
| Wicklow | 2 | 1 | 1 |
| Munster | 40 | 13 | 27 |
| Clare | 1 | 1 | – |
| Cork City | 3 | 1 | 2 |
| Cork County | 14 | 5 | 9 |
| Kerry | 9 | 3 | 6 |
| Limerick City | – | – | – |
| Limerick County | 4 | – | 4 |
| Tipperary | 5 | 1 | 4 |
| Waterford City | 1 | – | 1 |
| Waterford County | 3 | 2 | 1 |
| Connacht | 18 | 6 | 12 |
| Galway City | 1 | – | 1 |
| Galway County | 6 | 1 | 5 |
| Leitrim | 2 | 1 | 1 |
| Mayo | 4 | 2 | 2 |
| Roscommon | 1 | – | 1 |
| Sligo | 4 | 2 | 2 |
| Ulster | 12 | 6 | 6 |
| Cavan | 3 | 3 | – |
| Donegal | 7 | 3 | 4 |
| Monaghan | 2 | – | 2 |
| REGIONAL AUTHORITIES: | |||
| Border | 18 | 9 | 9 |
| Midland | 5 | 2 | 3 |
| West | 12 | 3 | 9 |
| Dublin | 27 | 11 | 16 |
| Mid-East | 21 | 5 | 16 |
| Mid-West | 10 | 2 | 8 |
| South-East | 7 | 2 | 5 |
| South-West | 26 | 9 | 17 |
This report has been prepared by the Central Statistics Office for the Minister for Employment Affairs and Social Protection in accordance with the provisions of Section 2 of the Vital Statistics and Births, Deaths and Marriages Registration Act, 1952 and Government Order SI 831 of 2007.
All figures in this report are classified by quarter of registration and are provisional.
The Underlying Cause of Death is classified according to the World Health Organisation's International Classification of Diseases, Version 10 (ICD-10), see link below:
https://icd.who.int/browse10/2016/en
All deaths registered in the quarter have been included in the statistics and some cases have been assigned a provisional cause of death pending the outcome of further enquiries.
Caution should be exercised if directly comparing these mortality statistics with those of previous quarters as this data is provisional and subject to change. Final data is published in our annual reports and is based on the date the death occurred while the quarterly releases are based on the date the death was registered.
Refers to the number of previous live births excluding any not stated.
From January 2018 onwards where births take place within the State and the area of residence of the mother is outside the State, the area of residence of the mother is recorded as outside the State. Prior to this, births where the mother was residing outside the State were assigned to the location where the birth took place within the State.
From the 1st January 2018 an Amendment of the EU NUTS legislation came into effect. This reflects the new regional assembly structure and the other changes to the Local Government Act for Tipperary North, Tipperary South and Limerick and Waterford City and County Councils. The composition of the new Regions breakdown is outlined below.
Up to December 2017 regional classifications were based on the NUTS (Nomenclature of Territorial Units) classification used by Eurostat. The NUTS3 regions corresponded to eight Regional Authorities established under the Local Government Act, 1991 (Regional Authorities) (Establishment) Order, 1993, which came into operation on 1 January 1994. The NUTS2 regions, which were proposed by Government and agreed by Eurostat in 1999, are groupings of the NUTS3 regions. The composition of the regions is set out below.
| Border | Cavan | Dublin | Dublin City | |
| Donegal | Dún Laoghaire-Rathdown | |||
| Leitrim | Fingal | |||
| Monaghan | South Dublin | |||
| Sligo | ||||
| Mid-East | Kildare | |||
| Midland | Laois | Louth | ||
| Longford | Meath | |||
| Offaly | Wicklow | |||
| Westmeath | ||||
| Mid-West | Clare | |||
| West | Galway City | Limerick City and County | ||
| Galway County | Tipperary | |||
| Mayo | ||||
| Roscommon | South-East | Carlow | ||
| Kilkenny | ||||
| South West | Cork City | Waterford City and County | ||
| Cork County | Wexford | |||
| Kerry |
EU 15
Austria, Belgium, Denmark, Finland, France, Germany, Greece, Ireland, Italy, Luxembourg, The Netherlands, Portugal, Spain, Sweden, United Kingdom.
EU 16-28
Bulgaria, Croatia, Cyprus, Czech Republic, Estonia, Hungary, Latvia, Lithuania, Malta, Poland, Romania, Slovakia, Slovenia.
Croatia is included in EU 16 to EU28 from quarter 3 2013.
Civil Partnership legislation was introduced in Ireland on the 1st January, 2011. From 16th November 2015, when same-sex marriages legislation came into effect, same-sex couples no longer had the option to apply for a Civil Partnership. However, couples that had given the required 3 months' notice of a Civil Partnership prior to 16th November 2015 were still entitled to have a Civil Partnership ceremony after that date.
The Marriage Act 2015 (No. 35/2015) effective from the 16th November 2015 (S.I. 504/2015) refers, allows parties of the same sex to marry.
Rates for quarter 4 2019, were calculated using the relevant population data in April 2019.
For the purpose of this release the population concept of usual residence has been used, i.e. all persons usually resident and present in the State on census night, plus absent persons who are usually resident in Ireland, but are temporarily away from home and outside the State on Census night. All persons are classified according to the region of their usual residence.
Rates for Births, Deaths and Marriages were revised in quarter 4 2017 for intercensal years 2012 to 2015, based on revised estimated usual residence population data. Rates for 2016 were also revised based on updated Census of Population usual residence population figures.
|
From the 1st January 2018 the CSO is using new automated software called IRIS for selecting the underlying cause of death code. The coding system has been developed and is maintained by the IRIS core group to code mortality data and is the preferred coding tool for European countries. See link to IRIS home page: https://www.dimdi.de/dynamic/en/classifications/iris-institute/index.html |
 Hide Background Notes
Scan the QR code below to view this release online or go to
http://www.cso.ie/en/releasesandpublications/ep/p-vs/vitalstatisticsfourthquarter2019/
 Hide Table 1 Births classified by age of mother at maternity by quarter, 2014, 2018 and 2019 and their corresponding annual age specific (asfr) and total period fertility rates (tpfr)