
This release was compiled during the COVID-19 pandemic. For further information see Information Note - Impact of COVID-19 on Vital Statistics Quarter 1 2020
| Quarter 1 2021 | Quarter 1 2020 | |
| Births | 13,895 | 14,371 |
| Deaths | 9,564 | 8,674 |
| Marriages | 2,265 | 2,886 |
| Natural increase | 4,331 | 5,697 |
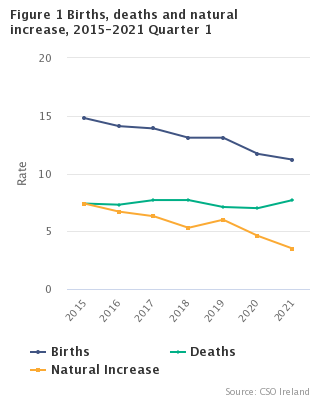
There were 13,895 births in quarter 1 2021, 476 births or 3.3% less than the same period in 2020. This corresponds to a birth rate of 11.2 per 1,000 population, a decrease of 0.5 points per thousand population from quarter 1 2020.
There were 9,564 deaths in quarter 1 2021, an increase of 10.3% (or 890 deaths) from quarter 1 2020. This equates to a death rate of 7.7 per 1,000 population, an increase of 0.7 points from quarter 1 2020.
There were 37 infant deaths registered in quarter 1 2021 giving an infant mortality rate of 2.7 per 1,000 live births.
The number of births less the number of deaths in quarter 1 2021 resulted in a natural increase of population of 4,331 persons.
Births
There were 7,008 male births and 6,887 female births in quarter 1 2021. The 13,895 births represent an annual birth rate of 11.2 per thousand population. A decrease of 0.5 in the rate recorded in quarter 1 2020. See tables 4 and 5.
Age of mothers
The average age of first time mothers was 31.4, the same age as recorded for the same period in the previous year. The average age of all mothers at maternity for births registered in quarter 1 2021 was 33.1 years, which is also the same age as recorded in quarter 1 2020. The average age of first time mothers outside marriage/civil partnership was 29.6, while the average age of all mothers outside marriage/civil partnership was 30.9 years. In the same quarter in 2020, the average age of mothers having their first baby outside marriage/civil partnership was 29.4 years while it was 30.7 years for all mothers for births registered outside of marriage/civil partnership. See tables 9 and 10.
Births and marriage/civil partnerships
In quarter 1 2021 there were 8,329 (59.9%) births registered as within marriage/civil partnership.
There were 5,566 births registered as outside marriage/civil partnership accounting for 40.1% of all births in quarter 1 2021. The highest percentage of births outside marriage/civil partnership was in Limerick City at 57.7% and the lowest was in Dún Laoghaire-Rathdown with 23.6%. In the same quarter in 2020, there were 5,497 births registered as outside marriage/civil partnership accounting for 38.3% of all births. See table 8.
Location of births
The highest number of births registered was in Dublin City with 1,360 (9.8% of total live births in the country) followed by Cork County with 1,218 (8.8%) registered births. Longford had the lowest number with 117 (0.8%) registered births in quarter 1 2021. The highest number of births registered in quarter 1 2020 was in Dublin City which accounted for 1,585 or 11.0% of births followed by Cork County with 1,270 (8.8%). Leitrim had the lowest number, 96 births (0.7%), registered in quarter 1 2020. See table 8.
Area of residence of mother
From January 2018 onwards where births take place within the State and the mother is residing outside the State, the area of residence of the mother is recorded as outside the State. Prior to quarter 1, 2018, cases where the mother was residing outside the State, the mother's area of residence was assigned to the location where the birth took place within the State.
There were 12 babies born to mothers who were resident outside the Republic of Ireland in quarter 1 2021. This accounts for 0.09% of total live births registered in the quarter. See tables 5, 8, 9 and 10.
Nationality of mothers
Of the 13,895 births in quarter 1 2021, there were 10,971 babies (79.0%) born to mothers of Irish nationality compared to 11,101 (77.2%) in quarter 1 2020. See table 11.
Birth order
A total of 5,212 births (37.5%) were to first time mothers in quarter 1 2021 while 4,901 (35.3%) were to second time mothers. These accounted for a total of 72.8% of births of stated parity in quarter 1 2021. See table 6 and figure 2.
| For long labels below use to display on multiple lines | Birth Order Q1 2021 (%) |
|---|---|
| 1st | 37.5098956459158 |
| 2nd | 35.2716804605973 |
| 3rd | 17.8625404821878 |
| 4th | 6.03814321698453 |
| 5th and over | 3.3177401943145 |
Deaths
There were 9,564 deaths registered in quarter 1 2021, of these 4,981 were male and 4,583 were female. The quarter 1 2021 total is almost 10.3% more than the corresponding quarter of 2020 when 8,674 deaths were registered. See table 12.
Infant and neonatal mortality
There were 37 infant deaths registered in quarter 1 2021 giving an infant mortality rate of 2.7 deaths per 1,000 live births, a decrease of 0.2 points on that recorded in quarter 1 of 2020. Neonatal deaths are deaths of infants at ages under 4 weeks. There were 30 neonatal deaths registered in quarter 1 2021, giving a neonatal mortality rate of 2.2 deaths per 1,000 live births, which was equivalent to the quarter 1 2020 rate. See tables 3, 4 and figure 3.
| Under 1 yr rates | infant | neonatal |
|---|---|---|
| Q1 2018 | 3.5 | 2.8 |
| Q2 2018 | 3 | 2.2 |
| Q3 2018 | 2.9 | 2 |
| Q4 2018 | 2.8 | 2.1 |
| Q1 2019 | 3.3 | 2.6 |
| Q2 2019 | 3.3 | 2.4 |
| Q3 2019 | 3 | 2.3 |
| Q4 2019 | 3.1 | 2.4 |
| Q1 2020 | 2.9 | 2.2 |
| Q2 2020 | 2.7 | 1.8 |
| Q3 2020 | 2.5 | 1.7 |
| Q4 2020 | 2.9 | 2.2 |
| Q1 2021 | 2.7 | 2.2 |
Cause of death
Diseases of the circulatory system:
Diseases of the circulatory system accounted for 2,345 deaths, or an annual rate of 1.9 per 1,000 population. Of these, 1,123 were due to ischaemic heart disease and 418 to cerebrovascular disease. See tables 2a, 2b, 13, 14 and figure 4.
Malignant neoplasms (Cancer):
There were 2,414 deaths from malignant neoplasms. This is equivalent to an annual rate of 1.9 per 1,000 population. See tables 2a, 2b, 13, 14, 15 and 16.
Diseases of the respiratory system:
Deaths from chronic lower respiratory disease numbered 376, pneumonia accounted for 193 deaths and 231 deaths resulted from all other respiratory diseases. See tables 2a, 2b, 13, 14, 15 and 16.
Accidents, suicides and other:
There were 185 deaths due to accidents, suicides and other external causes. Accidents accounted for 78.9% (146) of these deaths while suicides accounted for 19.5% (36). This figure of 36 reflects a decrease of 50.0% from the same quarter of 2020. Of these suicide deaths, 80.6% (29) were male. See tables 2a, 2b, 13, 14, 15 and 16.
Deaths assigned an Underlying Cause of Death of External causes of injury and poisoning (including deaths from road traffic accidents and deaths from intentional self-harm), are likely to be underrepresented as such deaths are reported to the Coroner’s Office for further investigation. This can then result in such deaths being registered late (more than three months after the date of occurrence) and therefore have not yet been reported to the CSO. In addition, public hearings in the Coroner's Court have also been limited as a consequence of the restrictions imposed due to the COVID-19 pandemic and this may also have resulted in deaths being registered late.
Dementia and Alzheimer's:
In Quarter 1 2021 there were 454 deaths due to dementia of which 283 (or 62.3%) were female. There were 142 deaths due to Alzheimer's of which 96 (or 67.6%) were female. See tables 18 and 19.
COVID-19
There were 1,846 deaths due to COVID-19 recorded in quarter 1 2021, 995 of which were male and 851 which were female. Of these, 1,438 (77.9%) were aged 75 and over.
There were 1,835 of these COVID-19 deaths where the virus was identified while there were 11 deaths where the virus was not identified. See tables 20, 21 and WHO ICD-10 classification of COVID-19 link
It is important to note that there will be a number of deaths where COVID-19 will not be assigned as the Underlying Cause of Death (UCOD) and therefore, the COVID-19 deaths in this analysis, will vary from those put into the public domain by the Department of Health. This is because the figures published in the Vital Statistics quarterly releases are based on the narrative of cause of death that is reported, in electronic format, on the death certificate once the death is registered with the General Registration Office (GRO) and subsequently forwarded to the CSO for processing. All deaths that are registered are assigned an Underlying Cause of Death in line with the World Health Organization (WHO) International Statistical Classification of Diseases and Related Health Problems (ICD-10). This UCOD is assigned using the WHO selection rules and is dependent on the hierarchy of diseases or conditions and their placement on the medical death certificate. There are also instances where COVID-19 is mentioned in the narrative of the death certificate but where the UCOD is not COVID-19.
The mean average age of death was 81.7 years while the median age was 83.4 years for all deaths due to COVID-19 in quarter 1 2021.
| For long labels below use to display on multiple lines | Principal causes of death Q1 2021 (%) |
|---|---|
| Circulatory | 24.5 |
| External causes | 1.9 |
| COVID-19 | 19.3 |
| Respiratory | 8.4 |
| Malignant Cancer | 25.2 |
| Remainder | 20.6 |
Age at death
The leading cause of death in quarter 1 2021 varied widely by age-group. For those aged from 15 to 34 years, external causes of death including accidents, suicide and other ranked first (24 deaths). Among individuals aged 35-74, malignant neoplasms (cancer) was the leading cause (1,148), while for those aged 75 and older, it was diseases of the circulatory system (1,740 deaths). See table 14.
There were 8,185 deaths of persons aged 65 and over registered in quarter 1 2021. This represents an annual death rate of 45.5 per 1,000 population aged 65 and over and represents an increase of 3.3 when compared with the corresponding quarter of 2020. See tables 3, 4 and figure 5.
The average (mean) time-lag between the date of death and the registration of death was 49 days while the median (mid-point in data) was 30 days for quarter 1 2021.
Natural Increase
The natural increase in the population (births minus deaths) for quarter 1 2021 was 4,331. This represents a rate of 3.5 per 1,000 population, 1.1 less than quarter 1 2020. See tables 3, 4 and figure 1.
Marriages
The number of marriages registered during the quarter was 2,265 of which 79 were same-sex marriages. This is equivalent to an annual marriage rate of 1.8 per 1,000 population, a decrease of 0.5 from quarter 1 2020. See tables 3 and 4.
Same-sex marriage legislation came into effect on the 16th November 2015.
Population
The estimated population (usual residence) in April 2020 was 4,977,443.
| X-axis label | Cancer | Disease of the circulatory system | Disease of the respiratory system | COVID-19 | Accident, suicide, homicide and undetermined | Other |
|---|---|---|---|---|---|---|
| Under 15 | 6.12244897959184 | 2.04081632653061 | 0 | 0 | 2.04081632653061 | 89.7959183673469 |
| 15-34 | 19.4444444444444 | 13.8888888888889 | 2.77777777777778 | 9.72222222222222 | 33.3333333333333 | 20.8333333333333 |
| 35-74 | 39.6819910127895 | 20.532319391635 | 6.01451780159004 | 13.8610438990667 | 3.07639128931905 | 16.8337366055997 |
| 75 and over | 19.0687022900763 | 26.5648854961832 | 9.52671755725191 | 21.9541984732824 | 1.08396946564885 | 21.8015267175573 |
| Table 1 Births classified by age of mother at maternity by quarter, 2016, 2020 and 2021 and their corresponding annual age specific (asfr) and total period fertility rates (tpfr) | |||||||||||||||
| Q1 2016 | Q1 2020 | Q4 2020 | Q1 2021 | ||||||||||||
| % of | Fertility | % of | Fertility | % of | Fertility | % of | Fertility | ||||||||
| Age of mother | Number | total | rate | Number | total | rate | Number | total | rate | Number | total | rate | |||
| < 20 years | 318 | 1.9 | 9.3 | 221 | 1.5 | 5.6 | 184 | 1.4 | 4.6 | 179 | 1.3 | 4.5 | |||
| 20-24 years | 1,413 | 8.6 | 49.6 | 1085 | 7.5 | 29.6 | 1,001 | 7.4 | 26.5 | 1,008 | 7.3 | 26.7 | |||
| 25-29 years | 2,940 | 17.8 | 78.5 | 2405 | 16.7 | 66.8 | 2,166 | 15.9 | 59.9 | 2,263 | 16.3 | 62.5 | |||
| 30-34 years | 5,850 | 35.5 | 122.5 | 4950 | 34.4 | 115.8 | 4,663 | 34.3 | 112.0 | 4,960 | 35.7 | 119.2 | |||
| 35-39 years | 4,801 | 29.1 | 101.1 | 4497 | 31.3 | 87.7 | 4,420 | 32.5 | 88.4 | 4,385 | 31.6 | 87.7 | |||
| 40-44 years | 1,097 | 6.7 | 24.8 | 1116 | 7.8 | 23.2 | 1,064 | 7.8 | 21.3 | 1,059 | 7.6 | 21.2 | |||
| 45+ years | 61 | 0.4 | 1.5 | 97 | 0.7 | 2.2 | 86 | 0.6 | 1.9 | 41 | 0.3 | 0.9 | |||
| Not stated | – | – | – | – | – | – | – | – | – | – | – | – | |||
| Total | 16,480 | 100.0 | 1.9 | 14,371 | 100.0 | 1.7 | 13,584 | 100.0 | 1.6 | 13,895 | 100.0 | 1.6 | |||
| Table 2a Deaths registered by cause of death and by quarter, 2016, 2020 and 2021 | |||||||||||||||||
| Malignant Cancers | % of total | Diseases of the heart and arteries | % of total | Lung diseases | % of total | Accidents, Suicides & Others | % of total | Other Causes | % of total | Total | % of total | ||||||
| Q1 2021 | 2,414 | 25.2 | 2,345 | 24.5 | 800 | 8.4 | 185 | 1.9 | 3,820 | 39.9 | 9,564 | 100.0 | |||||
| Q4 2020 | 2,231 | 30.2 | 2,046 | 27.7 | 658 | 8.9 | 517 | 7.0 | 1,946 | 26.3 | 7,398 | 100.0 | |||||
| Q1 2020 | 2,483 | 28.6 | 2,489 | 28.7 | 1,288 | 14.8 | 258 | 3.0 | 2,156 | 24.9 | 8,674 | 100.0 | |||||
| Q1 2016 | 2,356 | 27.4 | 2,657 | 30.9 | 1,266 | 14.7 | 277 | 3.2 | 2,053 | 23.8 | 8,609 | 100.0 | |||||
| Table 2b Deaths registered by cause of death and age group, First Quarter 2021 | ||||||||||||
| Malignant Cancers | % of total | Diseases of the heart and arteries | % of total | Lung diseases | % of total | Accidents, Suicides & Others | % of total | Other Causes | % of total | Total | % of total | |
| Persons | ||||||||||||
| Under 1 | – | 0.0 | – | 0.0 | – | 0.0 | – | 0.0 | 37 | 1.0 | 37 | 0.4 |
| 1–4 | 1 | 0.0 | – | 0.0 | – | 0.0 | – | 0.0 | 2 | 0.1 | 3 | 0.0 |
| 5–14 | 2 | 0.1 | 1 | 0.0 | – | 0.0 | 1 | 0.5 | 5 | 0.1 | 9 | 0.1 |
| 15–24 | 4 | 0.2 | 2 | 0.1 | – | 0.0 | 10 | 5.4 | 4 | 0.1 | 20 | 0.2 |
| 25–34 | 10 | 0.4 | 8 | 0.3 | 2 | 0.3 | 14 | 7.6 | 18 | 0.5 | 52 | 0.5 |
| 35–44 | 44 | 1.8 | 28 | 1.2 | 4 | 0.5 | 30 | 16.2 | 45 | 1.2 | 151 | 1.6 |
| 45–54 | 139 | 5.8 | 79 | 3.4 | 10 | 1.3 | 22 | 11.9 | 95 | 2.5 | 345 | 3.6 |
| 55–64 | 344 | 14.3 | 161 | 6.9 | 32 | 4.0 | 18 | 9.7 | 207 | 5.4 | 762 | 8.0 |
| 65–74 | 621 | 25.7 | 326 | 13.9 | 128 | 16.0 | 19 | 10.3 | 541 | 14.2 | 1,635 | 17.1 |
| 75–84 | 770 | 31.9 | 646 | 27.5 | 284 | 35.5 | 26 | 14.1 | 1,205 | 31.5 | 2,931 | 30.6 |
| 85 + | 479 | 19.8 | 1,094 | 46.7 | 340 | 42.5 | 45 | 24.3 | 1,661 | 43.5 | 3,619 | 37.8 |
| Total | 2,414 | 100.0 | 2,345 | 100.0 | 800 | 100.0 | 185 | 100.0 | 3,820 | 100.0 | 9,564 | 100.0 |
| Males | ||||||||||||
| Under 1 | – | 0.0 | – | 0.0 | – | 0.0 | – | 0.0 | 16 | 0.4 | 16 | 0.2 |
| 1–4 | 1 | 0.0 | – | 0.0 | – | 0.0 | – | 0.0 | 1 | 0.0 | 2 | 0.0 |
| 5–14 | 1 | 0.0 | 1 | 0.0 | – | 0.0 | – | 0.0 | 3 | 0.1 | 5 | 0.1 |
| 15–24 | 2 | 0.1 | 2 | 0.1 | – | 0.0 | 8 | 4.3 | 2 | 0.1 | 14 | 0.1 |
| 25–34 | 8 | 0.3 | 8 | 0.3 | 2 | 0.3 | 10 | 5.4 | 13 | 0.3 | 41 | 0.4 |
| 35–44 | 19 | 0.8 | 20 | 0.9 | 2 | 0.3 | 27 | 14.6 | 27 | 0.7 | 95 | 1.0 |
| 45–54 | 57 | 2.4 | 65 | 2.8 | 8 | 1.0 | 18 | 9.7 | 56 | 1.5 | 204 | 2.1 |
| 55–64 | 173 | 7.2 | 115 | 4.9 | 18 | 2.3 | 12 | 6.5 | 114 | 3.0 | 432 | 4.5 |
| 65–74 | 347 | 14.4 | 225 | 9.6 | 66 | 8.3 | 14 | 7.6 | 342 | 9.0 | 994 | 10.4 |
| 75–84 | 438 | 18.1 | 381 | 16.2 | 152 | 19.0 | 15 | 8.1 | 709 | 18.6 | 1,695 | 17.7 |
| 85 + | 246 | 10.2 | 403 | 17.2 | 159 | 19.9 | 23 | 12.4 | 652 | 17.1 | 1,483 | 15.5 |
| Total | 1,292 | 53.5 | 1,220 | 52.0 | 407 | 50.9 | 127 | 68.6 | 1,935 | 50.7 | 4,981 | 52.1 |
| Females | ||||||||||||
| Under 1 | – | 0.0 | – | 0.0 | – | 0.0 | – | 0.0 | 21 | 0.5 | 21 | 0.2 |
| 1–4 | – | 0.0 | – | 0.0 | – | 0.0 | – | 0.0 | 1 | 0.0 | 1 | 0.0 |
| 5–14 | 1 | 0.0 | – | 0.0 | – | 0.0 | 1 | 0.5 | 2 | 0.1 | 4 | 0.0 |
| 15–24 | 2 | 0.1 | – | 0.0 | – | 0.0 | 2 | 1.1 | 2 | 0.1 | 6 | 0.1 |
| 25–34 | 2 | 0.1 | – | 0.0 | – | 0.0 | 4 | 2.2 | 5 | 0.1 | 11 | 0.1 |
| 35–44 | 25 | 1.0 | 8 | 0.3 | 2 | 0.3 | 3 | 1.6 | 18 | 0.5 | 56 | 0.6 |
| 45–54 | 82 | 3.4 | 14 | 0.6 | 2 | 0.3 | 4 | 2.2 | 39 | 1.0 | 141 | 1.5 |
| 55–64 | 171 | 7.1 | 46 | 2.0 | 14 | 1.8 | 6 | 3.2 | 93 | 2.4 | 330 | 3.5 |
| 65–74 | 274 | 11.4 | 101 | 4.3 | 62 | 7.8 | 5 | 2.7 | 199 | 5.2 | 641 | 6.7 |
| 75–84 | 332 | 13.8 | 265 | 11.3 | 132 | 16.5 | 11 | 5.9 | 496 | 13.0 | 1,236 | 12.9 |
| 85 + | 233 | 9.7 | 691 | 29.5 | 181 | 22.6 | 22 | 11.9 | 1,009 | 26.4 | 2,136 | 22.3 |
| Total | 1,122 | 46.5 | 1,125 | 48.0 | 393 | 49.1 | 58 | 31.4 | 1,885 | 49.3 | 4,583 | 47.9 |
| Table 3 Marriages, civil partnerships, births, deaths and natural increase | ||||||||||||||
| Marriages1 | Live Births | Deaths | ||||||||||||
| Total | Opposite-sex | Same-sex | Civil Partnerships | Total | First | Outside marriage/civil partnerships | Average Age | Total | Infant 2 | Neonatal 3 | 65 & over | Natural Increase | ||
| Quarter 1 | ||||||||||||||
| 2016 | 3,503 | 3,320 | 183 | 7 | 16,480 | 6,245 | 6,037 | 32.7 | 8,609 | 63 | 45 | 7,141 | 7,871 | |
| 2017 | 3,459 | 3,329 | 130 | – | 16,487 | 6,181 | 6,229 | 32.8 | 9,067 | 40 | 32 | 7,716 | 7,420 | |
| 2018 | 3,339 | 3,240 | 99 | – | 15,659 | 6,077 | 5,919 | 32.9 | 9,278 | 55 | 44 | 7,869 | 6,381 | |
| 2019 | 3,185 | 3,075 | 110 | – | 15,893 | 6,043 | 6,046 | 33.0 | 8,618 | 52 | 41 | 7,197 | 7,275 | |
| 2020 | 2,878 | 2,763 | 115 | – | 14,371 | 5,673 | 5,497 | 33.1 | 8,674 | 42 | 31 | 7,346 | 5,697 | |
| 2021 | 2,265 | 2,186 | 79 | – | 13,895 | 5,212 | 5,566 | 33.1 | 9,564 | 37 | 30 | 8,185 | 4,331 | |
| Quarter 2 | ||||||||||||||
| 2016 | 5,659 | 5,369 | 290 | – | 16,219 | 5,898 | 5,806 | 32.7 | 7,697 | 48 | 36 | 6,296 | 8,522 | |
| 2017 | 5,597 | 5,422 | 175 | – | 15,222 | 5,734 | 5,675 | 32.8 | 7,315 | 46 | 37 | 5,931 | 7,907 | |
| 2018 | 5,386 | 5,218 | 168 | – | 15,419 | 5,929 | 5,912 | 32.9 | 7,592 | 47 | 34 | 6,296 | 7,827 | |
| 2019 | 5,204 | 5,064 | 140 | – | 14,389 | 5,471 | 5,457 | 33.0 | 7,519 | 48 | 34 | 6,135 | 6,870 | |
| 2020 | 303 | 298 | 5 | – | 13,527 | 5,351 | 5,114 | 33.1 | 8,582 | 36 | 25 | 7,295 | 4,945 | |
| 2021 | ||||||||||||||
| Quarter 3 | ||||||||||||||
| 2016 | 8,391 | 8,038 | 353 | – | 16,458 | 6,218 | 6,056 | 32.6 | 7,129 | 49 | 38 | 5,717 | 9,329 | |
| 2017 | 7,916 | 7,644 | 272 | – | 15,635 | 5,962 | 5,902 | 32.7 | 6,987 | 49 | 41 | 5,640 | 8,648 | |
| 2018 | 7,423 | 7,181 | 242 | – | 15,428 | 5,794 | 5,811 | 32.9 | 7,143 | 45 | 31 | 5,771 | 8,285 | |
| 2019 | 7,328 | 7,095 | 233 | – | 15,379 | 5,975 | 6,017 | 32.9 | 7,358 | 46 | 35 | 5,962 | 8,021 | |
| 2020 | 3,079 | 2,977 | 102 | – | 14,477 | 5,606 | 5,689 | 33.0 | 7,111 | 36 | 25 | 5,822 | 7,366 | |
| 2021 | ||||||||||||||
| Quarter 4 | ||||||||||||||
| 2016 | 5,073 | 4,843 | 230 | – | 14,740 | 5,681 | 5,449 | 32.9 | 6,955 | 48 | 36 | 5,642 | 7,785 | |
| 2017 | 5,049 | 4,867 | 182 | – | 14,709 | 5,650 | 5,534 | 32.9 | 7,115 | 39 | 28 | 5,739 | 7,594 | |
| 2018 | 4,905 | 4,750 | 155 | – | 14,510 | 5,708 | 5,419 | 33.0 | 7,103 | 40 | 30 | 5,697 | 7,407 | |
| 2019 | 4,596 | 4,439 | 157 | – | 14,135 | 5,650 | 5,252 | 33.2 | 7,639 | 44 | 34 | 6,144 | 6,496 | |
| 2020 | 3,263 | 3,171 | 92 | – | 13,584 | 5,359 | 5,178 | 33.3 | 7,398 | 39 | 30 | 5,977 | 6,186 | |
| 2021 | ||||||||||||||
| Total | ||||||||||||||
| 2016 | 22,626 | 21,570 | 1,056 | 7 | 63,897 | 24,042 | 23,348 | 32.7 | 30,390 | 208 | 155 | 24,796 | 33,507 | |
| 2017 | 22,021 | 21,262 | 759 | – | 62,053 | 23,527 | 23,340 | 32.8 | 30,484 | 174 | 138 | 25,026 | 31,569 | |
| 2018 | 21,053 | 20,389 | 664 | – | 61,016 | 23,508 | 23,061 | 32.9 | 31,116 | 187 | 139 | 25,633 | 29,900 | |
| 2019 | 20,313 | 19,673 | 640 | – | 59,796 | 23,139 | 22,772 | 33.0 | 31,134 | 190 | 144 | 25,438 | 28,662 | |
| 2020 | 9,523 | 9,209 | 314 | – | 55,959 | 21,989 | 21,478 | 33.1 | 31,765 | 153 | 111 | 26,440 | 24,194 | |
| 2021 | ||||||||||||||
| 1 2016 to 2020 Marriage & Civil Partnership figures are final and by month of registration. | ||||||||||||||
| 2 Infant death: Death at ages under 1 year of live born infant. | ||||||||||||||
| 3 Neonatal death: Death at ages under 4 weeks of live born infant. | ||||||||||||||
| Table 4 Annual marriage, civil partnership, birth, death and natural increase rates per 1,000 population1 | |||||||||||||
| Marriages5 | Live Births | Deaths | |||||||||||
| Total | Opposite-sex | Same-sex | Civil Partnerships5 | Total | % First births 2 | % Outside marriage/civil partnerships | Total | Infant 3 Mortality | Neo-natal4 Mortality | 65 & over | Natural Increase | ||
| Quarter 1 | |||||||||||||
| 2016 | 3.0 | 2.8 | 0.2 | 0.01 | 14.1 | 37.9 | 36.6 | 7.3 | 3.8 | 2.7 | 46.8 | 6.7 | |
| 2017 | 2.9 | 2.8 | 0.1 | – | 13.9 | 37.5 | 37.8 | 7.7 | 2.4 | 1.9 | 49.0 | 6.3 | |
| 2018 | 2.7 | 2.7 | 0.1 | – | 13.1 | 38.8 | 37.8 | 7.7 | 3.5 | 2.8 | 48.4 | 5.3 | |
| 2019 | 2.6 | 2.5 | 0.1 | – | 13.1 | 38.0 | 38.0 | 7.1 | 3.3 | 2.6 | 42.8 | 6.0 | |
| 2020 | 2.3 | 2.3 | 0.1 | – | 11.7 | 39.5 | 38.3 | 7.0 | 2.9 | 2.2 | 42.2 | 4.6 | |
| 2021 | 1.8 | 1.8 | 0.1 | – | 11.2 | 37.5 | 40.1 | 7.7 | 2.7 | 2.2 | 45.5 | 3.5 | |
| Quarter 2 | |||||||||||||
| 2016 | 4.8 | 4.5 | 0.2 | – | 13.7 | 36.4 | 35.8 | 6.5 | 3.0 | 2.2 | 40.0 | 7.2 | |
| 2017 | 4.7 | 4.5 | 0.1 | – | 12.7 | 37.7 | 37.3 | 6.1 | 3.0 | 2.4 | 36.5 | 6.6 | |
| 2018 | 4.4 | 4.3 | 0.1 | – | 12.7 | 38.5 | 38.3 | 6.3 | 3.0 | 2.2 | 37.2 | 6.4 | |
| 2019 | 4.2 | 4.1 | 0.1 | – | 11.7 | 38.0 | 37.9 | 6.1 | 3.3 | 2.4 | 35.2 | 5.6 | |
| 2020 | 0.2 | 0.2 | 0.0 | – | 10.9 | 39.6 | 37.8 | 6.9 | 2.7 | 1.8 | 40.5 | 4.0 | |
| 2021 | |||||||||||||
| Quarter 3 | |||||||||||||
| 2016 | 7.1 | 6.8 | 0.3 | – | 13.9 | 37.8 | 36.8 | 6.0 | 3.0 | 2.3 | 36.3 | 7.9 | |
| 2017 | 6.6 | 6.4 | 0.2 | – | 13.0 | 38.1 | 37.7 | 5.8 | 3.1 | 2.6 | 34.7 | 7.2 | |
| 2018 | 6.1 | 5.9 | 0.2 | – | 12.7 | 37.6 | 37.7 | 5.9 | 2.9 | 2.0 | 34.3 | 6.8 | |
| 2019 | 6.0 | 5.8 | 0.2 | – | 12.5 | 38.9 | 39.1 | 6.0 | 3.0 | 2.3 | 34.3 | 6.5 | |
| 2020 | 2.5 | 2.4 | 0.1 | – | 11.6 | 38.7 | 39.3 | 5.7 | 2.5 | 1.7 | 32.3 | 5.9 | |
| 2021 | |||||||||||||
| Quarter 4 | |||||||||||||
| 2016 | 4.3 | 4.1 | 0.2 | – | 12.4 | 38.5 | 37.0 | 5.9 | 3.3 | 2.4 | 35.8 | 6.6 | |
| 2017 | 4.2 | 4.1 | 0.2 | – | 12.3 | 38.4 | 37.6 | 5.9 | 2.7 | 1.9 | 35.3 | 6.3 | |
| 2018 | 4.0 | 3.9 | 0.1 | – | 11.9 | 39.3 | 37.3 | 5.8 | 2.8 | 2.1 | 33.8 | 6.1 | |
| 2019 | 3.7 | 3.6 | 0.1 | – | 11.5 | 40.0 | 37.2 | 6.2 | 3.1 | 2.4 | 35.3 | 5.3 | |
| 2020 | 2.6 | 2.5 | 0.1 | – | 10.9 | 39.5 | 38.1 | 5.9 | 2.9 | 2.2 | 33.2 | 5.0 | |
| 2021 | |||||||||||||
| Total | |||||||||||||
| 2016 | 4.8 | 4.6 | 0.2 | – | 13.5 | 37.6 | 36.5 | 6.4 | 3.3 | 2.4 | 39.4 | 7.1 | |
| 2017 | 4.6 | 4.4 | 0.2 | – | 12.9 | 37.9 | 37.6 | 6.4 | 2.8 | 2.2 | 38.5 | 6.6 | |
| 2018 | 4.3 | 4.2 | 0.1 | – | 12.6 | 38.5 | 37.8 | 6.4 | 3.1 | 2.3 | 38.1 | 6.2 | |
| 2019 | 4.1 | 4.0 | 0.1 | – | 12.1 | 38.7 | 38.1 | 6.3 | 3.2 | 2.4 | 36.5 | 5.8 | |
| 2020 | 1.9 | 1.9 | 0.1 | – | 11.2 | 39.3 | 38.4 | 6.4 | 2.7 | 2.0 | 36.7 | 4.9 | |
| 2021 | |||||||||||||
| 1 Rates are calculated using the Usual Residence population figures. | |||||||||||||
| 2 First births divided by the total number of live births (excluding those with unstated parity), multiplied by 100. | |||||||||||||
| 3 Infant mortality is the number of infant deaths per 1,000 live births. | |||||||||||||
| 4 Neonatal mortality is the number of neonatal (infants aged under 4 weeks) deaths per 1,000 live births. | |||||||||||||
| 5 2016 to 2020 Marriage & Civil Partnership rates are by month of registration and are final. | |||||||||||||
| Table 5 Births registered, classified by area of residence of mother, January - March 2021 | ||||
| Area of residence | Total | Male | Female | Rate1 |
| State | 13,895 | 7,008 | 6,887 | 11.2 |
| Leinster | 7,595 | 3,875 | 3,720 | 11.0 |
| Carlow | 193 | 100 | 93 | 13.0 |
| Dublin City | 1,360 | 695 | 665 | 9.5 |
| South Dublin | 790 | 399 | 391 | 11.0 |
| Fingal | 824 | 406 | 418 | 10.4 |
| Dún Laoghaire-Rathdown | 522 | 268 | 254 | 8.6 |
| Kildare | 683 | 325 | 358 | 11.5 |
| Kilkenny | 319 | 170 | 149 | 12.4 |
| Laois | 273 | 164 | 109 | 12.4 |
| Longford | 117 | 49 | 68 | 11.0 |
| Louth | 402 | 201 | 201 | 11.9 |
| Meath | 682 | 373 | 309 | 13.0 |
| Offaly | 230 | 119 | 111 | 11.3 |
| Westmeath | 324 | 157 | 167 | 14.1 |
| Wexford | 477 | 243 | 234 | 12.2 |
| Wicklow | 399 | 206 | 193 | 10.5 |
| Munster | 3,716 | 1,837 | 1,879 | 11.2 |
| Clare | 310 | 164 | 146 | 10.1 |
| Cork City | 295 | 142 | 153 | 9.4 |
| Cork County | 1,218 | 589 | 629 | 11.1 |
| Kerry | 419 | 217 | 202 | 11.0 |
| Limerick City | 196 | 96 | 100 | 13.4 |
| Limerick County | 442 | 224 | 218 | 12.5 |
| Tipperary | 496 | 234 | 262 | 11.9 |
| Waterford City | 160 | 81 | 79 | 13.0 |
| Waterford County | 180 | 90 | 90 | 10.1 |
| Connacht | 1,659 | 815 | 844 | 11.6 |
| Galway City | 201 | 90 | 111 | 10.5 |
| Galway County | 607 | 289 | 318 | 12.9 |
| Leitrim | 118 | 57 | 61 | 14.2 |
| Mayo | 377 | 201 | 176 | 11.1 |
| Roscommon | 179 | 85 | 94 | 10.5 |
| Sligo | 177 | 93 | 84 | 10.5 |
| Ulster (Part of) | 913 | 478 | 435 | 11.9 |
| Cavan | 237 | 126 | 111 | 12.1 |
| Donegal | 484 | 243 | 241 | 11.7 |
| Monaghan | 192 | 109 | 83 | 12.0 |
| Regional Authorities: | ||||
| Border | 1,208 | 628 | 580 | 11.8 |
| Midland | 944 | 489 | 455 | 12.4 |
| West | 1,364 | 665 | 699 | 11.6 |
| Dublin | 3,496 | 1,768 | 1,728 | 9.9 |
| Mid-East | 2,166 | 1,105 | 1,061 | 11.8 |
| Mid-West | 1,444 | 718 | 726 | 11.8 |
| South-East | 1,329 | 684 | 645 | 12.1 |
| South-West | 1,932 | 948 | 984 | 10.8 |
| Mother Residing Outside the State | 12 | 3 | 9 | – |
| 1 Births per year per 1,000 population. Annual rates based on estimated usual residence 2020 population. | ||||
| Table 6 Births registered, classified by age of mother and previous number of liveborn children, January – March 2021 | |||||||
| Previous number of liveborn children | |||||||
| Age of mother at maternity | Total | 0 | 1 | 2 | 3 | 4 | 5 or more |
| All ages | 13,895 | 5,212 | 4,901 | 2,482 | 839 | 269 | 192 |
| 15 and under | 3 | 3 | – | – | – | – | – |
| 16 | 5 | 5 | – | – | – | – | – |
| 17 | 23 | 23 | – | – | – | – | – |
| 18 | 43 | 36 | 7 | – | – | – | – |
| 19 | 105 | 84 | 19 | 2 | – | – | – |
| Under 20 | 179 | 151 | 26 | 2 | – | – | – |
| 20 | 146 | 106 | 28 | 10 | 1 | 1 | – |
| 21 | 157 | 108 | 34 | 11 | 3 | 1 | – |
| 22 | 201 | 121 | 62 | 13 | 3 | 2 | – |
| 23 | 263 | 155 | 77 | 21 | 8 | 2 | – |
| 24 | 241 | 129 | 73 | 33 | 4 | 1 | 1 |
| 20–24 | 1,008 | 619 | 274 | 88 | 19 | 7 | 1 |
| 25 | 333 | 177 | 114 | 29 | 9 | 4 | – |
| 26 | 366 | 156 | 131 | 52 | 15 | 8 | 4 |
| 27 | 420 | 186 | 148 | 57 | 23 | 4 | 2 |
| 28 | 516 | 246 | 156 | 66 | 36 | 6 | 6 |
| 29 | 628 | 269 | 225 | 87 | 27 | 14 | 6 |
| 25–29 | 2,263 | 1,034 | 774 | 291 | 110 | 36 | 18 |
| 30 | 770 | 362 | 243 | 115 | 34 | 12 | 4 |
| 31 | 927 | 441 | 296 | 121 | 47 | 14 | 8 |
| 32 | 992 | 442 | 347 | 129 | 47 | 18 | 9 |
| 33 | 1,104 | 429 | 428 | 159 | 61 | 17 | 10 |
| 34 | 1,167 | 399 | 488 | 199 | 53 | 14 | 14 |
| 30–34 | 4,960 | 2,073 | 1,802 | 723 | 242 | 75 | 45 |
| 35 | 1,141 | 360 | 438 | 230 | 72 | 19 | 22 |
| 36 | 990 | 260 | 365 | 259 | 66 | 24 | 16 |
| 37 | 889 | 197 | 351 | 244 | 63 | 15 | 19 |
| 38 | 754 | 150 | 271 | 220 | 77 | 23 | 13 |
| 39 | 611 | 126 | 219 | 165 | 62 | 21 | 18 |
| 35–39 | 4,385 | 1,093 | 1,644 | 1,118 | 340 | 102 | 88 |
| 40 | 469 | 98 | 160 | 109 | 64 | 29 | 9 |
| 41 | 296 | 64 | 104 | 79 | 30 | 6 | 13 |
| 42 | 156 | 34 | 57 | 35 | 16 | 4 | 10 |
| 43 | 93 | 22 | 31 | 20 | 11 | 6 | 3 |
| 44 | 45 | 11 | 17 | 10 | 2 | 2 | 3 |
| 40–44 | 1,059 | 229 | 369 | 253 | 123 | 47 | 38 |
| 45 and over | 41 | 13 | 12 | 7 | 5 | 2 | 2 |
| Table 7 Number and percentage of births registered within and outside marriage/civil partnership, classified by age of mother, January - March 2021 | |||||||
| Number | Percentage of total births | ||||||
| Age of mother at maternity | Total | Married/Civil partnership parents | Unmarried/non-Civil partnership parents | Married/Civil partnership parents | Unmarried/non-Civil partnership parents | ||
| Total | Same address | Total | Same address | ||||
| All ages | 13,895 | 8,329 | 5,566 | 3,546 | 59.9 | 40.1 | 25.5 |
| 15 and under | 3 | – | 3 | – | – | 100.0 | – |
| 16 | 5 | – | 5 | 3 | – | 100.0 | 60.0 |
| 17 | 23 | 3 | 20 | 4 | 13.0 | 87.0 | 17.4 |
| 18 | 43 | 7 | 36 | 14 | 16.3 | 83.7 | 32.6 |
| 19 | 105 | 20 | 85 | 30 | 19.0 | 81.0 | 28.6 |
| Under 20 | 179 | 30 | 149 | 51 | 16.8 | 83.2 | 28.5 |
| 20 | 146 | 25 | 121 | 39 | 17.1 | 82.9 | 26.7 |
| 21 | 157 | 22 | 135 | 46 | 14.0 | 86.0 | 29.3 |
| 22 | 201 | 36 | 165 | 52 | 17.9 | 82.1 | 25.9 |
| 23 | 263 | 62 | 201 | 83 | 23.6 | 76.4 | 31.6 |
| 24 | 241 | 55 | 186 | 97 | 22.8 | 77.2 | 40.2 |
| 20-24 | 1,008 | 200 | 808 | 317 | 19.8 | 80.2 | 31.4 |
| 25 | 333 | 82 | 251 | 130 | 24.6 | 75.4 | 39.0 |
| 26 | 366 | 99 | 267 | 146 | 27.0 | 73.0 | 39.9 |
| 27 | 420 | 143 | 277 | 154 | 34.0 | 66.0 | 36.7 |
| 28 | 516 | 187 | 329 | 207 | 36.2 | 63.8 | 40.1 |
| 29 | 628 | 282 | 346 | 224 | 44.9 | 55.1 | 35.7 |
| 25-29 | 2,263 | 793 | 1,470 | 861 | 35.0 | 65.0 | 38.0 |
| 30 | 770 | 411 | 359 | 244 | 53.4 | 46.6 | 31.7 |
| 31 | 927 | 556 | 371 | 256 | 60.0 | 40.0 | 27.6 |
| 32 | 992 | 655 | 337 | 249 | 66.0 | 34.0 | 25.1 |
| 33 | 1,104 | 766 | 338 | 235 | 69.4 | 30.6 | 21.3 |
| 34 | 1,167 | 862 | 305 | 237 | 73.9 | 26.1 | 20.3 |
| 30-34 | 4,960 | 3,250 | 1,710 | 1,221 | 65.5 | 34.5 | 24.6 |
| 35 | 1,141 | 854 | 287 | 230 | 74.8 | 25.2 | 20.2 |
| 36 | 990 | 754 | 236 | 191 | 76.2 | 23.8 | 19.3 |
| 37 | 889 | 662 | 227 | 166 | 74.5 | 25.5 | 18.7 |
| 38 | 754 | 547 | 207 | 147 | 72.5 | 27.5 | 19.5 |
| 39 | 611 | 445 | 166 | 127 | 72.8 | 27.2 | 20.8 |
| 35-39 | 4,385 | 3,262 | 1,123 | 861 | 74.4 | 25.6 | 19.6 |
| 40 | 469 | 354 | 115 | 89 | 75.5 | 24.5 | 19.0 |
| 41 | 296 | 199 | 97 | 77 | 67.2 | 32.8 | 26.0 |
| 42 | 156 | 115 | 41 | 32 | 73.7 | 26.3 | 20.5 |
| 43 | 93 | 67 | 26 | 22 | 72.0 | 28.0 | 23.7 |
| 44 | 45 | 30 | 15 | 10 | 66.7 | 33.3 | 22.2 |
| 40-44 | 1,059 | 765 | 294 | 230 | 72.2 | 27.8 | 21.7 |
| 45 and over | 41 | 29 | 12 | 5 | 70.7 | 29.3 | 12.2 |
| Table 8 Number and percentage of births registered within and outside marriage/civil partnership, classified by area of residence of mother, January - March 2021 | |||||||
| Number | Percentage of total births | ||||||
| Area of residence | Total | Married/Civil partnership parents | Unmarried/non-Civil partnership parents | Married/Civil partnership parents | Unmarried/non-Civil partnership parents | ||
| Total | Same address | Total | Same address | ||||
| State | 13,895 | 8,329 | 5,566 | 3,546 | 59.9 | 40.1 | 25.5 |
| Leinster | 7,595 | 4,478 | 3,117 | 1,886 | 59.0 | 41.0 | 24.8 |
| Carlow | 193 | 101 | 92 | 58 | 52.3 | 47.7 | 30.1 |
| Dublin City | 1,360 | 734 | 626 | 330 | 54.0 | 46.0 | 24.3 |
| South Dublin | 790 | 448 | 342 | 204 | 56.7 | 43.3 | 25.8 |
| Fingal | 824 | 503 | 321 | 203 | 61.0 | 39.0 | 24.6 |
| Dún Laoghaire-Rathdown | 522 | 399 | 123 | 82 | 76.4 | 23.6 | 15.7 |
| Kildare | 683 | 419 | 264 | 164 | 61.3 | 38.7 | 24.0 |
| Kilkenny | 319 | 215 | 104 | 60 | 67.4 | 32.6 | 18.8 |
| Laois | 273 | 152 | 121 | 86 | 55.7 | 44.3 | 31.5 |
| Longford | 117 | 71 | 46 | 27 | 60.7 | 39.3 | 23.1 |
| Louth | 402 | 200 | 202 | 122 | 49.8 | 50.2 | 30.3 |
| Meath | 682 | 435 | 247 | 180 | 63.8 | 36.2 | 26.4 |
| Offaly | 230 | 138 | 92 | 61 | 60.0 | 40.0 | 26.5 |
| Westmeath | 324 | 197 | 127 | 71 | 60.8 | 39.2 | 21.9 |
| Wexford | 477 | 254 | 223 | 131 | 53.2 | 46.8 | 27.5 |
| Wicklow | 399 | 212 | 187 | 107 | 53.1 | 46.9 | 26.8 |
| Munster | 3,716 | 2,203 | 1,513 | 1,004 | 59.3 | 40.7 | 27.0 |
| Clare | 310 | 174 | 136 | 99 | 56.1 | 43.9 | 31.9 |
| Cork City | 295 | 155 | 140 | 88 | 52.5 | 47.5 | 29.8 |
| Cork County | 1,218 | 794 | 424 | 312 | 65.2 | 34.8 | 25.6 |
| Kerry | 419 | 235 | 184 | 126 | 56.1 | 43.9 | 30.1 |
| Limerick City | 196 | 83 | 113 | 43 | 42.3 | 57.7 | 21.9 |
| Limerick County | 442 | 285 | 157 | 108 | 64.5 | 35.5 | 24.4 |
| Tipperary | 496 | 287 | 209 | 133 | 57.9 | 42.1 | 26.8 |
| Waterford City | 160 | 81 | 79 | 40 | 50.6 | 49.4 | 25.0 |
| Waterford County | 180 | 109 | 71 | 55 | 60.6 | 39.4 | 30.6 |
| Connacht | 1,659 | 1,084 | 575 | 421 | 65.3 | 34.7 | 25.4 |
| Galway City | 201 | 140 | 61 | 47 | 69.7 | 30.3 | 23.4 |
| Galway County | 607 | 415 | 192 | 131 | 68.4 | 31.6 | 21.6 |
| Leitrim | 118 | 72 | 46 | 39 | 61.0 | 39.0 | 33.1 |
| Mayo | 377 | 239 | 138 | 99 | 63.4 | 36.6 | 26.3 |
| Roscommon | 179 | 106 | 73 | 59 | 59.2 | 40.8 | 33.0 |
| Sligo | 177 | 112 | 65 | 46 | 63.3 | 36.7 | 26.0 |
| Ulster (Part of) | 913 | 561 | 352 | 229 | 61.4 | 38.6 | 25.1 |
| Cavan | 237 | 151 | 86 | 65 | 63.7 | 36.3 | 27.4 |
| Donegal | 484 | 275 | 209 | 121 | 56.8 | 43.2 | 25.0 |
| Monaghan | 192 | 135 | 57 | 43 | 70.3 | 29.7 | 22.4 |
| Regional Authorities: | |||||||
| Border | 1,208 | 745 | 463 | 314 | 61.7 | 38.3 | 26.0 |
| Midland | 944 | 558 | 386 | 245 | 59.1 | 40.9 | 26.0 |
| West | 1,364 | 900 | 464 | 336 | 66.0 | 34.0 | 24.6 |
| Dublin | 3,496 | 2,084 | 1,412 | 819 | 59.6 | 40.4 | 23.4 |
| Mid-East | 2,166 | 1,266 | 900 | 573 | 58.4 | 41.6 | 26.5 |
| Mid-West | 1,444 | 829 | 615 | 383 | 57.4 | 42.6 | 26.5 |
| South-East | 1,329 | 760 | 569 | 344 | 57.2 | 42.8 | 25.9 |
| South-West | 1,932 | 1,184 | 748 | 526 | 61.3 | 38.7 | 27.2 |
| Mother Residing Outside the State | 12 | 3 | 9 | 6 | 25.0 | 75.0 | 50.0 |
| Table 9 Births registered, classified by area of residence and age of mother, January - March 2021 | |||||||||
| Average age of mother at maternity | |||||||||
| Area of residence | Total | Under 20 | 20-24 | 25-29 | 30-34 | 35-39 | 40 and over | All births | First births |
| State | 13,895 | 179 | 1,008 | 2,263 | 4,960 | 4,385 | 1,100 | 33.1 | 31.4 |
| Leinster | 7,595 | 115 | 572 | 1,256 | 2,716 | 2,345 | 591 | 33.0 | 31.3 |
| Carlow | 193 | 5 | 23 | 33 | 65 | 54 | 13 | 32.2 | 29.9 |
| Dublin City | 1,360 | 24 | 109 | 218 | 494 | 402 | 113 | 32.9 | 31.7 |
| South Dublin | 790 | 15 | 80 | 123 | 295 | 231 | 46 | 32.5 | 30.6 |
| Fingal | 824 | 15 | 59 | 138 | 289 | 239 | 84 | 33.2 | 31.1 |
| Dún Laoghaire-Rathdown | 522 | 2 | 15 | 47 | 171 | 225 | 62 | 34.9 | 33.3 |
| Kildare | 683 | 10 | 42 | 110 | 251 | 219 | 51 | 33.3 | 31.8 |
| Kilkenny | 319 | 6 | 24 | 36 | 109 | 118 | 26 | 33.5 | 31.1 |
| Laois | 273 | 7 | 18 | 56 | 90 | 92 | 10 | 32.6 | 30.4 |
| Longford | 117 | 2 | 15 | 29 | 31 | 34 | 6 | 31.7 | 28.9 |
| Louth | 402 | 8 | 31 | 81 | 137 | 115 | 30 | 32.6 | 30.3 |
| Meath | 682 | 6 | 43 | 115 | 262 | 204 | 52 | 33.1 | 31.7 |
| Offaly | 230 | 2 | 21 | 37 | 90 | 70 | 10 | 32.7 | 30.6 |
| Westmeath | 324 | 4 | 25 | 66 | 118 | 89 | 22 | 32.6 | 30.6 |
| Wexford | 477 | 5 | 38 | 96 | 179 | 126 | 33 | 32.6 | 30.9 |
| Wicklow | 399 | 4 | 29 | 71 | 135 | 127 | 33 | 33.1 | 31.3 |
| Munster | 3,716 | 45 | 269 | 613 | 1,302 | 1,203 | 284 | 33.2 | 31.3 |
| Clare | 310 | 4 | 27 | 53 | 107 | 90 | 29 | 33.0 | 31.4 |
| Cork City | 295 | 7 | 23 | 42 | 104 | 99 | 20 | 32.9 | 30.8 |
| Cork County | 1,218 | 8 | 63 | 165 | 429 | 466 | 87 | 33.9 | 32.3 |
| Kerry | 419 | 2 | 33 | 64 | 152 | 123 | 45 | 33.5 | 31.4 |
| Limerick City | 196 | 5 | 25 | 55 | 61 | 39 | 11 | 30.9 | 28.8 |
| Limerick County | 442 | 7 | 37 | 79 | 146 | 135 | 38 | 32.9 | 30.6 |
| Tipperary | 496 | 8 | 41 | 92 | 179 | 147 | 29 | 32.6 | 30.4 |
| Waterford City | 160 | 3 | 12 | 34 | 57 | 41 | 13 | 32.4 | 29.9 |
| Waterford County | 180 | 1 | 8 | 29 | 67 | 63 | 12 | 33.6 | 32.3 |
| Connacht | 1,659 | 10 | 98 | 227 | 604 | 556 | 164 | 33.8 | 32.1 |
| Galway City | 201 | 2 | 18 | 28 | 60 | 69 | 24 | 33.7 | 32.7 |
| Galway County | 607 | 5 | 25 | 71 | 223 | 228 | 55 | 34.2 | 32.8 |
| Leitrim | 118 | – | 4 | 16 | 56 | 31 | 11 | 33.7 | 31.4 |
| Mayo | 377 | – | 30 | 54 | 129 | 125 | 39 | 33.6 | 31.9 |
| Roscommon | 179 | 3 | 10 | 35 | 67 | 49 | 15 | 32.8 | 31.3 |
| Sligo | 177 | – | 11 | 23 | 69 | 54 | 20 | 33.8 | 31.2 |
| Ulster (Part of) | 913 | 9 | 65 | 167 | 332 | 279 | 61 | 32.9 | 30.9 |
| Cavan | 237 | 2 | 13 | 41 | 76 | 85 | 20 | 33.6 | 32.4 |
| Donegal | 484 | 5 | 39 | 97 | 174 | 143 | 26 | 32.6 | 30.3 |
| Monaghan | 192 | 2 | 13 | 29 | 82 | 51 | 15 | 32.9 | 30.4 |
| Regional Authorities: | |||||||||
| Border | 1,208 | 9 | 80 | 206 | 457 | 364 | 92 | 33.1 | 31.0 |
| Midland | 944 | 15 | 79 | 188 | 329 | 285 | 48 | 32.5 | 30.4 |
| West | 1,364 | 10 | 83 | 188 | 479 | 471 | 133 | 33.8 | 32.3 |
| Dublin | 3,496 | 56 | 263 | 526 | 1,249 | 1,097 | 305 | 33.2 | 31.6 |
| Mid-East | 2,166 | 28 | 145 | 377 | 785 | 665 | 166 | 33.1 | 31.4 |
| Mid-West | 1,444 | 24 | 130 | 279 | 493 | 411 | 107 | 32.6 | 30.4 |
| South-East | 1,329 | 20 | 105 | 228 | 477 | 402 | 97 | 32.9 | 30.9 |
| South-West | 1,932 | 17 | 119 | 271 | 685 | 688 | 152 | 33.7 | 31.9 |
| Mother Residing Outside the State | 12 | – | 4 | – | 6 | 2 | – | 31.6 | 31.0 |
| Table 10 Births registered outside marriage/civil partnership, classified by area of residence and age of mother, January - March 2021 | ||||||||
| Average age of mother at maternity | ||||||||
| Area of residence | Total | Under 25 | 25-29 | 30-34 | 35-39 | 40 and over | All births | First births |
| State | 5,566 | 957 | 1,470 | 1,710 | 1,123 | 306 | 30.9 | 29.6 |
| Leinster | 3,117 | 557 | 805 | 965 | 605 | 185 | 30.8 | 29.6 |
| Carlow | 92 | 24 | 24 | 26 | 16 | 2 | 29.6 | 28.6 |
| Dublin City | 626 | 109 | 148 | 198 | 124 | 47 | 31.1 | 30.1 |
| South Dublin | 342 | 79 | 77 | 112 | 63 | 11 | 30.1 | 28.7 |
| Fingal | 321 | 50 | 78 | 87 | 77 | 29 | 31.6 | 30.0 |
| Dún Laoghaire-Rathdown | 123 | 16 | 23 | 34 | 40 | 10 | 32.5 | 32.4 |
| Kildare | 264 | 43 | 74 | 87 | 45 | 15 | 30.7 | 29.2 |
| Kilkenny | 104 | 27 | 19 | 37 | 16 | 5 | 29.9 | 28.4 |
| Laois | 121 | 22 | 37 | 35 | 24 | 3 | 30.3 | 28.0 |
| Longford | 46 | 13 | 18 | 9 | 4 | 2 | 28.7 | 28.0 |
| Louth | 202 | 36 | 53 | 63 | 35 | 15 | 30.7 | 28.0 |
| Meath | 247 | 35 | 61 | 79 | 59 | 13 | 31.6 | 31.1 |
| Offaly | 92 | 15 | 26 | 38 | 10 | 3 | 30.2 | 28.9 |
| Westmeath | 127 | 21 | 44 | 38 | 19 | 5 | 30.0 | 28.8 |
| Wexford | 223 | 38 | 72 | 69 | 33 | 11 | 30.3 | 29.2 |
| Wicklow | 187 | 29 | 51 | 53 | 40 | 14 | 31.2 | 29.6 |
| Munster | 1,513 | 251 | 429 | 453 | 311 | 69 | 30.8 | 29.3 |
| Clare | 136 | 25 | 37 | 38 | 27 | 9 | 30.8 | 30.0 |
| Cork City | 140 | 23 | 33 | 48 | 32 | 4 | 31.0 | 28.9 |
| Cork County | 424 | 60 | 112 | 131 | 102 | 19 | 31.4 | 30.3 |
| Kerry | 184 | 29 | 45 | 66 | 29 | 15 | 31.3 | 29.8 |
| Limerick City | 113 | 25 | 43 | 30 | 13 | 2 | 29.0 | 26.7 |
| Limerick County | 157 | 30 | 49 | 39 | 32 | 7 | 30.5 | 28.7 |
| Tipperary | 209 | 37 | 60 | 63 | 45 | 4 | 30.4 | 28.8 |
| Waterford City | 79 | 14 | 26 | 17 | 16 | 6 | 30.3 | 27.3 |
| Waterford County | 71 | 8 | 24 | 21 | 15 | 3 | 31.2 | 30.4 |
| Connacht | 575 | 82 | 133 | 189 | 133 | 38 | 31.6 | 30.7 |
| Galway City | 61 | 12 | 13 | 13 | 16 | 7 | 32.1 | 31.6 |
| Galway County | 192 | 20 | 41 | 68 | 51 | 12 | 32.3 | 32.0 |
| Leitrim | 46 | 4 | 9 | 20 | 10 | 3 | 32.3 | 29.9 |
| Mayo | 138 | 24 | 36 | 40 | 30 | 8 | 31.1 | 30.2 |
| Roscommon | 73 | 11 | 21 | 25 | 10 | 6 | 30.6 | 29.5 |
| Sligo | 65 | 11 | 13 | 23 | 16 | 2 | 31.3 | 28.7 |
| Ulster (Part of) | 352 | 63 | 103 | 99 | 73 | 14 | 30.5 | 29.1 |
| Cavan | 86 | 12 | 26 | 23 | 22 | 3 | 31.1 | 30.8 |
| Donegal | 209 | 39 | 61 | 58 | 43 | 8 | 30.5 | 28.7 |
| Monaghan | 57 | 12 | 16 | 18 | 8 | 3 | 29.8 | 27.4 |
| Regional Authorities: | ||||||||
| Border | 463 | 78 | 125 | 142 | 99 | 19 | 30.8 | 29.1 |
| Midland | 386 | 71 | 125 | 120 | 57 | 13 | 30.0 | 28.5 |
| West | 464 | 67 | 111 | 146 | 107 | 33 | 31.6 | 31.1 |
| Dublin | 1,412 | 254 | 326 | 431 | 304 | 97 | 31.1 | 30.0 |
| Mid-East | 900 | 143 | 239 | 282 | 179 | 57 | 31.1 | 29.6 |
| Mid-West | 615 | 117 | 189 | 170 | 117 | 22 | 30.3 | 28.7 |
| South-East | 569 | 111 | 165 | 170 | 96 | 27 | 30.2 | 28.9 |
| South-West | 748 | 112 | 190 | 245 | 163 | 38 | 31.3 | 29.9 |
| Mother Residing Outside the State | 9 | 4 | – | 4 | 1 | – | 30.3 | 27.4 |
| Table 11 Births registered, classified by nationality of mother, marital status and age, January - March 2021 | ||||||||||
| Total births | Births inside marriage/civil partnership | Births outside marriage/civil partnership | Average age of mother at maternity | |||||||
| Nationality of mother | Number | Percentage | Number | Percentage | Number | Percentage | ||||
| TOTAL | 13,895 | 100.0 | 8,329 | 59.9 | 5,566 | 40.1 | 33.1 | |||
| Ireland | 10,971 | 79.0 | 6,457 | 58.9 | 4,514 | 41.1 | 33.4 | |||
| United Kingdom | 274 | 2.0 | 132 | 48.2 | 142 | 51.8 | 31.9 | |||
| EU14 excl. Irl | 255 | 1.8 | 149 | 58.4 | 106 | 41.6 | 34.5 | |||
| EU15 to EU 272 | 1,176 | 8.5 | 611 | 52.0 | 565 | 48.0 | 31.6 | |||
| Other 1 | 1,208 | 8.7 | 972 | 80.5 | 236 | 19.5 | 32.3 | |||
| Not stated | 11 | 0.1 | 8 | 72.7 | 3 | 27.3 | 34.2 | |||
| 1 Countries excluding Ireland, UK and the EU. | ||||||||||
| 2 The UK left the EU on 31 January 2020 so is excluded as part of EU from Quarter 2 2020. | ||||||||||
| Table 12 Deaths registered by county of residence of deceased, January - March 2021 | ||||
| Area of residence | Total | Male | Female | Rate1 |
| State | 9,564 | 4,981 | 4,583 | 7.7 |
| Leinster | 4,745 | 2,404 | 2,341 | 6.8 |
| Carlow | 131 | 66 | 65 | 8.8 |
| Dublin City | 1,179 | 545 | 634 | 8.3 |
| South Dublin | 367 | 209 | 158 | 5.1 |
| Fingal | 333 | 188 | 145 | 4.2 |
| Dún Laoghaire-Rathdown | 418 | 204 | 214 | 6.9 |
| Kildare | 299 | 146 | 153 | 5.1 |
| Kilkenny | 229 | 122 | 107 | 8.9 |
| Laois | 164 | 77 | 87 | 7.4 |
| Longford | 101 | 51 | 50 | 9.5 |
| Louth | 284 | 144 | 140 | 8.4 |
| Meath | 296 | 171 | 125 | 5.7 |
| Offaly | 147 | 72 | 75 | 7.2 |
| Westmeath | 157 | 71 | 86 | 6.8 |
| Wexford | 388 | 205 | 183 | 9.9 |
| Wicklow | 252 | 133 | 119 | 6.6 |
| Munster | 2,973 | 1,543 | 1,430 | 9.0 |
| Clare | 275 | 149 | 126 | 9.0 |
| Cork City | 406 | 212 | 194 | 13.0 |
| Cork County | 835 | 408 | 427 | 7.6 |
| Kerry | 314 | 157 | 157 | 8.2 |
| Limerick City | 166 | 89 | 77 | 11.4 |
| Limerick County | 296 | 160 | 136 | 8.4 |
| Tipperary | 385 | 217 | 168 | 9.3 |
| Waterford City | 134 | 67 | 67 | 10.9 |
| Waterford County | 162 | 84 | 78 | 9.1 |
| Connacht | 1,168 | 657 | 511 | 8.2 |
| Galway City | 90 | 50 | 40 | 4.7 |
| Galway County | 350 | 189 | 161 | 7.4 |
| Leitrim | 67 | 31 | 36 | 8.1 |
| Mayo | 352 | 209 | 143 | 10.3 |
| Roscommon | 171 | 103 | 68 | 10.0 |
| Sligo | 138 | 75 | 63 | 8.2 |
| Ulster | 678 | 377 | 301 | 8.8 |
| Cavan | 179 | 104 | 75 | 9.2 |
| Donegal | 354 | 182 | 172 | 8.6 |
| Monaghan | 145 | 91 | 54 | 9.1 |
| Regional Authorities: | ||||
| Border | 883 | 483 | 400 | 8.7 |
| Midland | 569 | 271 | 298 | 7.5 |
| West | 963 | 551 | 412 | 8.2 |
| Dublin | 2,297 | 1,146 | 1,151 | 6.5 |
| Mid-East | 1,131 | 594 | 537 | 6.2 |
| Mid-West | 1,122 | 615 | 507 | 9.2 |
| South-East | 1,044 | 544 | 500 | 9.5 |
| South-West | 1,555 | 777 | 778 | 8.7 |
| 1 Deaths per year per 1,000 population. Annual rates based on estimated 2020 Usual residence population. | ||||
| Table 13 Deaths registered by cause of death and county of residence of deceased, January - March 2021 | ||||||
| Area of residence | Total Deaths | Malignant Neoplasms | Diseases of the Circulatory system | Diseases of the Respiratory system | External causes | All other causes |
| State | 9,564 | 2,414 | 2,345 | 800 | 185 | 3,820 |
| Leinster | 4,745 | 1,177 | 1,124 | 425 | 69 | 1,950 |
| Carlow | 131 | 30 | 26 | 12 | 5 | 58 |
| Dublin City | 1,179 | 272 | 293 | 99 | 22 | 493 |
| South Dublin | 367 | 99 | 83 | 30 | 9 | 146 |
| Fingal | 333 | 97 | 69 | 29 | 2 | 136 |
| Dún Laoghaire-Rathdown | 418 | 99 | 103 | 34 | 6 | 176 |
| Kildare | 299 | 86 | 65 | 28 | – | 120 |
| Kilkenny | 229 | 61 | 56 | 21 | 2 | 89 |
| Laois | 164 | 26 | 42 | 15 | 2 | 79 |
| Longford | 101 | 27 | 28 | 12 | 2 | 32 |
| Louth | 284 | 61 | 55 | 26 | 3 | 139 |
| Meath | 296 | 80 | 74 | 31 | 3 | 108 |
| Offaly | 147 | 45 | 33 | 10 | 3 | 56 |
| Westmeath | 157 | 42 | 39 | 19 | 2 | 55 |
| Wexford | 388 | 94 | 101 | 36 | 5 | 152 |
| Wicklow | 252 | 58 | 57 | 23 | 3 | 111 |
| Munster | 2,973 | 744 | 763 | 216 | 73 | 1,177 |
| Clare | 275 | 77 | 76 | 17 | 1 | 104 |
| Cork City | 406 | 87 | 83 | 31 | 16 | 189 |
| Cork County | 835 | 201 | 234 | 58 | 13 | 329 |
| Kerry | 314 | 97 | 83 | 26 | 8 | 100 |
| Limerick City | 166 | 32 | 42 | 15 | 3 | 74 |
| Limerick County | 296 | 67 | 74 | 19 | 4 | 132 |
| Tipperary | 385 | 105 | 109 | 34 | 19 | 118 |
| Waterford City | 134 | 33 | 21 | 9 | 3 | 68 |
| Waterford County | 162 | 45 | 41 | 7 | 6 | 63 |
| Connacht | 1,168 | 312 | 279 | 97 | 22 | 458 |
| Galway City | 90 | 26 | 22 | 5 | 2 | 35 |
| Galway County | 350 | 91 | 78 | 30 | 3 | 148 |
| Leitrim | 67 | 18 | 9 | 14 | 2 | 24 |
| Mayo | 352 | 92 | 77 | 24 | 5 | 154 |
| Roscommon | 171 | 45 | 50 | 13 | 3 | 60 |
| Sligo | 138 | 40 | 43 | 11 | 7 | 37 |
| Ulster (part of) | 678 | 181 | 179 | 62 | 21 | 235 |
| Cavan | 179 | 45 | 34 | 20 | 13 | 67 |
| Donegal | 354 | 98 | 99 | 30 | 4 | 123 |
| Monaghan | 145 | 38 | 46 | 12 | 4 | 45 |
| Regional Authorities: | ||||||
| Border | 883 | 239 | 231 | 87 | 30 | 296 |
| Midland | 569 | 140 | 142 | 56 | 9 | 222 |
| West | 963 | 254 | 227 | 72 | 13 | 397 |
| Dublin | 2,297 | 567 | 548 | 192 | 39 | 951 |
| Mid-East | 1,131 | 285 | 251 | 108 | 9 | 478 |
| Mid-West | 1,122 | 281 | 301 | 85 | 27 | 428 |
| South-East | 1,044 | 263 | 245 | 85 | 21 | 430 |
| South-West | 1,555 | 385 | 400 | 115 | 37 | 618 |
| Table 14 Deaths registered classified by cause of death and age group, January - March 2021 | ||||||||||||||
| Age Group | ||||||||||||||
| Cause of Death | 65 COD | ICD-10 | Total | Under 1 | 1-4 | 5-14 | 15-24 | 25-34 | 35-44 | 45-54 | 55-64 | 65-74 | 75-84 | 85 and |
| Code | Code | Deaths | over | |||||||||||
| Total deaths | 0 | A00-Y89 | 9,564 | 37 | 3 | 9 | 20 | 52 | 151 | 345 | 762 | 1,635 | 2,931 | 3,619 |
| Infectious and parasitic diseases:- | 1 | A00-B99 | 67 | – | – | – | – | – | 5 | 2 | 7 | 9 | 16 | 28 |
| Tuberculosis | 2 | A15-A19,B90 | 3 | – | – | – | – | – | – | – | – | 1 | – | 2 |
| Meningococcal infection | 3 | A39 | – | – | – | – | – | – | – | – | – | – | – | – |
| AIDS (HIV Disease) | 4 | B20-B24 | 3 | – | – | – | – | – | – | 1 | 2 | – | – | – |
| Viral Hepatitis | 5 | B15-B19 | 3 | – | – | – | – | – | 2 | – | 1 | – | – | – |
| Other infectious and parasitic diseases | 58 | – | – | – | – | – | 3 | 1 | 4 | 8 | 16 | 26 | ||
| Neoplasms | 6 | C00-D48 | 2,484 | – | 1 | 2 | 4 | 10 | 47 | 143 | 348 | 631 | 795 | 503 |
| Malignant neoplasms of the:- | 7 | C00-C97 | 2,414 | – | 1 | 2 | 4 | 10 | 44 | 139 | 344 | 621 | 770 | 479 |
| Lip, oral cavity, pharynx | 8 | C00-C14 | 57 | – | – | – | – | – | – | 2 | 13 | 19 | 17 | 6 |
| Oesophagus | 9 | C15 | 106 | – | – | – | – | 3 | 2 | 6 | 17 | 34 | 28 | 16 |
| Stomach | 10 | C16 | 61 | – | – | – | – | – | 1 | 2 | 10 | 12 | 24 | 12 |
| Colon | 11 | C18 | 114 | – | – | – | – | – | 1 | 10 | 13 | 22 | 40 | 28 |
| Rectum and anus | 12 | C19-C21 | 154 | – | – | – | – | 2 | 6 | 5 | 17 | 34 | 57 | 33 |
| Liver and the intrahepatic bile ducts | 13 | C22 | 110 | – | – | – | – | – | 3 | 3 | 13 | 32 | 42 | 17 |
| Pancreas | 14 | C25 | 126 | – | – | – | – | – | 2 | 5 | 17 | 30 | 44 | 28 |
| Larynx and trachea/bronchus /lung | 15 | C32-C34 | 501 | – | – | – | – | – | 6 | 19 | 85 | 173 | 152 | 66 |
| Skin | 16 | C43 | 39 | – | – | – | – | – | 2 | 3 | 8 | 9 | 9 | 8 |
| Breast | 17 | C50 | 174 | – | – | – | – | 1 | 7 | 28 | 29 | 38 | 36 | 35 |
| Cervix uteri | 18 | C53 | 20 | – | – | – | – | – | 1 | 7 | 6 | 3 | 2 | 1 |
| Other parts of uterus | 19 | C54-C55 | 24 | – | – | – | – | – | – | 1 | 2 | 5 | 12 | 4 |
| Ovary | 20 | C56 | 96 | – | – | – | – | – | 2 | 10 | 16 | 34 | 25 | 9 |
| Prostate | 21 | C61 | 171 | – | – | – | – | – | – | 2 | 11 | 31 | 65 | 62 |
| Kidney | 22 | C64 | 60 | – | – | – | – | – | 2 | 3 | 12 | 11 | 22 | 10 |
| Bladder | 23 | C67 | 56 | – | – | – | – | – | – | 1 | 5 | 14 | 20 | 16 |
| Lymph/haematopoietic tissue | 24 | C81-C96 | 180 | – | – | 1 | – | – | 1 | 7 | 9 | 46 | 69 | 47 |
| Other malignant neoplasms | 365 | – | 1 | 1 | 4 | 4 | 8 | 25 | 61 | 74 | 106 | 81 | ||
| Diseases of the blood and blood-forming organs, immunological disorders | 25 | D50-D89 | 27 | – | – | – | 1 | 1 | – | – | 1 | 7 | 8 | 9 |
| Endocrine, nutritional and metabolic diseases | 26 | E00-E90 | 224 | 1 | – | 1 | – | 2 | 1 | 9 | 8 | 40 | 65 | 97 |
| Diabetes mellitus | 27 | E10-E14 | 154 | – | – | – | – | 2 | – | 3 | 4 | 29 | 46 | 70 |
| Mental and behavioural disorders | 28 | F00-F99 | 479 | – | – | 1 | – | – | 2 | 5 | 9 | 29 | 135 | 298 |
| Alcohol abuse (including alcoholic psychosis) | 29 | F10 | 11 | – | – | – | – | – | 1 | 2 | 3 | 2 | 3 | – |
| Drug dependence, toxicomania | 30 | F11-F16,F18-F19 | 2 | – | – | – | – | – | – | 1 | – | 1 | – | – |
| Diseases of the nervous system and the sense organs | 31 | G00-H95 | 445 | – | – | 2 | 1 | 5 | 5 | 11 | 33 | 75 | 156 | 157 |
| Meningitis | 32 | G00-G03 | 3 | – | – | – | – | – | – | – | 1 | 1 | – | 1 |
| Diseases of the circulatory system:- | 33 | I00-I99 | 2,345 | – | – | 1 | 2 | 8 | 28 | 79 | 161 | 326 | 646 | 1,094 |
| Ischaemic heart disease | 34 | I20-I25 | 1,123 | – | – | – | – | 2 | 16 | 46 | 99 | 188 | 323 | 449 |
| of which: (Acute myocardial infarction) | I21 | 492 | – | – | – | – | – | 7 | 19 | 43 | 77 | 149 | 197 | |
| Other heart disease | 35 | I30-I33,I39-I52 | 404 | – | – | – | 1 | 2 | 6 | 11 | 13 | 30 | 89 | 252 |
| Cerebrovascular disease | 36 | I60-I69 | 418 | – | – | 1 | – | 2 | 2 | 9 | 29 | 57 | 130 | 188 |
| Other diseases of circulatory system | 400 | – | – | – | 1 | 2 | 4 | 13 | 20 | 51 | 104 | 205 | ||
| Diseases of the respiratory system | 37 | J00-J99 | 800 | – | – | – | – | 2 | 4 | 10 | 32 | 128 | 284 | 340 |
| Influenza | 38 | J09-J11 | – | – | – | – | – | – | – | – | – | – | – | – |
| Pneumonia | 39 | J12-J19 | 193 | – | – | – | – | – | 2 | 2 | 4 | 17 | 46 | 122 |
| Chronic lower respiratory disease | 40 | J40-J47 | 376 | – | – | – | – | – | – | 5 | 17 | 79 | 153 | 122 |
| of which: Asthma | 41 | J45-J46 | 19 | – | – | – | – | – | – | 1 | – | 2 | 5 | 11 |
| Other diseases of the respiratory system | 231 | – | – | – | – | 2 | 2 | 3 | 11 | 32 | 85 | 96 | ||
| Diseases of the digestive system | 42 | K00-K93 | 308 | – | – | – | 1 | 4 | 19 | 30 | 39 | 51 | 79 | 85 |
| Ulcer of stomach, duodenum and jejunum | 43 | K25-K28 | 16 | – | – | – | – | – | 1 | 2 | 3 | 4 | 4 | 2 |
| Chronic liver disease | 44 | K70,K73-K74 | 88 | – | – | – | – | 2 | 13 | 20 | 22 | 14 | 14 | 3 |
| Other diseases of the digestive system | 204 | – | – | – | 1 | 2 | 5 | 8 | 14 | 33 | 61 | 80 | ||
| Diseases of the skin and subcutaneous tissue | 45 | L00-L99 | 14 | – | – | – | – | – | – | – | 1 | 1 | 2 | 10 |
| Diseases of the musculoskeletal system/connective tissue | 46 | M00-M99 | 69 | – | – | – | – | – | – | 3 | 5 | 10 | 22 | 29 |
| Rheumatoid arthritis and osteoarthrosis | 47 | M05-M06,M15-M19 | 9 | – | – | – | – | – | – | – | 1 | – | 3 | 5 |
| Diseases of the genitourinary system | 48 | N00-N99 | 161 | 1 | – | – | – | – | 2 | 1 | 3 | 16 | 52 | 86 |
| Diseases of the kidney and ureter | 49 | N00-N29 | 103 | 1 | – | – | – | – | 2 | – | 3 | 13 | 34 | 50 |
| Complications of pregnancy, childbirth and puerperium | 50 | O00-O99 | – | – | – | – | – | – | – | – | – | – | – | – |
| Certain conditions originating in the perinatal period1 | 51 | P00-P96 | 20 | 20 | – | – | – | – | – | – | – | – | – | – |
| Congenital malformations and chromosomal abnormalities | 52 | Q00-Q99 | 43 | 13 | 2 | 1 | – | – | 1 | 9 | 9 | 4 | 3 | 1 |
| Congenital malformations of the nervous system | 53 | Q00-Q07 | 6 | 3 | 1 | – | – | – | – | 1 | – | – | – | 1 |
| Congenital malformations of the circulatory system | 54 | Q20-Q28 | 10 | 6 | 1 | – | – | – | 1 | – | 1 | 1 | – | – |
| Symptoms, signs, abnormal findings, ill-defined causes | 55 | R00-R99 | 47 | 2 | – | – | – | – | – | – | 1 | 3 | 6 | 35 |
| Sudden infant death syndrome | 56 | R95 | 2 | 2 | – | – | – | – | – | – | – | – | – | – |
| Unknown and unspecified causes | 57 | R96-R99 | 2 | – | – | – | – | – | – | – | 1 | – | – | 1 |
| COVID-19 virus identified and virus unidentified | U07 | 1,846 | – | – | – | 1 | 6 | 7 | 21 | 87 | 286 | 636 | 802 | |
| COVID-19 | U07 | 1,846 | – | – | – | 1 | 6 | 7 | 21 | 87 | 286 | 636 | 802 | |
| External causes of injury and poisoning | 58 | V01-Y89 | 185 | – | – | 1 | 10 | 14 | 30 | 22 | 18 | 19 | 26 | 45 |
| Accidents | 59 | V01-X59 | 146 | – | – | – | 3 | 9 | 21 | 17 | 12 | 16 | 23 | 45 |
| of which: Transport accidents | 60 | V01-V99 | 10 | – | – | – | 1 | 2 | 2 | 2 | – | 3 | – | – |
| Accidental falls | 61 | W00-W19 | 36 | – | – | – | – | 1 | 1 | 2 | 4 | 5 | 9 | 14 |
| Accidental poisoning | 62 | X40-X49 | 32 | – | – | – | 1 | 6 | 14 | 9 | 2 | – | – | – |
| Other accidents | 68 | – | – | – | 1 | – | 4 | 4 | 6 | 8 | 14 | 31 | ||
| Suicide and intentional self harm | 63 | X60-X84 | 36 | – | – | 1 | 6 | 5 | 9 | 5 | 6 | 3 | 1 | – |
| Homicide/assault | 64 | X85-Y09 | 1 | – | – | – | 1 | – | – | – | – | – | – | – |
| Events of undetermined intent | 65 | Y10-Y34 | – | – | – | – | – | – | – | – | – | – | – | – |
| All other external causes | 2 | – | – | – | – | – | – | – | – | – | 2 | – | ||
| 1 Stillbirths not included. | ||||||||||||||
| Table 15 Male deaths registered classified by cause of death and age group, January - March 2021 | ||||||||||||||
| Age Group | ||||||||||||||
| Cause of Death | 65 COD | ICD-10 | Total | Under 1 | 1-4 | 5-14 | 15-24 | 25-34 | 35-44 | 45-54 | 55-64 | 65-74 | 75-84 | 85 and |
| Code | Code | Males | over | |||||||||||
| Total Male Deaths | 0 | A00-Y89 | 4,981 | 16 | 2 | 5 | 14 | 41 | 95 | 204 | 432 | 994 | 1,695 | 1,483 |
| Infectious and parasitic diseases:- | 1 | A00-B99 | 32 | – | – | – | – | – | 3 | 1 | 5 | 4 | 8 | 11 |
| Tuberculosis | 2 | A15-A19,B90 | 2 | – | – | – | – | – | – | – | – | 1 | – | 1 |
| Meningococcal infection | 3 | A39 | – | – | – | – | – | – | – | – | – | – | – | – |
| AIDS (HIV Disease) | 4 | B20-B24 | 2 | – | – | – | – | – | – | – | 2 | – | – | – |
| Viral Hepatitis | 5 | B15-B19 | 3 | – | – | – | – | – | 2 | – | 1 | – | – | – |
| Other infectious and parasitic diseases | 25 | – | – | – | – | – | 1 | 1 | 2 | 3 | 8 | 10 | ||
| Neoplasms | 6 | C00-D48 | 1,331 | – | 1 | 1 | 2 | 8 | 19 | 60 | 176 | 354 | 454 | 256 |
| Malignant neoplasms of the:- | 7 | C00-C97 | 1,292 | – | 1 | 1 | 2 | 8 | 19 | 57 | 173 | 347 | 438 | 246 |
| Lip, oral cavity, pharynx | 8 | C00-C14 | 39 | – | – | – | – | – | – | 2 | 9 | 14 | 12 | 2 |
| Oesophagus | 9 | C15 | 74 | – | – | – | – | 3 | 2 | 6 | 14 | 27 | 16 | 6 |
| Stomach | 10 | C16 | 44 | – | – | – | – | – | 1 | 2 | 7 | 8 | 19 | 7 |
| Colon | 11 | C18 | 60 | – | – | – | – | – | – | 6 | 7 | 11 | 22 | 14 |
| Rectum and anus | 12 | C19-C21 | 85 | – | – | – | – | 2 | 2 | 2 | 9 | 23 | 32 | 15 |
| Liver and the intrahepatic bile ducts | 13 | C22 | 69 | – | – | – | – | – | 2 | 3 | 6 | 20 | 30 | 8 |
| Pancreas | 14 | C25 | 69 | – | – | – | – | – | 1 | 3 | 11 | 16 | 24 | 14 |
| Larynx and trachea/bronchus /lung | 15 | C32-C34 | 267 | – | – | – | – | – | 3 | 8 | 40 | 100 | 83 | 33 |
| Skin | 16 | C43 | 26 | – | – | – | – | – | – | 2 | 4 | 7 | 6 | 7 |
| Breast | 17 | C50 | 2 | – | – | – | – | – | – | – | – | 1 | – | 1 |
| Cervix uteri | 18 | C53 | – | – | – | – | – | – | – | – | – | – | – | – |
| Other parts of uterus | 19 | C54-C55 | – | – | – | – | – | – | – | – | – | – | – | – |
| Ovary | 20 | C56 | – | – | – | – | – | – | – | – | – | – | – | – |
| Prostate | 21 | C61 | 171 | – | – | – | – | – | – | 2 | 11 | 31 | 65 | 62 |
| Kidney | 22 | C64 | 46 | – | – | – | – | – | 1 | 3 | 10 | 9 | 16 | 7 |
| Bladder | 23 | C67 | 43 | – | – | – | – | – | – | – | 5 | 12 | 15 | 11 |
| Lymph/haematopoietic tissue | 24 | C81-C96 | 91 | – | – | 1 | – | – | 1 | 3 | 5 | 25 | 39 | 17 |
| Other malignant neoplasms | 206 | – | 1 | – | 2 | 3 | 6 | 15 | 35 | 43 | 59 | 42 | ||
| Diseases of the blood and blood-forming organs, immunological disorders | 25 | D50-D89 | 14 | – | – | – | – | 1 | – | – | 1 | 4 | 5 | 3 |
| Endocrine, nutritional and metabolic diseases | 26 | E00-E90 | 123 | 1 | – | 1 | – | 1 | 1 | 5 | 5 | 27 | 45 | 37 |
| Diabetes mellitus | 27 | E10-E14 | 90 | – | – | – | – | 1 | – | 3 | 2 | 22 | 35 | 27 |
| Mental and behavioural disorders | 28 | F00-F99 | 185 | – | – | 1 | – | – | 2 | 1 | 4 | 16 | 64 | 97 |
| Alcohol abuse (including alcoholic psychosis) | 29 | F10 | 9 | – | – | – | – | – | 1 | 1 | 2 | 2 | 3 | – |
| Drug dependence, toxicomania | 30 | F11-F16,F18-F19 | – | – | – | – | – | – | – | – | – | – | – | – |
| Diseases of the nervous system and the sense organs | 31 | G00-H95 | 226 | – | – | 1 | – | 3 | 3 | 6 | 12 | 50 | 88 | 63 |
| Meningitis | 32 | G00-G03 | 1 | – | – | – | – | – | – | – | – | – | – | 1 |
| Diseases of the circulatory system:- | 33 | I00-I99 | 1,220 | – | – | 1 | 2 | 8 | 20 | 65 | 115 | 225 | 381 | 403 |
| Ischaemic heart disease | 34 | I20-I25 | 700 | – | – | – | – | 2 | 14 | 43 | 79 | 145 | 218 | 199 |
| of which: (Acute myocardial infarction) | I21 | 299 | – | – | – | – | – | 6 | 19 | 32 | 65 | 96 | 81 | |
| Other heart disease | 35 | I30-I33,I39-I52 | 163 | – | – | – | 1 | 2 | 5 | 7 | 9 | 18 | 44 | 77 |
| Cerebrovascular disease | 36 | I60-I69 | 188 | – | – | 1 | – | 2 | – | 6 | 19 | 35 | 66 | 59 |
| Other diseases of circulatory system | 169 | – | – | – | 1 | 2 | 1 | 9 | 8 | 27 | 53 | 68 | ||
| Diseases of the respiratory system | 37 | J00-J99 | 407 | – | – | – | – | 2 | 2 | 8 | 18 | 66 | 152 | 159 |
| Influenza | 38 | J09-J11 | – | – | – | – | – | – | – | – | – | – | – | – |
| Pneumonia | 39 | J12-J19 | 98 | – | – | – | – | – | 2 | 1 | 3 | 12 | 26 | 54 |
| Chronic lower respiratory disease | 40 | J40-J47 | 182 | – | – | – | – | – | – | 4 | 7 | 41 | 74 | 56 |
| of which: Asthma | 41 | J45-J46 | 1 | – | – | – | – | – | – | – | – | – | – | 1 |
| Other diseases of the respiratory system | 127 | – | – | – | – | 2 | – | 3 | 8 | 13 | 52 | 49 | ||
| Diseases of the digestive system | 42 | K00-K93 | 165 | – | – | – | 1 | 4 | 14 | 22 | 23 | 28 | 40 | 33 |
| Ulcer of stomach, duodenum and jejunum | 43 | K25-K28 | 11 | – | – | – | – | – | 1 | 1 | 1 | 3 | 3 | 2 |
| Chronic liver disease | 44 | K70,K73-K74 | 57 | – | – | – | – | 2 | 9 | 14 | 14 | 8 | 8 | 2 |
| Other diseases of the digestive system | 97 | – | – | – | 1 | 2 | 4 | 7 | 8 | 17 | 29 | 29 | ||
| Diseases of the skin and subcutaneous tissue | 45 | L00-L99 | 7 | – | – | – | – | – | – | – | – | 1 | 2 | 4 |
| Diseases of the musculoskeletal system/connective tissue | 46 | M00-M99 | 29 | – | – | – | – | – | – | – | 2 | 8 | 12 | 7 |
| Rheumatoid arthritis and osteoarthrosis | 47 | M05-M06,M15-M19 | – | – | – | – | – | – | – | – | – | – | – | – |
| Diseases of the genitourinary system | 48 | N00-N99 | 81 | – | – | – | – | – | 1 | – | 2 | 11 | 30 | 37 |
| Diseases of the kidney and ureter | 49 | N00-N29 | 58 | – | – | – | – | – | 1 | – | 2 | 10 | 20 | 25 |
| Complications of pregnancy, childbirth and puerperium | 50 | O00-O99 | – | – | – | – | – | – | – | – | – | – | – | – |
| Certain conditions originating in the perinatal period1 | 51 | P00-P96 | 7 | 7 | – | – | – | – | – | – | – | – | – | – |
| Congenital malformations and chromosomal abnormalities | 52 | Q00-Q99 | 22 | 7 | 1 | – | – | – | 1 | 3 | 5 | 2 | 3 | – |
| Congenital malformations of the nervous system | 53 | Q00-Q07 | 4 | 3 | 1 | – | – | – | – | – | – | – | – | – |
| Congenital malformations of the circulatory system | 54 | Q20-Q28 | 3 | 2 | – | – | – | – | 1 | – | – | – | – | – |
| Symptoms, signs, abnormal findings, ill-defined causes | 55 | R00-R99 | 10 | 1 | – | – | – | – | – | – | – | 1 | 4 | 4 |
| Sudden infant death syndrome | 56 | R95 | 1 | 1 | – | – | – | – | – | – | – | – | – | – |
| Unknown and unspecified causes | 57 | R96-R99 | – | – | – | – | – | – | – | – | – | – | – | – |
| COVID-19 virus identified and virus unidentified | U07 | 995 | – | – | – | 1 | 4 | 2 | 15 | 52 | 183 | 392 | 346 | |
| COVID-19 | U07 | 995 | – | – | – | 1 | 4 | 2 | 15 | 52 | 183 | 392 | 346 | |
| External causes of injury and poisoning | 58 | V01-Y89 | 127 | – | – | – | 8 | 10 | 27 | 18 | 12 | 14 | 15 | 23 |
| Accidents | 59 | V01-X59 | 96 | – | – | – | 2 | 6 | 20 | 13 | 7 | 12 | 13 | 23 |
| of which: Transport accidents | 60 | V01-V99 | 9 | – | – | – | 1 | 2 | 2 | 1 | – | 3 | – | – |
| Accidental falls | 61 | W00-W19 | 19 | – | – | – | – | – | 1 | 1 | 2 | 3 | 4 | 8 |
| Accidental poisoning | 62 | X40-X49 | 27 | – | – | – | 1 | 4 | 13 | 8 | 1 | – | – | – |
| Other accidents | 41 | – | – | – | – | – | 4 | 3 | 4 | 6 | 9 | 15 | ||
| Suicide and intentional self harm | 63 | X60-X84 | 29 | – | – | – | 5 | 4 | 7 | 5 | 5 | 2 | 1 | – |
| Homicide/assault | 64 | X85-Y09 | 1 | – | – | – | 1 | – | – | – | – | – | – | – |
| Events of undetermined intent | 65 | Y10-Y34 | – | – | – | – | – | – | – | – | – | – | – | – |
| All other external causes | 1 | – | – | – | – | – | – | – | – | – | 1 | – | ||
| 1 Stillbirths not included. | ||||||||||||||
| Table 16 Female deaths registered classified by cause of death and age group, January - March 2021 | ||||||||||||||
| Age Group | ||||||||||||||
| Cause of Death | 65 COD | ICD-10 | Total | Under 1 | 1-4 | 5-14 | 15-24 | 25-34 | 35-44 | 45-54 | 55-64 | 65-74 | 75-84 | 85 and |
| Code | Code | Females | over | |||||||||||
| Total Female Deaths | 0 | A00-Y89 | 4,583 | 21 | 1 | 4 | 6 | 11 | 56 | 141 | 330 | 641 | 1,236 | 2,136 |
| Infectious and parasitic diseases:- | 1 | A00-B99 | 35 | – | – | – | – | – | 2 | 1 | 2 | 5 | 8 | 17 |
| Tuberculosis | 2 | A15-A19,B90 | 1 | – | – | – | – | – | – | – | – | – | – | 1 |
| Meningococcal infection | 3 | A39 | – | – | – | – | – | – | – | – | – | – | – | – |
| AIDS (HIV Disease) | 4 | B20-B24 | 1 | – | – | – | – | – | – | 1 | – | – | – | – |
| Viral Hepatitis | 5 | B15-B19 | – | – | – | – | – | – | – | – | – | – | – | – |
| Other infectious and parasitic diseases | 33 | – | – | – | – | – | 2 | – | 2 | 5 | 8 | 16 | ||
| Neoplasms | 6 | C00-D48 | 1,153 | – | – | 1 | 2 | 2 | 28 | 83 | 172 | 277 | 341 | 247 |
| Malignant neoplasms of the:- | 7 | C00-C97 | 1,122 | – | – | 1 | 2 | 2 | 25 | 82 | 171 | 274 | 332 | 233 |
| Lip, oral cavity, pharynx | 8 | C00-C14 | 18 | – | – | – | – | – | – | – | 4 | 5 | 5 | 4 |
| Oesophagus | 9 | C15 | 32 | – | – | – | – | – | – | – | 3 | 7 | 12 | 10 |
| Stomach | 10 | C16 | 17 | – | – | – | – | – | – | – | 3 | 4 | 5 | 5 |
| Colon | 11 | C18 | 54 | – | – | – | – | – | 1 | 4 | 6 | 11 | 18 | 14 |
| Rectum and anus | 12 | C19-C21 | 69 | – | – | – | – | – | 4 | 3 | 8 | 11 | 25 | 18 |
| Liver and the intrahepatic bile ducts | 13 | C22 | 41 | – | – | – | – | – | 1 | – | 7 | 12 | 12 | 9 |
| Pancreas | 14 | C25 | 57 | – | – | – | – | – | 1 | 2 | 6 | 14 | 20 | 14 |
| Larynx and trachea/bronchus /lung | 15 | C32-C34 | 234 | – | – | – | – | – | 3 | 11 | 45 | 73 | 69 | 33 |
| Skin | 16 | C43 | 13 | – | – | – | – | – | 2 | 1 | 4 | 2 | 3 | 1 |
| Breast | 17 | C50 | 172 | – | – | – | – | 1 | 7 | 28 | 29 | 37 | 36 | 34 |
| Cervix uteri | 18 | C53 | 20 | – | – | – | – | – | 1 | 7 | 6 | 3 | 2 | 1 |
| Other parts of uterus | 19 | C54-C55 | 24 | – | – | – | – | – | – | 1 | 2 | 5 | 12 | 4 |
| Ovary | 20 | C56 | 96 | – | – | – | – | – | 2 | 10 | 16 | 34 | 25 | 9 |
| Prostate | 21 | C61 | – | – | – | – | – | – | – | – | – | – | – | – |
| Kidney | 22 | C64 | 14 | – | – | – | – | – | 1 | – | 2 | 2 | 6 | 3 |
| Bladder | 23 | C67 | 13 | – | – | – | – | – | – | 1 | – | 2 | 5 | 5 |
| Lymph/haematopoietic tissue | 24 | C81-C96 | 89 | – | – | – | – | – | – | 4 | 4 | 21 | 30 | 30 |
| Other malignant neoplasms | 159 | – | – | 1 | 2 | 1 | 2 | 10 | 26 | 31 | 47 | 39 | ||
| Diseases of the blood and blood-forming organs, immunological disorders | 25 | D50-D89 | 13 | – | – | – | 1 | – | – | – | – | 3 | 3 | 6 |
| Endocrine, nutritional and metabolic diseases | 26 | E00-E90 | 101 | – | – | – | – | 1 | – | 4 | 3 | 13 | 20 | 60 |
| Diabetes mellitus | 27 | E10-E14 | 64 | – | – | – | – | 1 | – | – | 2 | 7 | 11 | 43 |
| Mental and behavioural disorders | 28 | F00-F99 | 294 | – | – | – | – | – | – | 4 | 5 | 13 | 71 | 201 |
| Alcohol abuse (including alcoholic psychosis) | 29 | F10 | 2 | – | – | – | – | – | – | 1 | 1 | – | – | – |
| Drug dependence, toxicomania | 30 | F11-F16,F18-F19 | 2 | – | – | – | – | – | – | 1 | – | 1 | – | – |
| Diseases of the nervous system and the sense organs | 31 | G00-H95 | 219 | – | – | 1 | 1 | 2 | 2 | 5 | 21 | 25 | 68 | 94 |
| Meningitis | 32 | G00-G03 | 2 | – | – | – | – | – | – | – | 1 | 1 | – | – |
| Diseases of the circulatory system:- | 33 | I00-I99 | 1,125 | – | – | – | – | – | 8 | 14 | 46 | 101 | 265 | 691 |
| Ischaemic heart disease | 34 | I20-I25 | 423 | – | – | – | – | – | 2 | 3 | 20 | 43 | 105 | 250 |
| of which: (Acute myocardial infarction) | I21 | 193 | – | – | – | – | – | 1 | – | 11 | 12 | 53 | 116 | |
| Other heart disease | 35 | I30-I33,I39-I52 | 241 | – | – | – | – | – | 1 | 4 | 4 | 12 | 45 | 175 |
| Cerebrovascular disease | 36 | I60-I69 | 230 | – | – | – | – | – | 2 | 3 | 10 | 22 | 64 | 129 |
| Other diseases of circulatory system | 231 | – | – | – | – | – | 3 | 4 | 12 | 24 | 51 | 137 | ||
| Diseases of the respiratory system | 37 | J00-J99 | 393 | – | – | – | – | – | 2 | 2 | 14 | 62 | 132 | 181 |
| Influenza | 38 | J09-J11 | – | – | – | – | – | – | – | – | – | – | – | – |
| Pneumonia | 39 | J12-J19 | 95 | – | – | – | – | – | – | 1 | 1 | 5 | 20 | 68 |
| Chronic lower respiratory disease | 40 | J40-J47 | 194 | – | – | – | – | – | – | 1 | 10 | 38 | 79 | 66 |
| of which: Asthma | 41 | J45-J46 | 18 | – | – | – | – | – | – | 1 | – | 2 | 5 | 10 |
| Other diseases of the respiratory system | 104 | – | – | – | – | – | 2 | – | 3 | 19 | 33 | 47 | ||
| Diseases of the digestive system | 42 | K00-K93 | 143 | – | – | – | – | – | 5 | 8 | 16 | 23 | 39 | 52 |
| Ulcer of stomach, duodenum and jejunum | 43 | K25-K28 | 5 | – | – | – | – | – | – | 1 | 2 | 1 | 1 | – |
| Chronic liver disease | 44 | K70,K73-K74 | 31 | – | – | – | – | – | 4 | 6 | 8 | 6 | 6 | 1 |
| Other diseases of the digestive system | 107 | – | – | – | – | – | 1 | 1 | 6 | 16 | 32 | 51 | ||
| Diseases of the skin and subcutaneous tissue | 45 | L00-L99 | 7 | – | – | – | – | – | – | – | 1 | – | – | 6 |
| Diseases of the musculoskeletal system/connective tissue | 46 | M00-M99 | 40 | – | – | – | – | – | – | 3 | 3 | 2 | 10 | 22 |
| Rheumatoid arthritis and osteoarthrosis | 47 | M05-M06,M15-M19 | 9 | – | – | – | – | – | – | – | 1 | – | 3 | 5 |
| Diseases of the genitourinary system | 48 | N00-N99 | 80 | 1 | – | – | – | – | 1 | 1 | 1 | 5 | 22 | 49 |
| Diseases of the kidney and ureter | 49 | N00-N29 | 45 | 1 | – | – | – | – | 1 | – | 1 | 3 | 14 | 25 |
| Complications of pregnancy, childbirth and puerperium | 50 | O00-O99 | – | – | – | – | – | – | – | – | – | – | – | – |
| Certain conditions originating in the perinatal period1 | 51 | P00-P96 | 13 | 13 | – | – | – | – | – | – | – | – | – | – |
| Congenital malformations and chromosomal abnormalities | 52 | Q00-Q99 | 21 | 6 | 1 | 1 | – | – | – | 6 | 4 | 2 | – | 1 |
| Congenital malformations of the nervous system | 53 | Q00-Q07 | 2 | – | – | – | – | – | – | 1 | – | – | – | 1 |
| Congenital malformations of the circulatory system | 54 | Q20-Q28 | 7 | 4 | 1 | – | – | – | – | – | 1 | 1 | – | – |
| Symptoms, signs, abnormal findings, ill-defined causes | 55 | R00-R99 | 37 | 1 | – | – | – | – | – | – | 1 | 2 | 2 | 31 |
| Sudden infant death syndrome | 56 | R95 | 1 | 1 | – | – | – | – | – | – | – | – | – | – |
| Unknown and unspecified causes | 57 | R96-R99 | 2 | – | – | – | – | – | – | – | 1 | – | – | 1 |
| COVID-19 virus identified and virus unidentified | U07 | 851 | – | – | – | – | 2 | 5 | 6 | 35 | 103 | 244 | 456 | |
| COVID-19 | U07 | 851 | – | – | – | – | 2 | 5 | 6 | 35 | 103 | 244 | 456 | |
| External causes of injury and poisoning | 58 | V01-Y89 | 58 | – | – | 1 | 2 | 4 | 3 | 4 | 6 | 5 | 11 | 22 |
| Accidents | 59 | V01-X59 | 50 | – | – | – | 1 | 3 | 1 | 4 | 5 | 4 | 10 | 22 |
| of which: Transport accidents | 60 | V01-V99 | 1 | – | – | – | – | – | – | 1 | – | – | – | – |
| Accidental falls | 61 | W00-W19 | 17 | – | – | – | – | 1 | – | 1 | 2 | 2 | 5 | 6 |
| Accidental poisoning | 62 | X40-X49 | 5 | – | – | – | – | 2 | 1 | 1 | 1 | – | – | – |
| Other accidents | 27 | – | – | – | 1 | – | – | 1 | 2 | 2 | 5 | 16 | ||
| Suicide and intentional self harm | 63 | X60-X84 | 7 | – | – | 1 | 1 | 1 | 2 | – | 1 | 1 | – | – |
| Homicide/assault | 64 | X85-Y09 | – | – | – | – | – | – | – | – | – | – | – | – |
| Events of undetermined intent | 65 | Y10-Y34 | – | – | – | – | – | – | – | – | – | – | – | – |
| All other external causes | 1 | – | – | – | – | – | – | – | – | – | 1 | – | ||
| 1 Stillbirths not included. | ||||||||||||||
| Table 17 Infant and neonatal mortality by area of residence of deceased, January - March 2021 | |||||
| Infant mortality 1 | Neonatal mortality 2 | ||||
| Area of residence | Number | Rate 3 | Number | Rate 3 | |
| STATE | 37 | 2.7 | 30 | 2.2 | |
| LEINSTER | 19 | 2.5 | 17 | 2.2 | |
| Carlow | 1 | 5.2 | 1 | 5.2 | |
| Dublin City | 7 | 5.1 | 7 | 5.1 | |
| South Dublin | 0 | 0.0 | 0 | 0.0 | |
| Fingal | 1 | 1.2 | 1 | 1.2 | |
| Dún Laoghaire Rathdown | 0 | 0.0 | 0 | 0.0 | |
| Kildare | 0 | 0.0 | 0 | 0.0 | |
| Kilkenny | 1 | 3.1 | 1 | 3.1 | |
| Laois | 0 | 0.0 | 0 | 0.0 | |
| Longford | 0 | 0.0 | 0 | 0.0 | |
| Louth | 3 | 7.5 | 2 | 5.0 | |
| Meath | 2 | 2.9 | 2 | 2.9 | |
| Offaly | 1 | 4.3 | 1 | 4.3 | |
| Westmeath | 0 | 0.0 | 0 | 0.0 | |
| Wexford | 1 | 2.1 | 1 | 2.1 | |
| Wicklow | 2 | 5.0 | 1 | 2.5 | |
| MUNSTER | 7 | 1.9 | 6 | 1.6 | |
| Clare | 1 | 3.2 | 1 | 3.2 | |
| Cork City | 1 | 3.4 | 1 | 3.4 | |
| Cork County | 3 | 2.5 | 2 | 1.6 | |
| Kerry | 0 | 0.0 | 0 | 0.0 | |
| Limerick City | 0 | 0.0 | 0 | 0.0 | |
| Limerick County | 0 | 0.0 | 0 | 0.0 | |
| Tipperary | 2 | 4.0 | 2 | 4.0 | |
| Waterford City | 0 | 0.0 | 0 | 0.0 | |
| Waterford County | 0 | 0.0 | 0 | 0.0 | |
| CONNACHT | 6 | 3.6 | 5 | 3.0 | |
| Galway City | 1 | 5.0 | 1 | 5.0 | |
| Galway County | 5 | 8.2 | 4 | 6.6 | |
| Leitrim | 0 | 0.0 | 0 | 0.0 | |
| Mayo | 0 | 0.0 | 0 | 0.0 | |
| Roscommon | 0 | 0.0 | 0 | 0.0 | |
| Sligo | 0 | 0.0 | 0 | 0.0 | |
| ULSTER (PART OF) | 5 | 5.5 | 2 | 2.2 | |
| Cavan | 2 | 8.4 | 0 | 0.0 | |
| Donegal | 1 | 2.1 | 1 | 2.1 | |
| Monaghan | 2 | 10.4 | 1 | 5.2 | |
| REGIONAL AUTHORITIES: | |||||
| Border | 5 | 4.1 | 2 | 1.7 | |
| Midland | 1 | 1.1 | 1 | 1.1 | |
| West | 6 | 4.4 | 5 | 3.7 | |
| Dublin | 8 | 2.3 | 8 | 2.3 | |
| Mid-East | 7 | 3.2 | 5 | 2.3 | |
| Mid-West | 3 | 2.1 | 3 | 2.1 | |
| South-East | 3 | 2.3 | 3 | 2.3 | |
| South-West | 4 | 2.1 | 3 | 1.6 | |
| 1 Infant mortality rates: Deaths of infants under one year per 1,000 live births, classified by area of residence of mother. | |||||
| 2 Neonatal mortality rates: Deaths of infants under 28 days per 1,000 live births, classified by area of residence of mother. | |||||
| 3 Infant and neonatal mortality rates in some areas, based on small numbers, are subject to considerable fluctuation and caution should be exercised in their interpretation. | |||||
| Table 18 Dementia1 deaths registered by county of residence of deceased, January - March 2021 | |||
| Area of residence | Total | Male | Female |
| State | 454 | 171 | 283 |
| Leinster | 225 | 91 | 134 |
| Carlow | 4 | 2 | 2 |
| Dublin City | 83 | 26 | 57 |
| South Dublin | 17 | 9 | 8 |
| Fingal | 14 | 7 | 7 |
| Dún Laoghaire Rathdown | 30 | 12 | 18 |
| Kildare | 10 | 3 | 7 |
| Kilkenny | 14 | 9 | 5 |
| Laois | 3 | 1 | 2 |
| Longford | 1 | – | 1 |
| Louth | 8 | 3 | 5 |
| Meath | 11 | 6 | 5 |
| Offaly | 9 | 1 | 8 |
| Westmeath | 4 | 1 | 3 |
| Wexford | 8 | 6 | 2 |
| Wicklow | 9 | 5 | 4 |
| Munster | 138 | 48 | 90 |
| Clare | 13 | 7 | 6 |
| Cork City | 17 | 5 | 12 |
| Cork County | 49 | 15 | 34 |
| Kerry | 14 | 4 | 10 |
| Limerick City | 7 | 2 | 5 |
| Limerick County | 9 | 6 | 3 |
| Tipperary | 14 | 3 | 11 |
| Waterford City | 4 | 1 | 3 |
| Waterford County | 11 | 5 | 6 |
| Connacht | 59 | 17 | 42 |
| Galway City | 6 | 4 | 2 |
| Galway County | 18 | 4 | 14 |
| Leitrim | 3 | 1 | 2 |
| Mayo | 14 | 3 | 11 |
| Roscommon | 7 | 2 | 5 |
| Sligo | 11 | 3 | 8 |
| Ulster | 32 | 15 | 17 |
| Cavan | 7 | 2 | 5 |
| Donegal | 23 | 12 | 11 |
| Monaghan | 2 | 1 | 1 |
| REGIONAL AUTHORITIES: | |||
| Border | 46 | 19 | 27 |
| Midland | 17 | 3 | 14 |
| West | 45 | 13 | 32 |
| Dublin | 144 | 54 | 90 |
| Mid-East | 38 | 17 | 21 |
| Mid-West | 43 | 18 | 25 |
| South-East | 41 | 23 | 18 |
| South-West | 80 | 24 | 56 |
| 1 From January 1st 2019 these figures include ICD 10 codes F01 and F03 | |||
 Show Table 19 Alzheimer's deaths registered by county of residence of deceased, January - March 2021
| Table 19 Alzheimer's deaths registered by county of residence of deceased, January - March 2021 | |||
| Area of residence | Total | Male | Female |
| State | 142 | 46 | 96 |
| Leinster | 72 | 23 | 49 |
| Carlow | 2 | 1 | 1 |
| Dublin City | 21 | 3 | 18 |
| South Dublin | 5 | 3 | 2 |
| Fingal | 6 | 3 | 3 |
| Dún Laoghaire Rathdown | 4 | – | 4 |
| Kildare | 5 | 2 | 3 |
| Kilkenny | 3 | – | 3 |
| Laois | 3 | 1 | 2 |
| Longford | 2 | – | 2 |
| Louth | 6 | 3 | 3 |
| Meath | 5 | 2 | 3 |
| Offaly | 1 | 1 | – |
| Westmeath | 4 | 1 | 3 |
| Wexford | 4 | 2 | 2 |
| Wicklow | 1 | 1 | – |
| Munster | 42 | 13 | 29 |
| Clare | 3 | – | 3 |
| Cork City | 2 | – | 2 |
| Cork County | 11 | 5 | 6 |
| Kerry | 7 | 1 | 6 |
| Limerick City | 2 | – | 2 |
| Limerick County | 4 | 2 | 2 |
| Tipperary | 7 | 4 | 3 |
| Waterford City | 2 | – | 2 |
| Waterford County | 4 | 1 | 3 |
| Connacht | 18 | 8 | 10 |
| Galway City | 3 | 1 | 2 |
| Galway County | 8 | 5 | 3 |
| Leitrim | 1 | – | 1 |
| Mayo | 5 | 2 | 3 |
| Roscommon | 1 | – | 1 |
| Sligo | – | – | – |
| Ulster | 10 | 2 | 8 |
| Cavan | 1 | – | 1 |
| Donegal | 6 | 1 | 5 |
| Monaghan | 3 | 1 | 2 |
| REGIONAL AUTHORITIES: | |||
| Border | 11 | 2 | 9 |
| Midland | 10 | 3 | 7 |
| West | 17 | 8 | 9 |
| Dublin | 36 | 9 | 27 |
| Mid-East | 17 | 8 | 9 |
| Mid-West | 16 | 6 | 10 |
| South-East | 15 | 4 | 11 |
| South-West | 20 | 6 | 14 |
| Table 20 COVID-19 (virus identified) deaths registered by county of residence of deceased and sex, January - March 2021 | |||
| Area of residence | Total | Male | Female |
| State | 1,835 | 985 | 850 |
| Leinster | 962 | 521 | 441 |
| Carlow | 30 | 17 | 13 |
| Dublin City | 212 | 113 | 99 |
| South Dublin | 70 | 51 | 19 |
| Fingal | 70 | 46 | 24 |
| Dún Laoghaire Rathdown | 95 | 48 | 47 |
| Kildare | 64 | 26 | 38 |
| Kilkenny | 38 | 19 | 19 |
| Laois | 45 | 23 | 22 |
| Longford | 8 | 3 | 5 |
| Louth | 88 | 45 | 43 |
| Meath | 51 | 34 | 17 |
| Offaly | 21 | 5 | 16 |
| Westmeath | 23 | 11 | 12 |
| Wexford | 91 | 48 | 43 |
| Wicklow | 56 | 32 | 24 |
| Munster | 594 | 300 | 294 |
| Clare | 45 | 18 | 27 |
| Cork City | 115 | 63 | 52 |
| Cork County | 142 | 70 | 72 |
| Kerry | 38 | 21 | 17 |
| Limerick City | 49 | 23 | 26 |
| Limerick County | 84 | 39 | 45 |
| Tipperary | 45 | 27 | 18 |
| Waterford City | 47 | 21 | 26 |
| Waterford County | 29 | 18 | 11 |
| Connacht | 192 | 110 | 82 |
| Galway City | 12 | 6 | 6 |
| Galway County | 53 | 29 | 24 |
| Leitrim | 5 | 2 | 3 |
| Mayo | 91 | 54 | 37 |
| Roscommon | 23 | 15 | 8 |
| Sligo | 8 | 4 | 4 |
| Ulster | 87 | 54 | 33 |
| Cavan | 25 | 13 | 12 |
| Donegal | 42 | 25 | 17 |
| Monaghan | 20 | 16 | 4 |
| REGIONAL AUTHORITIES: | |||
| Border | 100 | 60 | 40 |
| Midland | 97 | 42 | 55 |
| West | 179 | 104 | 75 |
| Dublin | 447 | 258 | 189 |
| Mid-East | 259 | 137 | 122 |
| Mid-West | 223 | 107 | 116 |
| South-East | 235 | 123 | 112 |
| South-West | 295 | 154 | 141 |
| Table 21 COVID-19 (virus not identified) deaths registered by county of residence of deceased and sex, January - March 2021 | |||
| Area of residence | Total | Male | Female |
| State | 11 | 10 | 1 |
| Leinster | 6 | 5 | 1 |
| Carlow | – | – | – |
| Dublin City | – | – | – |
| South Dublin | 2 | 1 | 1 |
| Fingal | – | – | – |
| Dún Laoghaire-Rathdown | 1 | 1 | – |
| Kildare | – | – | – |
| Kilkenny | 1 | 1 | – |
| Laois | – | – | – |
| Longford | – | – | – |
| Louth | 1 | 1 | – |
| Meath | – | – | – |
| Offaly | – | – | – |
| Westmeath | – | – | – |
| Wexford | 1 | 1 | – |
| Wicklow | – | – | – |
| Munster | 3 | 3 | – |
| Clare | – | – | – |
| Cork City | 1 | 1 | – |
| Cork County | – | – | – |
| Kerry | – | – | – |
| Limerick City | – | – | – |
| Limerick County | 2 | 2 | – |
| Tipperary | – | – | – |
| Waterford City | – | – | – |
| Waterford County | – | – | – |
| Connacht | 1 | 1 | – |
| Galway City | – | – | – |
| Galway County | 1 | 1 | – |
| Leitrim | – | – | – |
| Mayo | – | – | – |
| Roscommon | – | – | – |
| Sligo | – | – | – |
| Ulster | 1 | 1 | – |
| Cavan | 1 | 1 | – |
| Donegal | – | – | – |
| Monaghan | – | – | – |
| REGIONAL AUTHORITIES: | |||
| Border | 1 | 1 | – |
| Midland | – | – | – |
| West | 1 | 1 | – |
| Dublin | 3 | 2 | 1 |
| Mid-East | 1 | 1 | – |
| Mid-West | 2 | 2 | – |
| South-East | 2 | 2 | – |
| South-West | 1 | 1 | – |
This report has been prepared by the Central Statistics Office for the Minister for Social Protection in accordance with the provisions of Section 2 of the Vital Statistics and Births, Deaths and Marriages Registration Act, 1952 and Government Order SI 831 of 2007.
All figures in this report are classified by quarter of registration and are provisional.
Deaths are classified to the World Health Organisation (W.H.O.) International Classification of Diseases, 10th Revision (ICD10).
The Underlying Cause of Death (UCOD) has been defined by the World Health Organisation (WHO) as
(a) the disease or injury which initiated the train of morbid events leading directly to death, or (b) the circumstances of the accident or violence which produced the fatal injury’, and is selected for routine single-cause tabulation of mortality statistics.
All deaths registered in the quarter have been included in the statistics and some cases have been assigned a provisional cause of death pending the outcome of further enquiries.
Caution should be exercised if directly comparing these mortality statistics with those of previous quarters as this data is provisional and subject to change. Final data is published in our annual reports and is based on the date the death occurred while the quarterly releases are based on the date the death was registered.
Inquest deaths are coded manually due to the nature of the reporting of these cases. The difficulty lies in automatically assigning a verdict from a broad range of verdicts open to a Coroner or jury which include accidental death, misadventure, suicide, open verdict, natural causes (if so found at inquest) and in certain circumstances, unlawful killing. A provisional cause of death may been assigned to a number of inquest cases pending the outcome of further enquiries.
From the 1st January 2018 the CSO is using automated software called IRIS for selecting the underlying cause of death code. The coding system has been developed and is maintained by the IRIS core group to code mortality data and is the preferred coding tool for European countries. All W.H.O. updates to the ICD-10 classification are included in the software according to the WHO timelines.
See WHO guidance for public health surveillance of coronavirus disease (COVID-19) in humans caused by infection with severe acute respiratory syndrome coronavirus 2 (SARS-CoV-2).
Refers to the number of previous live births excluding any not stated.
From January 2018 onwards where births take place within the State and the area of residence of the mother is outside the State, the area of residence of the mother is recorded as outside the State. Prior to this, births where the mother was residing outside the State were assigned to the location where the birth took place within the State.
From the 1st January 2018 an Amendment of the Eurostat Nomenclature of territorial units for statistics (NUTS classification) legislation came into effect. This reflects the new regional assembly structure and the other changes to the Local Government Act for Tipperary North, Tipperary South and Limerick and Waterford City and County Councils. The composition of the new Regions breakdown is outlined below.
Up to December 2017 regional classifications were based on the NUTS classification used by Eurostat. The NUTS3 regions corresponded to eight Regional Authorities established under the Local Government Act, 1991 (Regional Authorities) (Establishment) Order, 1993, which came into operation on 1 January 1994. The NUTS2 regions, which were proposed by Government and agreed by Eurostat in 1999, are groupings of the NUTS3 regions. The composition of the regions is set out below.
| Border | Cavan | Dublin | Dublin City |
| Donegal | Dún Laoghlaire-Rathdown | ||
| Leitrim | Fingal | ||
| Monaghan | South Dublin | ||
| Sligo | Mid-East | Kildare | |
| Louth | |||
| West | Galway City | Meath | |
| Galway County | Wicklow | ||
| Mayo | Midland | Laois | |
| Roscommon | Longford | ||
| Offaly | |||
| Westmeath | |||
| Southern Regions | |||
| South-East | Carlow | Mid-West | Clare |
| Kilkenny | Tipperary | ||
| Waterford City and County | Limerick City and County | ||
| Wexford | South-West | Cork City | |
| Cork County | |||
| Kerry |
The United Kingdom withdrew from the EU on the 31 January 2020. From the 1 February 2020 the EU is reduced to 27 Member States.
As the United Kingdom was part of the EU for one month in 2020 - it is included as part of the EU 28 for quarter 1 2020.
Civil Partnership legislation was introduced in Ireland on the 1st January 2011. From 16th November 2015, when same-sex marriages legislation came into effect, same-sex couples no longer had the option to apply for a Civil Partnership. However, couples that had given the required 3 months' notice of a Civil Partnership prior to 16th November 2015 were still entitled to have a Civil Partnership ceremony after that date.
The Marriage Act 2015 (No. 35/2015) effective from the 16th November 2015 (S.I. 504/2015) refers, allows parties of the same sex to marry.
The Fourth Quarter and Yearly Summary publications from 2014 onwards are available in separate electronic publications on the CSO website . The quarterly publications (from Quarter 1, 2014) and the Yearly Summary publications (from 2014 onwards) are no longer available in hard copy.
For interactive tables, please go to CSO PxStat.
Rates for quarter 1 2021, were calculated using the relevant population data in April 2020.
For the purpose of this release the population concept of usual residence has been used, i.e. all persons usually resident and present in the State on census night, plus absent persons who are usually resident in Ireland, but are temporarily away from home and outside the State on Census night. All persons are classified according to the region of their usual residence.
Rates for Births, Deaths and Marriages were revised in quarter 4 2017 for intercensal years 2012 to 2015, based on revised estimated usual residence population data. Rates for 2016 were also revised based on updated Census of Population usual residence population figures.
Live Births
The terms used in relation to live births are defined as follows:
A live birth: is defined as the complete expulsion or extraction from its mother of a product of conception, irrespective of the duration of pregnancy, which, after such separation, breathes or shows any other evidence of life, such as beating of the heart, pulsation of the umbilical cord, or definite movement of voluntary muscles, whether or not the umbilical cord has been cut or the placenta is attached.
Parity: Parity is the number of previous live born children to a woman.
Birth Order: Birth order is the number of live born children a woman has in the order in which they are born.
Parity and Birth order: A first birth relates to parity 0 or birth order 1 i.e. birth order = parity + 1.
Crude birth rate (CBR): The number of live births divided by the total population at that age (or age-group), multiplied by 1,000.
Age specific fertility rate (ASFR): The number of live births at a certain age (or age-group) divided by the female population at that age (or age-group) multiplied by 1,000.
Total period fertility rate (TPFR): The sum of the ASFRs, divided by 1,000 i.e. the expected number of children a woman will have in her lifetime based on the fertility of that year.
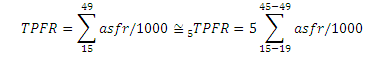
Age specific reproduction rate (ASRR): The number of female live births at a certain age (or age-group) divided by the female population at that age (or age-group), multiplied by 1,000.
Gross reproduction rate (GRR): The sum of the ASRRs divided by 1,000 i.e. the expected number of daughters a woman will have in her lifetime based on the fertility of that year.
Net reproduction rate (NRR): The sum of the products of the ASRR's and the expected number of female years to be lived at that age, divided by 1,000 i.e. the GRR adjusted for female mortality.
The difference between the gross and the net reproduction rates is an indicator of female mortality.
Average age at maternity: The sum of the products of the ages at maternity of live births and their ages divided by the number of live births.
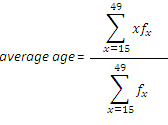
Average age at maternity of first birth: The sum of the products of the ages at maternity of first live births and their ages divided by the number of first live births.
Childbearing years are regarded as between 15 and 49.
Live birth to mothers less than 15 are included in the age 15 category and are divided by the age 15 population. Similarly, live births to mothers aged greater than 49 are included in the age 49 category and are divided by the age 49 population.
Average of mean ages: Live births where the age at maternity is not stated are excluded from the calculation.
Deaths
Crude death rate (CDR): The number of deaths divided by the total population at that age (or age-group), multiplied by 1,000.
Standardised death rate : the (age) standardised death rate is a weighted average of age-specific mortality rates. The weighting factor is the age distribution of a standard reference population. The standard reference population used is the European standard population as defined by Eurostat in 2012. The new European Standard Population (ESP) is the unweighted average of the individual populations of EU-28 plus EFTA countries in each 5-years age band (with the exception of under 5 and the highest age group of 95+). The ESP is calculated on the basis of the 2010-based population projections, averaged over the period 2011-30.
Stillbirths, Infant Mortality and Maternal Mortality
Stillbirth: Stillbirth weighing 500 grams or more or at gestational age of 24 weeks or more, this definition applies to stillbirth figures from 1995 onwards.
Late foetal death: Foetal death at or over 28 weeks gestation, this definition was applied up to 1994 inclusive.
Early neonatal death: Death at ages under 1 week live born infant.
Perinatal deaths: Stillbirths or late foetal deaths plus early neonatal deaths.
Late neonatal deaths: Death between the ages of 1 week and 4 weeks of live born infant.
Neonatal death: Death at ages under 4 weeks of live born infant.
Post neonatal death: Death between the ages of 4 weeks and 1 year of live born infant.
Infant death: Death at ages under 1 year of live born infant.
Maternal death: A maternal death is the death of a woman while pregnant or within 42 days of termination of pregnancy, irrespective of the duration and the site of the pregnancy, from any cause related to or aggravated by the pregnancy or its management, but not from accidental or incidental causes.
Stillbirth rate: Stillbirths divided by total live births plus stillbirths, multiplied by 1,000.
Late foetal mortality rate: Late foetal deaths divided by total live births plus late foetal deaths, multiplied by 1,000.
Early neonatal mortality rate: Early neonatal deaths divided by total live births, multiplied by 1,000.
Perinatal mortality rate: Perinatal deaths divided by total live births plus stillbirths, multiplied by 1,000.
Late neonatal mortality rate: Late neonatal deaths divided by total live births, multiplied by 1,000.
Neonatal mortality rate: Neonatal deaths divided by total live births, multiplied by 1,000.
Post neonatal mortality rate: Post neonatal deaths divided by total live births, multiplied by 1,000.
Infant mortality rate: Infant deaths divided by total live births, multiplied by 1,000.
Maternal death rate: Maternal deaths divided by total live and stillbirths multiplied by 100,000.
 Hide Background Notes
Scan the QR code below to view this release online or go to
http://www.cso.ie/en/releasesandpublications/ep/p-vs/vitalstatisticsfirstquarter2021/
 Hide Table 1 Births classified by age of mother at maternity by quarter, 2016, 2020 and 2021 and their corresponding annual age specific (asfr) and total period fertility rates (tpfr)