
This new report, Urban and Rural Life in Ireland 2019, uses a six-way urban/rural classification to examine social and economic characteristics of life in Ireland, (see Table 1.1 for the urban/rural classification). Themes such as income, housing, health, education and commuting patterns are examined.
Some of the findings include:
Just over three in ten people in Ireland (31.4%) lived in a rural area1, above the rate of 27.3% in the EU. The highest proportion of people in the EU living in rural areas was 54.9% in Lithuania. In all other EU countries less than 50% of the population live in rural areas, with the lowest proportion in Malta at 0.2%. The definition of rural applied in this instance is that adopted by Eurostat as part of its degree of urbanisation (DEGURBA)2 classification (that indicates the character of an area). For the definition of rural for Census as used in this report see below.
| Population | |
| Lithuania | 54.9 |
| Romania | 46.5 |
| Slovenia | 46 |
| Luxembourg | 45.9 |
| Poland | 41.7 |
| Slovakia | 41.6 |
| Estonia | 40.8 |
| Croatia | 39.2 |
| Austria | 39 |
| Latvia | 37.1 |
| Czechia | 35.3 |
| France | 34.1 |
| Denmark | 33.1 |
| Hungary | 32.8 |
| Bulgaria | 32.2 |
| Ireland | 31.4 |
| Greece | 31.2 |
| Finland | 29.3 |
| EU28 | 27.3 |
| Portugal | 26.3 |
| Spain | 26.1 |
| Italy | 24.7 |
| Germany | 23 |
| Sweden | 20.4 |
| Cyprus | 18.1 |
| Belgium | 18 |
| UK | 12.8 |
| Netherlands | 9.8 |
| Malta | 0.2 |
The Central Statistics Office (CSO) publishes a range of publications which include an urban/rural categorisation. Sometimes this is a simple division into urban and rural areas, but in other cases there is a further subdivision using population density.
(The Census definition of an urban area is a town with a total population of 1,500 or more and therefore towns with a population of less than 1,500 are included in rural areas.)
This approach does not address the underlying characteristics which might separate one rural area from another. For example, a rural family living in north county Dublin will have a shorter distance to services and amenities than a rural family living in Roscommon. In 2005, Statistics New Zealand addressed this issue with a report called ‘New Zealand: An Urban/Rural Profile'3.
This new CSO publication, ‘Urban and Rural Life in Ireland 2019’, adopts a similar methodology. Urban areas are sub-divided based on the proportion of people in employment in cities while rural areas are subdivided based on the proportion of usual residents in employment in urban areas.
An urban/rural six-way classification was used for this report and applied Small Area4 levels, using the place of work as a measure of distance to services and amenities, combined with population density from Census 2016.
This six-way experimental categorisation of urban and rural were applied to these CSO statistics:
This new six-way urban/rural categorisation was also applied to the integration of CSO datasets with pseudonymised datasets from a range of administrative data sources, to produce aggregated outputs at a geographical level which were not previously available. These administrative data sources were from:
This report is an example of the policy-relevant research projects the CSO are developing as part of its leadership role in the Irish Statistical System. Our goal is to maximise the variety and volume of data available to provide high quality information to the Government, businesses and citizens, through the development of a National Data Infrastructure (NDI).
The NDI plays an integral part in facilitating the CSO to develop new and improved statistical products for the benefit of citizens and policymakers. The core concept of the NDI involves the collection, maintenance and storage, on all public sector data holdings, of the associated PPSN, Eircode and Unique Business Identifier (UBI, to be developed), whenever they are relevant to Public Sector Body transactions with customers. This supports the development of targeted policy interventions.
The demand for data and insight continues to grow unabated. The growth is not just apparent in terms of the broad range of themes (e.g. globalisation, productivity, well-being, sexual violence) that Official Statisticians are being asked to provide information on but also in relation to the level of detail being required in the analysis (e.g. geographical detail, socio-demographic variables, foreign/domestic company ownership). It is clear that the range and depth of demand can not be met from survey data alone but through analysis of new data sources including administrative records held by public sector bodies and some emerging private data sources.
The Central Statistics Office will publish further 'horizontal reports' on differences in outcomes based on housing tenure, family formation and other cross-cutting topics in future, based on additional analysis of administrative and survey data sources.
High quality statistics are the foundation of evidence-based decision-making and the basis for accountability. They help people to understand the changes taking place in Ireland’s economy and in our society.
Under the auspices of the Statistics Act 1993, and in compliance with all relevant data protection legislation, the CSO is in a unique position to gather and link administrative data sources held by Government departments and agencies and evaluate their potential for statistical use.
| Type | Definition | |
| Urban areas | Cities | Towns/settlements with populations greater than 50,000 - using Census 2016 definitions/breakdowns. |
| Satellite Urban Towns | Towns/settlements with populations between 1,500 and 49,999, where 20 percent or more of the usually resident employed population's workplace address is in 'Cities'. | |
| Independent urban towns | Towns/settlements with populations between 1,500 and 49,999, where less than 20 percent of the usually resident employed population's workplace address is in 'Cities'. | |
| Rural Areas | Rural areas with high urban influence | Rural areas (themselves defined as having an area type with a population less than 1,500 persons, as per Census 2016) are allocated to one of three sub-categories, based on their dependence on urban areas. Again, employment location is the defining variable. The allocation is based on a weighted percentage of resident employed adults of a rural Small Area who work in the three standard categories of urban area (for simplicity the methodology uses main, secondary and minor urban area). The percentages working in each urban area were weighted through the use of multipliers. The multipliers allowed for the increasing urbanisation for different sized urban areas. For example, the percentage of rural people working in a main urban area had double the impact of the same percentage working in a minor urban area. The weighting acknowledges the impact that a large urban centre has on its surrounding area. The adopted weights for: Main Urban areas is 2 Satellite urban communities is 1.5 Independent urban communities is 1 The weighted percentages is divided into tertials to assign one of the three rural breakdowns |
| Rural areas with moderate urban influence | As above | |
| Highly rural/remote areas | As above |
Note: On 18/12/2019 a correction was made to the above definitions table to correctly reflect that the lower threshold regarding population densities in 'Satellite urban towns' and 'Independent urban towns' was 1,500 persons.
[2] Eurostat - Degree of Urbanization Background
[3] Stats New Zealand: An Urban/Rural Profile Update
[4] Small Areas are areas of population generally comprising between 80 and 120 dwellings, created by The National Institute of Regional and Spatial Analysis (NIRSA), on behalf of the Ordnance Survey Ireland (OSGi) in consultation with CSO. Designed as the lowest level of geography for the compilation of statistics, in line with data protection and were used as the basis for enumeration in Census 2016.
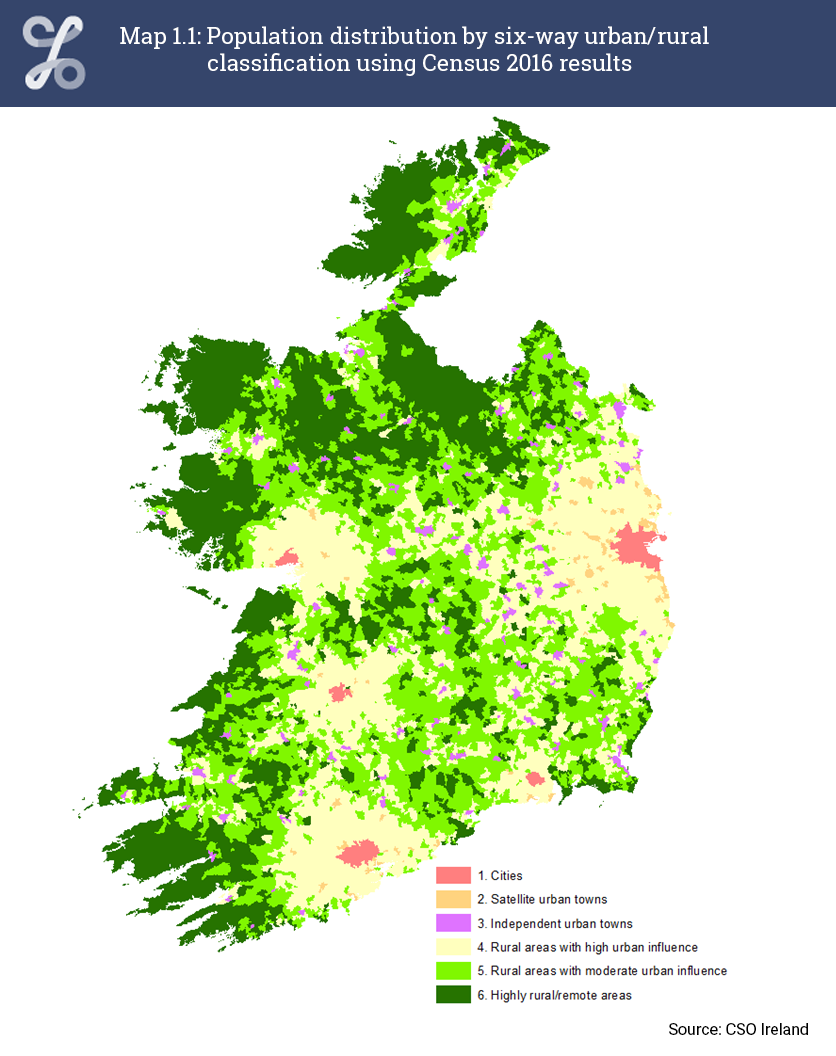
The map image shows the spread of the six area classifications across the country. To view the interactive version of the below map, click here. The map can be used to find the urban and rural six-way classification assigned to a particular address (searchable by Eircode or address).
The population definition which will be considered in this report, in the context of census analysis, is the usually resident and present in the State concept (unless otherwise stated).
We would like to thank the following people for their help and assistance in the production and compilation of this report:
Central Statistics Office
Dermot Corcoran - Sustainable Development Goals and Indicator Reports
Helen Cahill - Sustainable Development Goals and Indicator Reports
Gerard Reilly - Income, Consumption and Wealth
Eva O’Regan - Income, Consumption and Wealth
Barra Casey - Prices
Viacheslav Voronovich - Residential Property
Jim Dalton - Labour Market Analysis
Edel Flannery - Labour Market and Earnings
Justin Anderson - Statistical System Co-ordination Unit
Brendan O’Dowd - Statistical System Co-ordination Unit
Kieran Culhane - Statistical System Co-ordination Unit
Sean O’Connor - Administrative Data Centre
Learn about our data and confidentiality safeguards, and the steps we take to produce statistics that can be trusted by all.