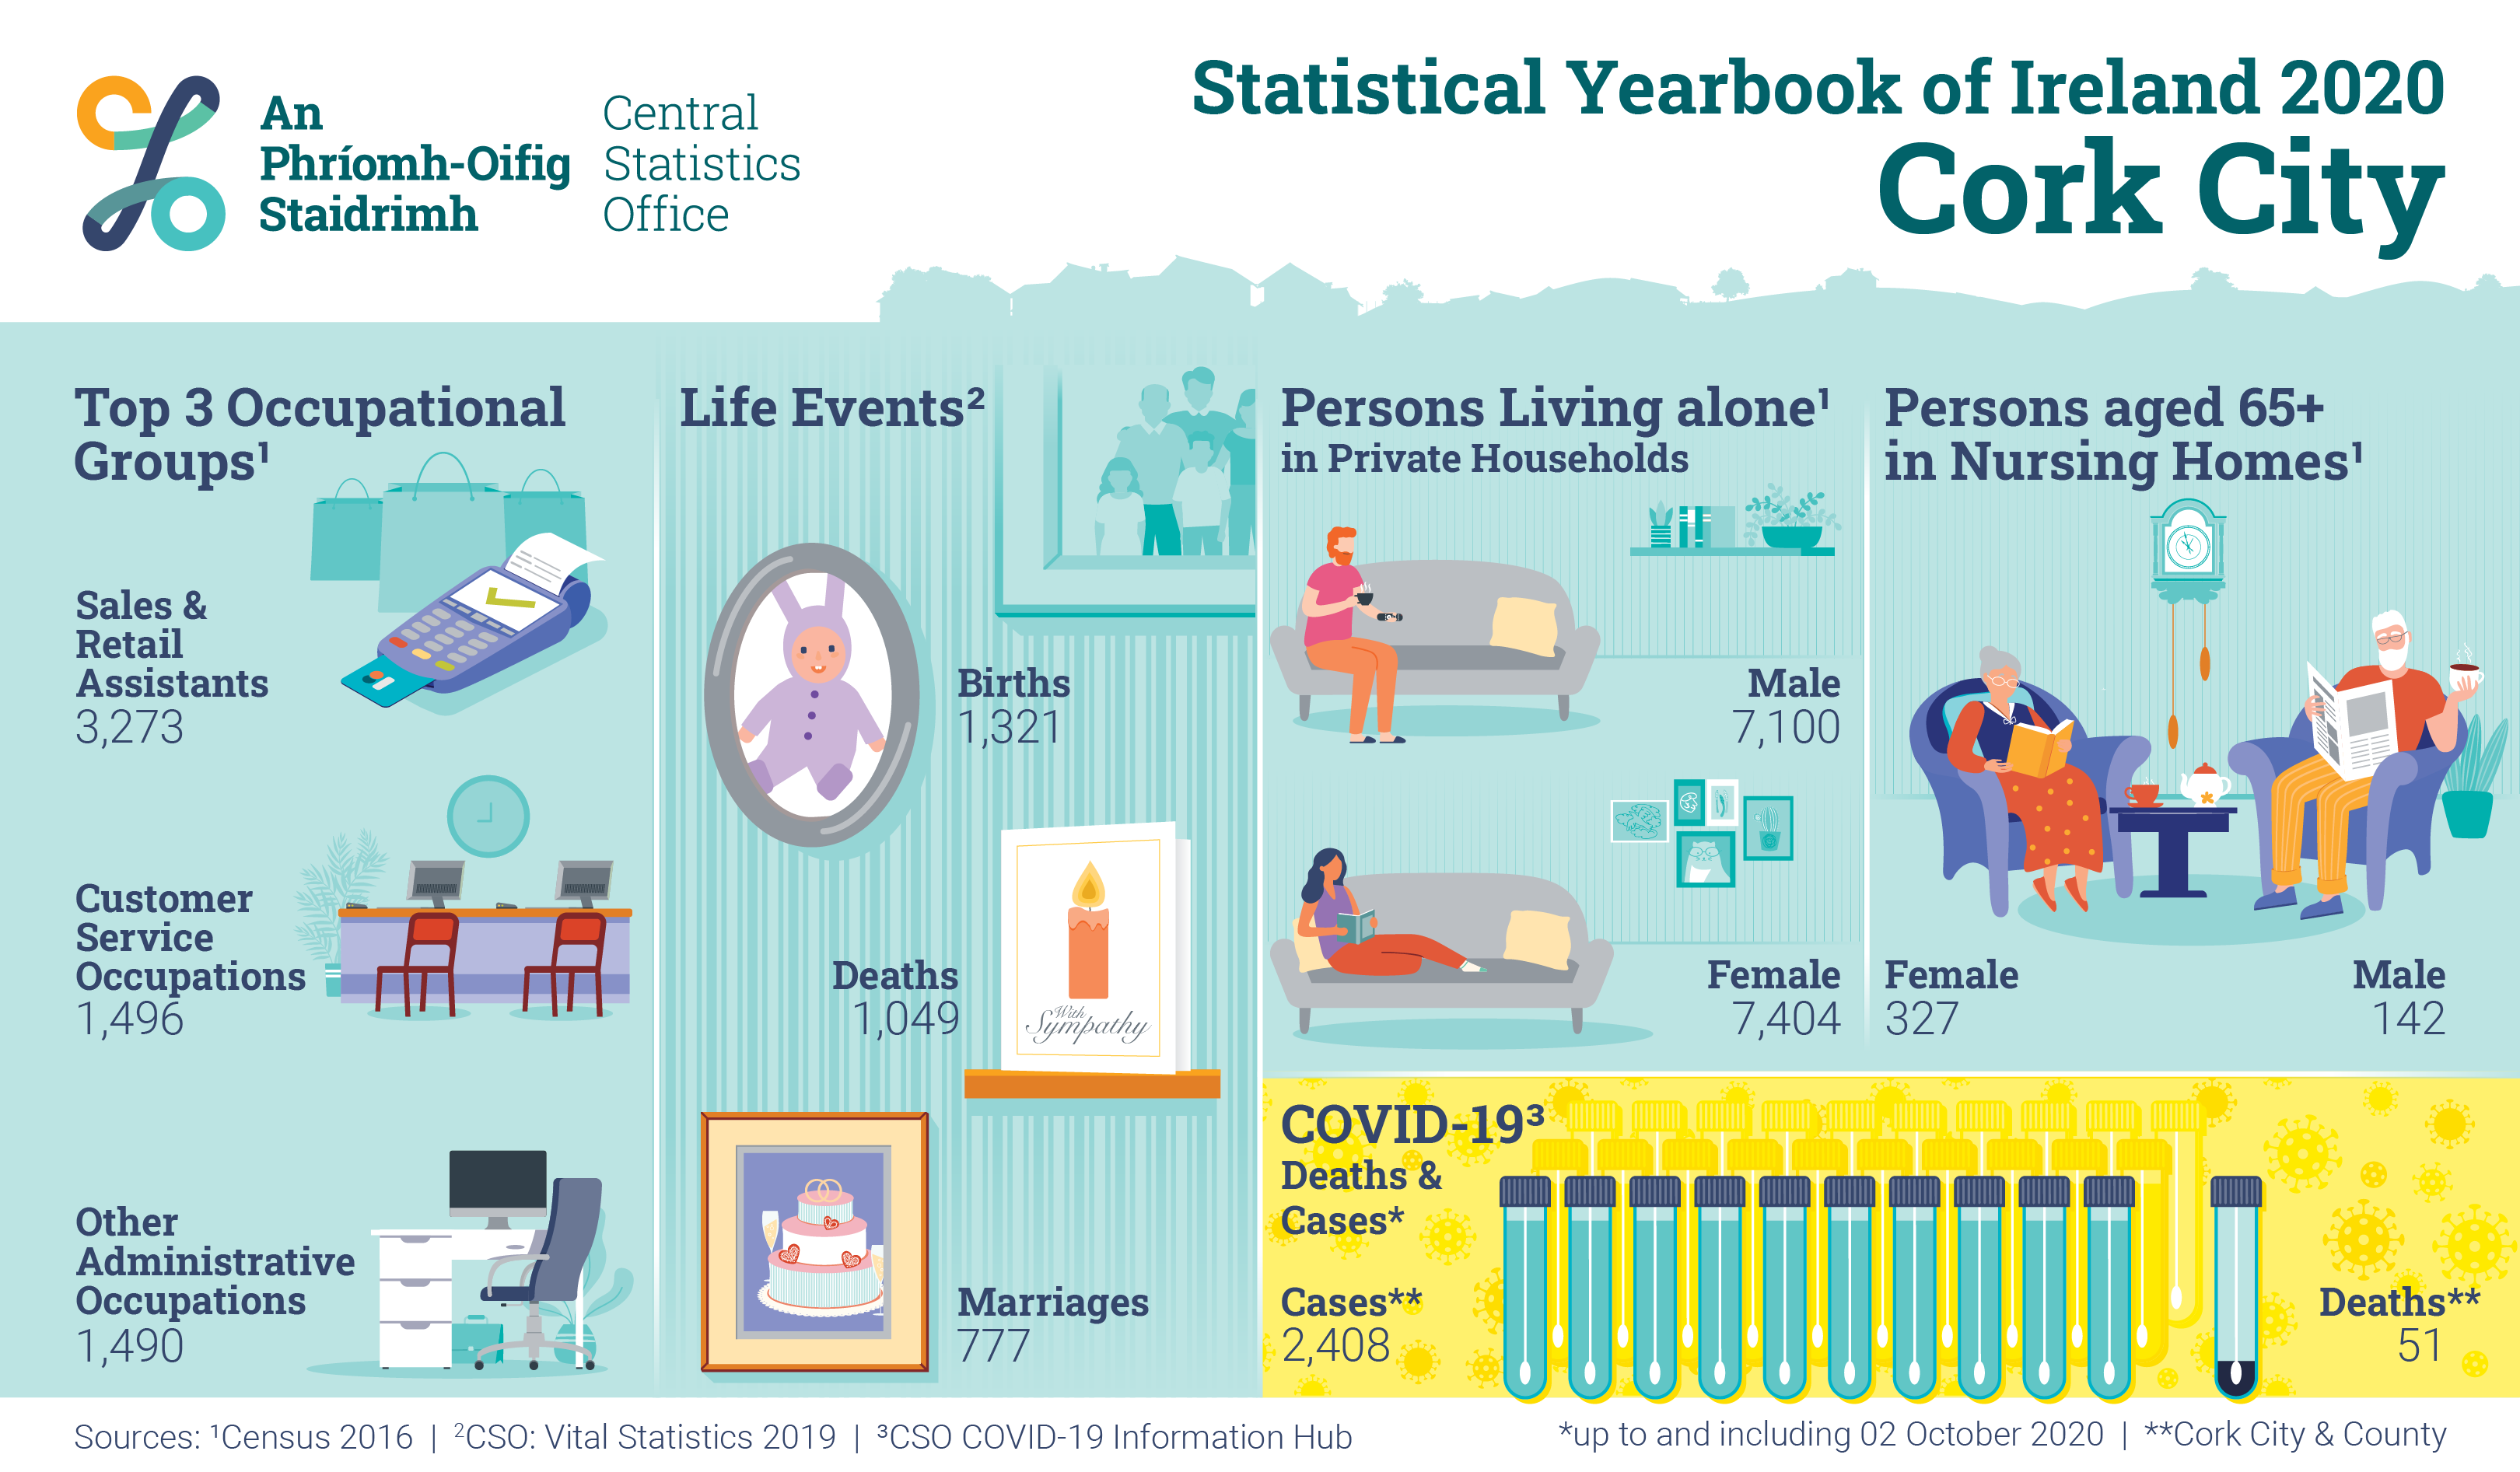
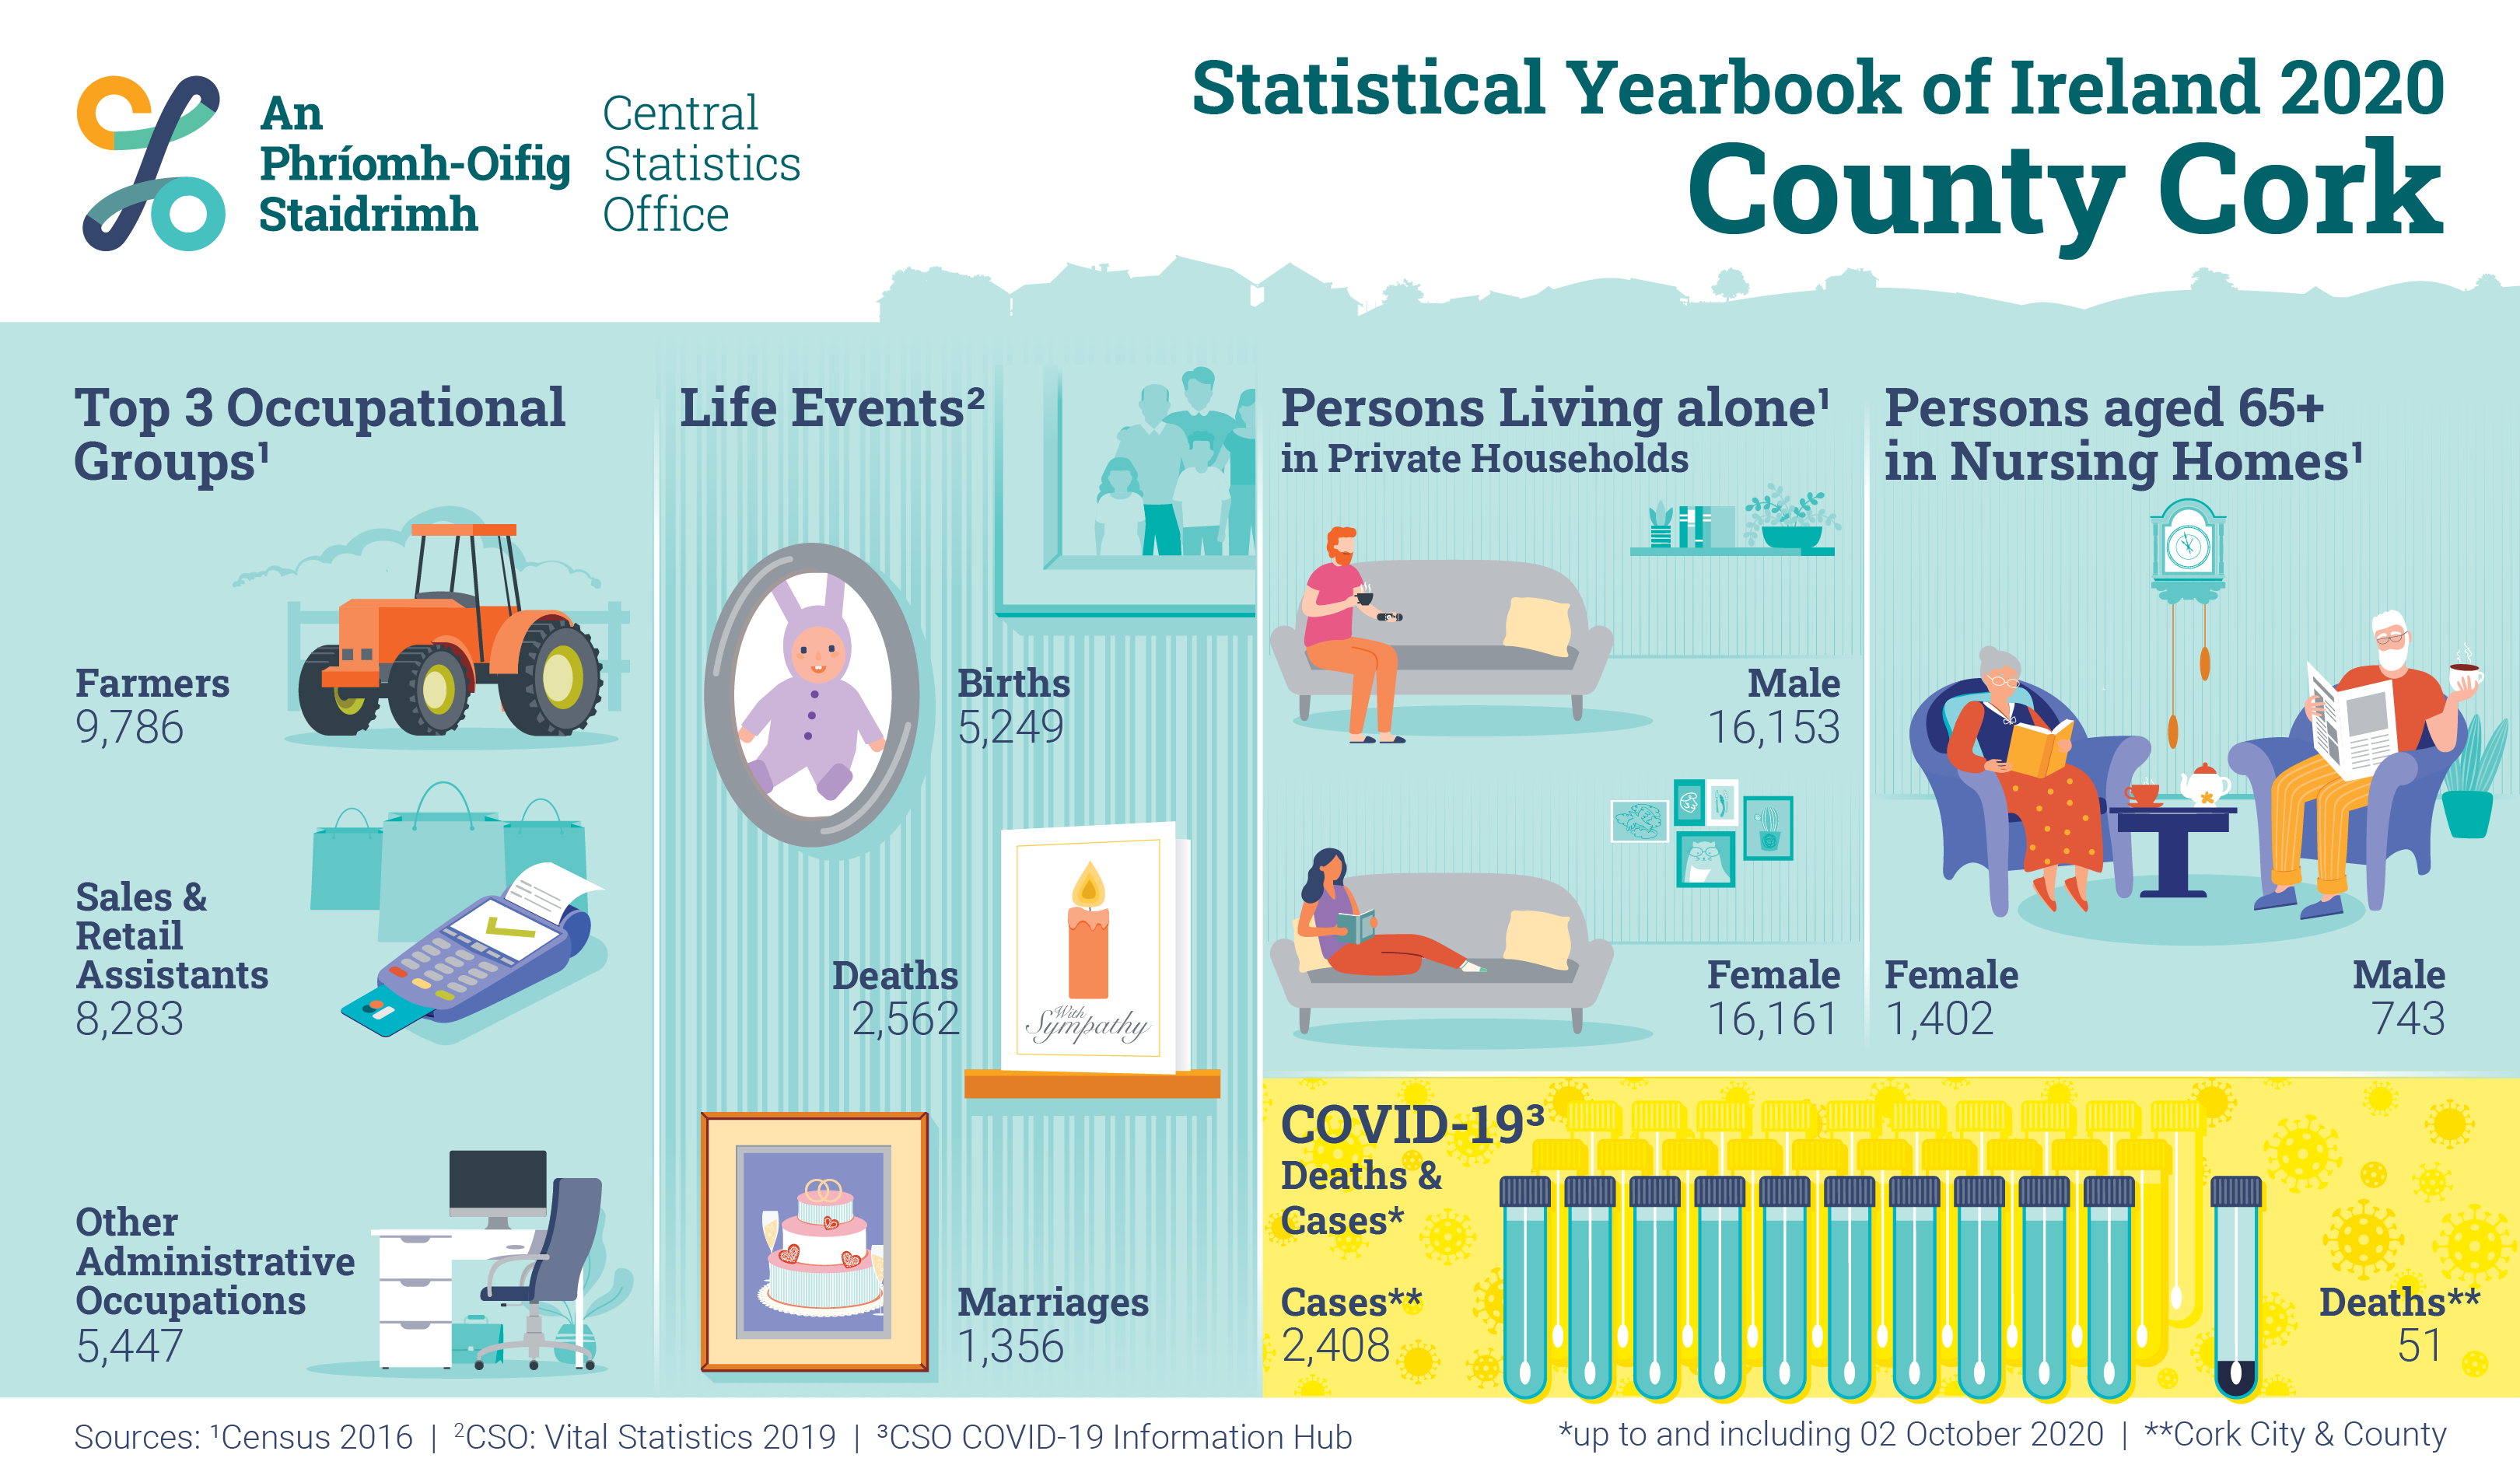
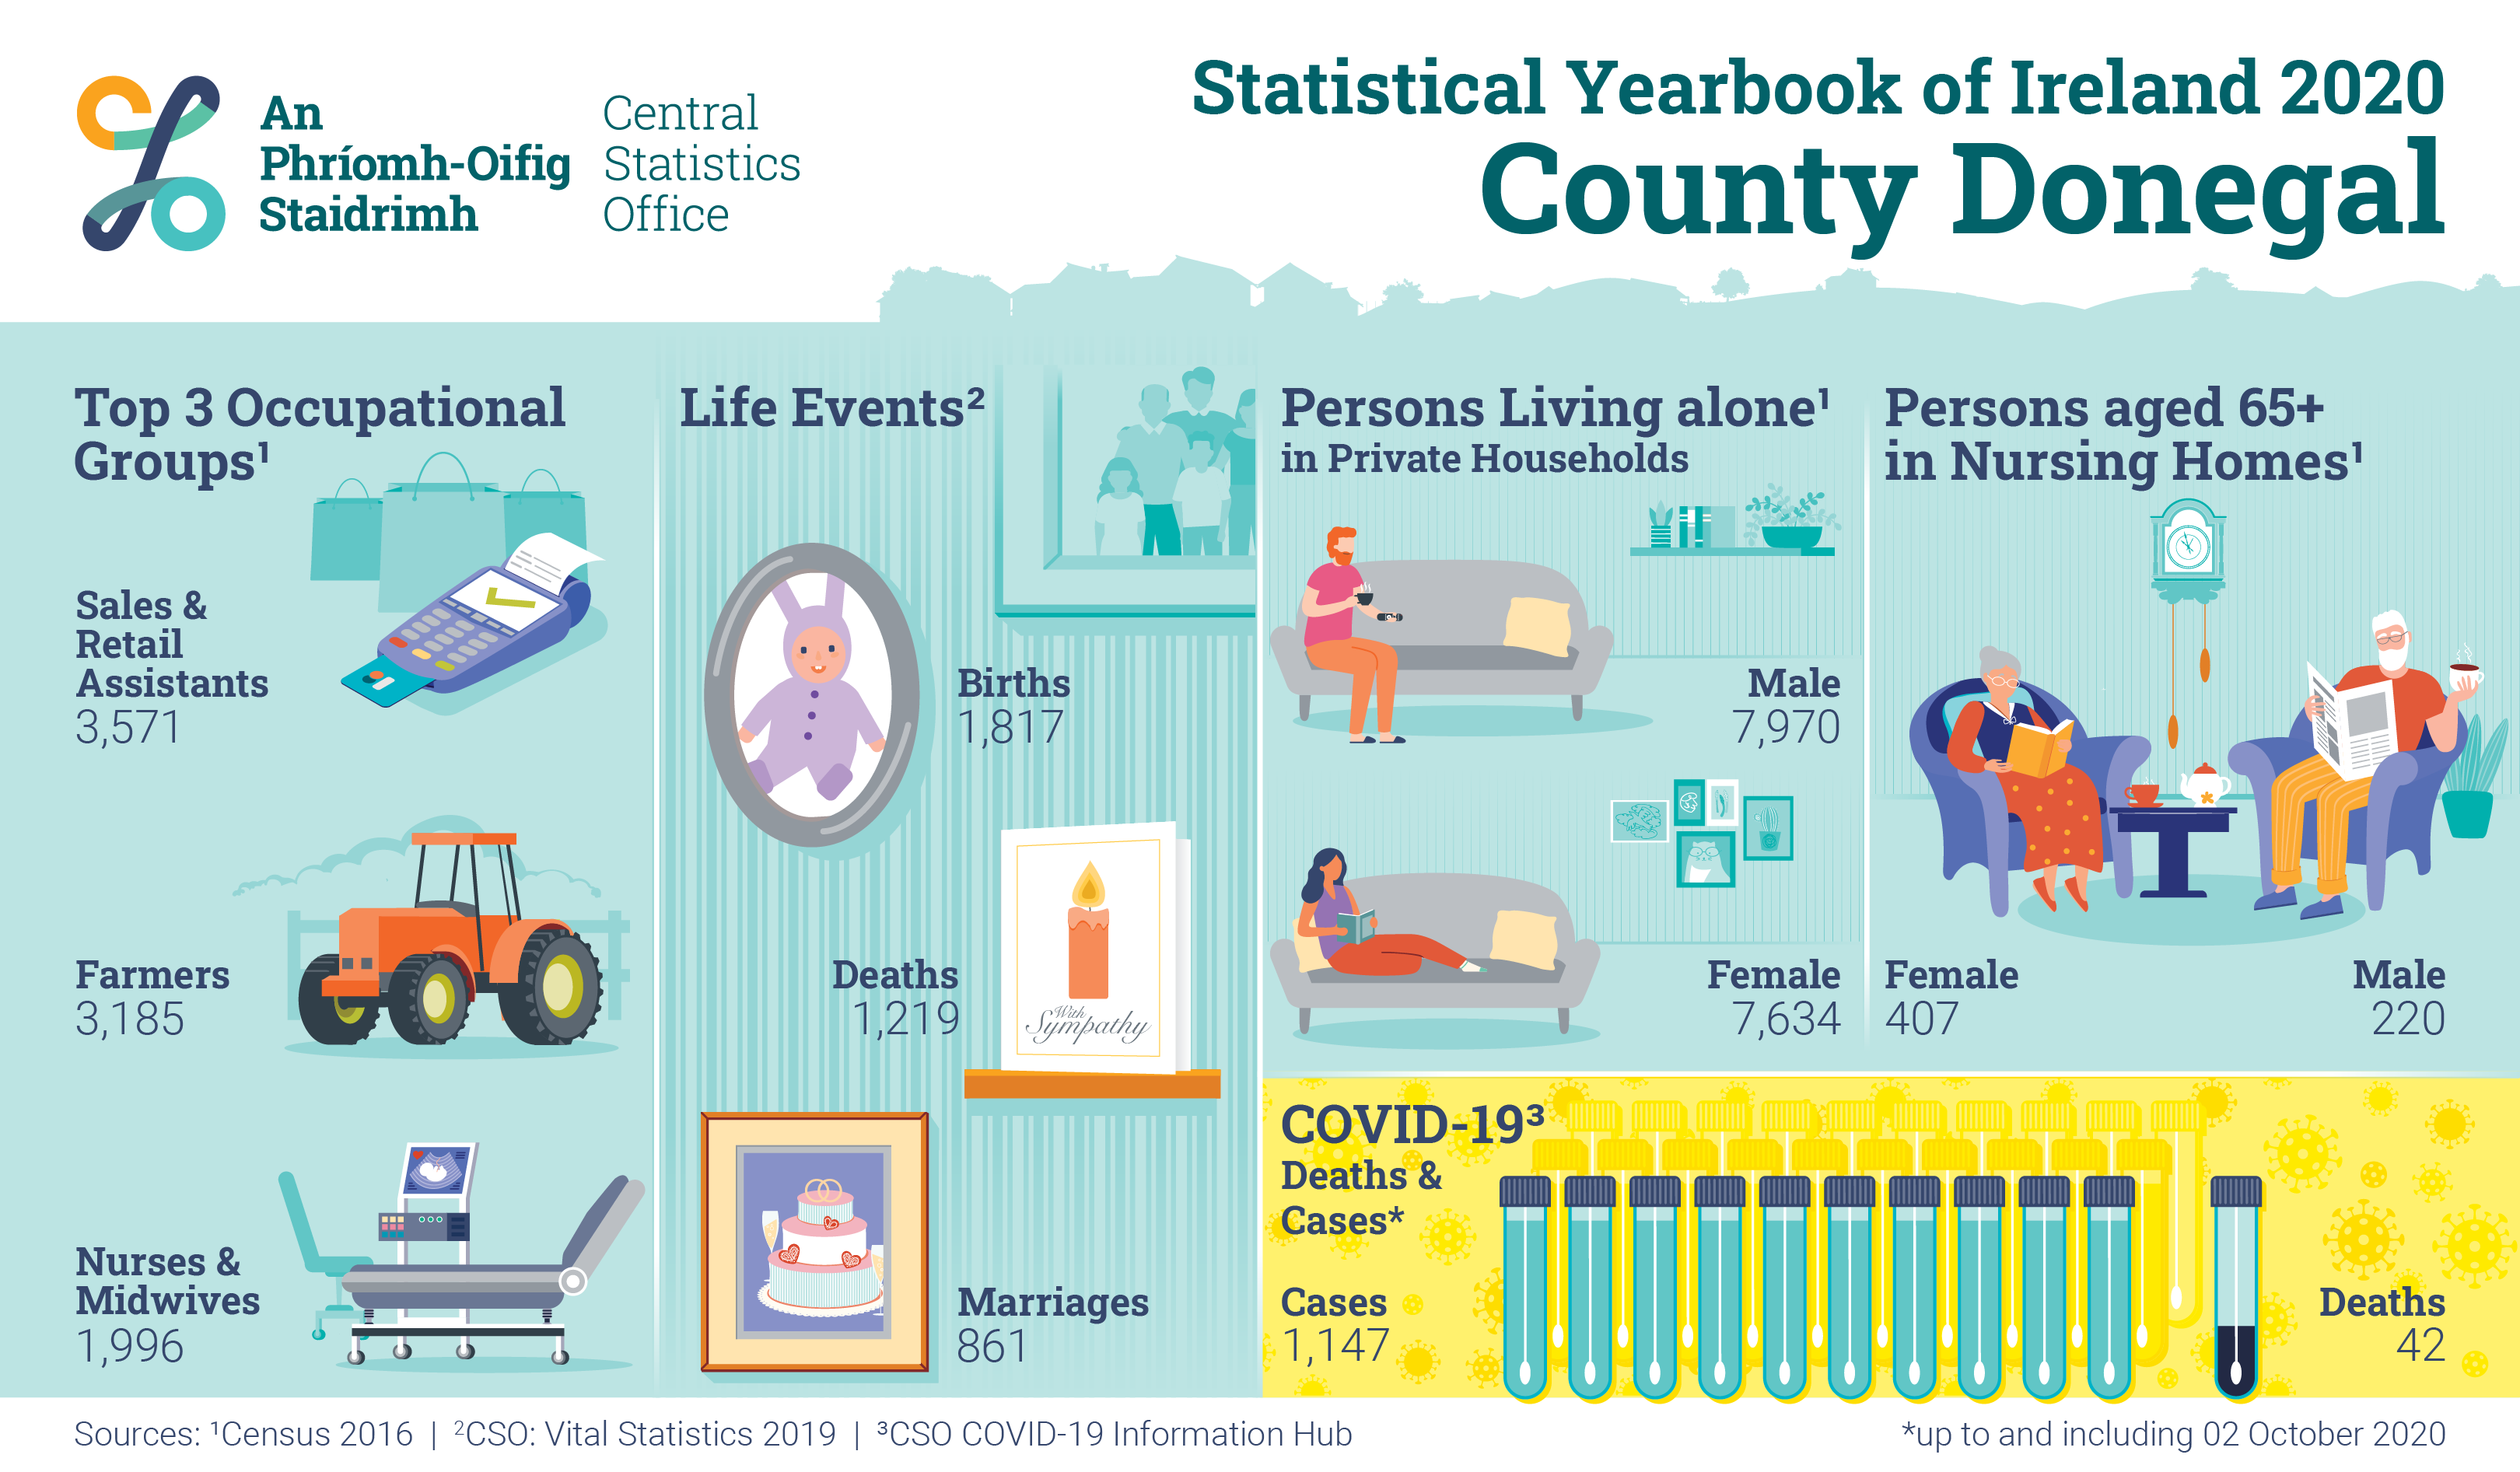
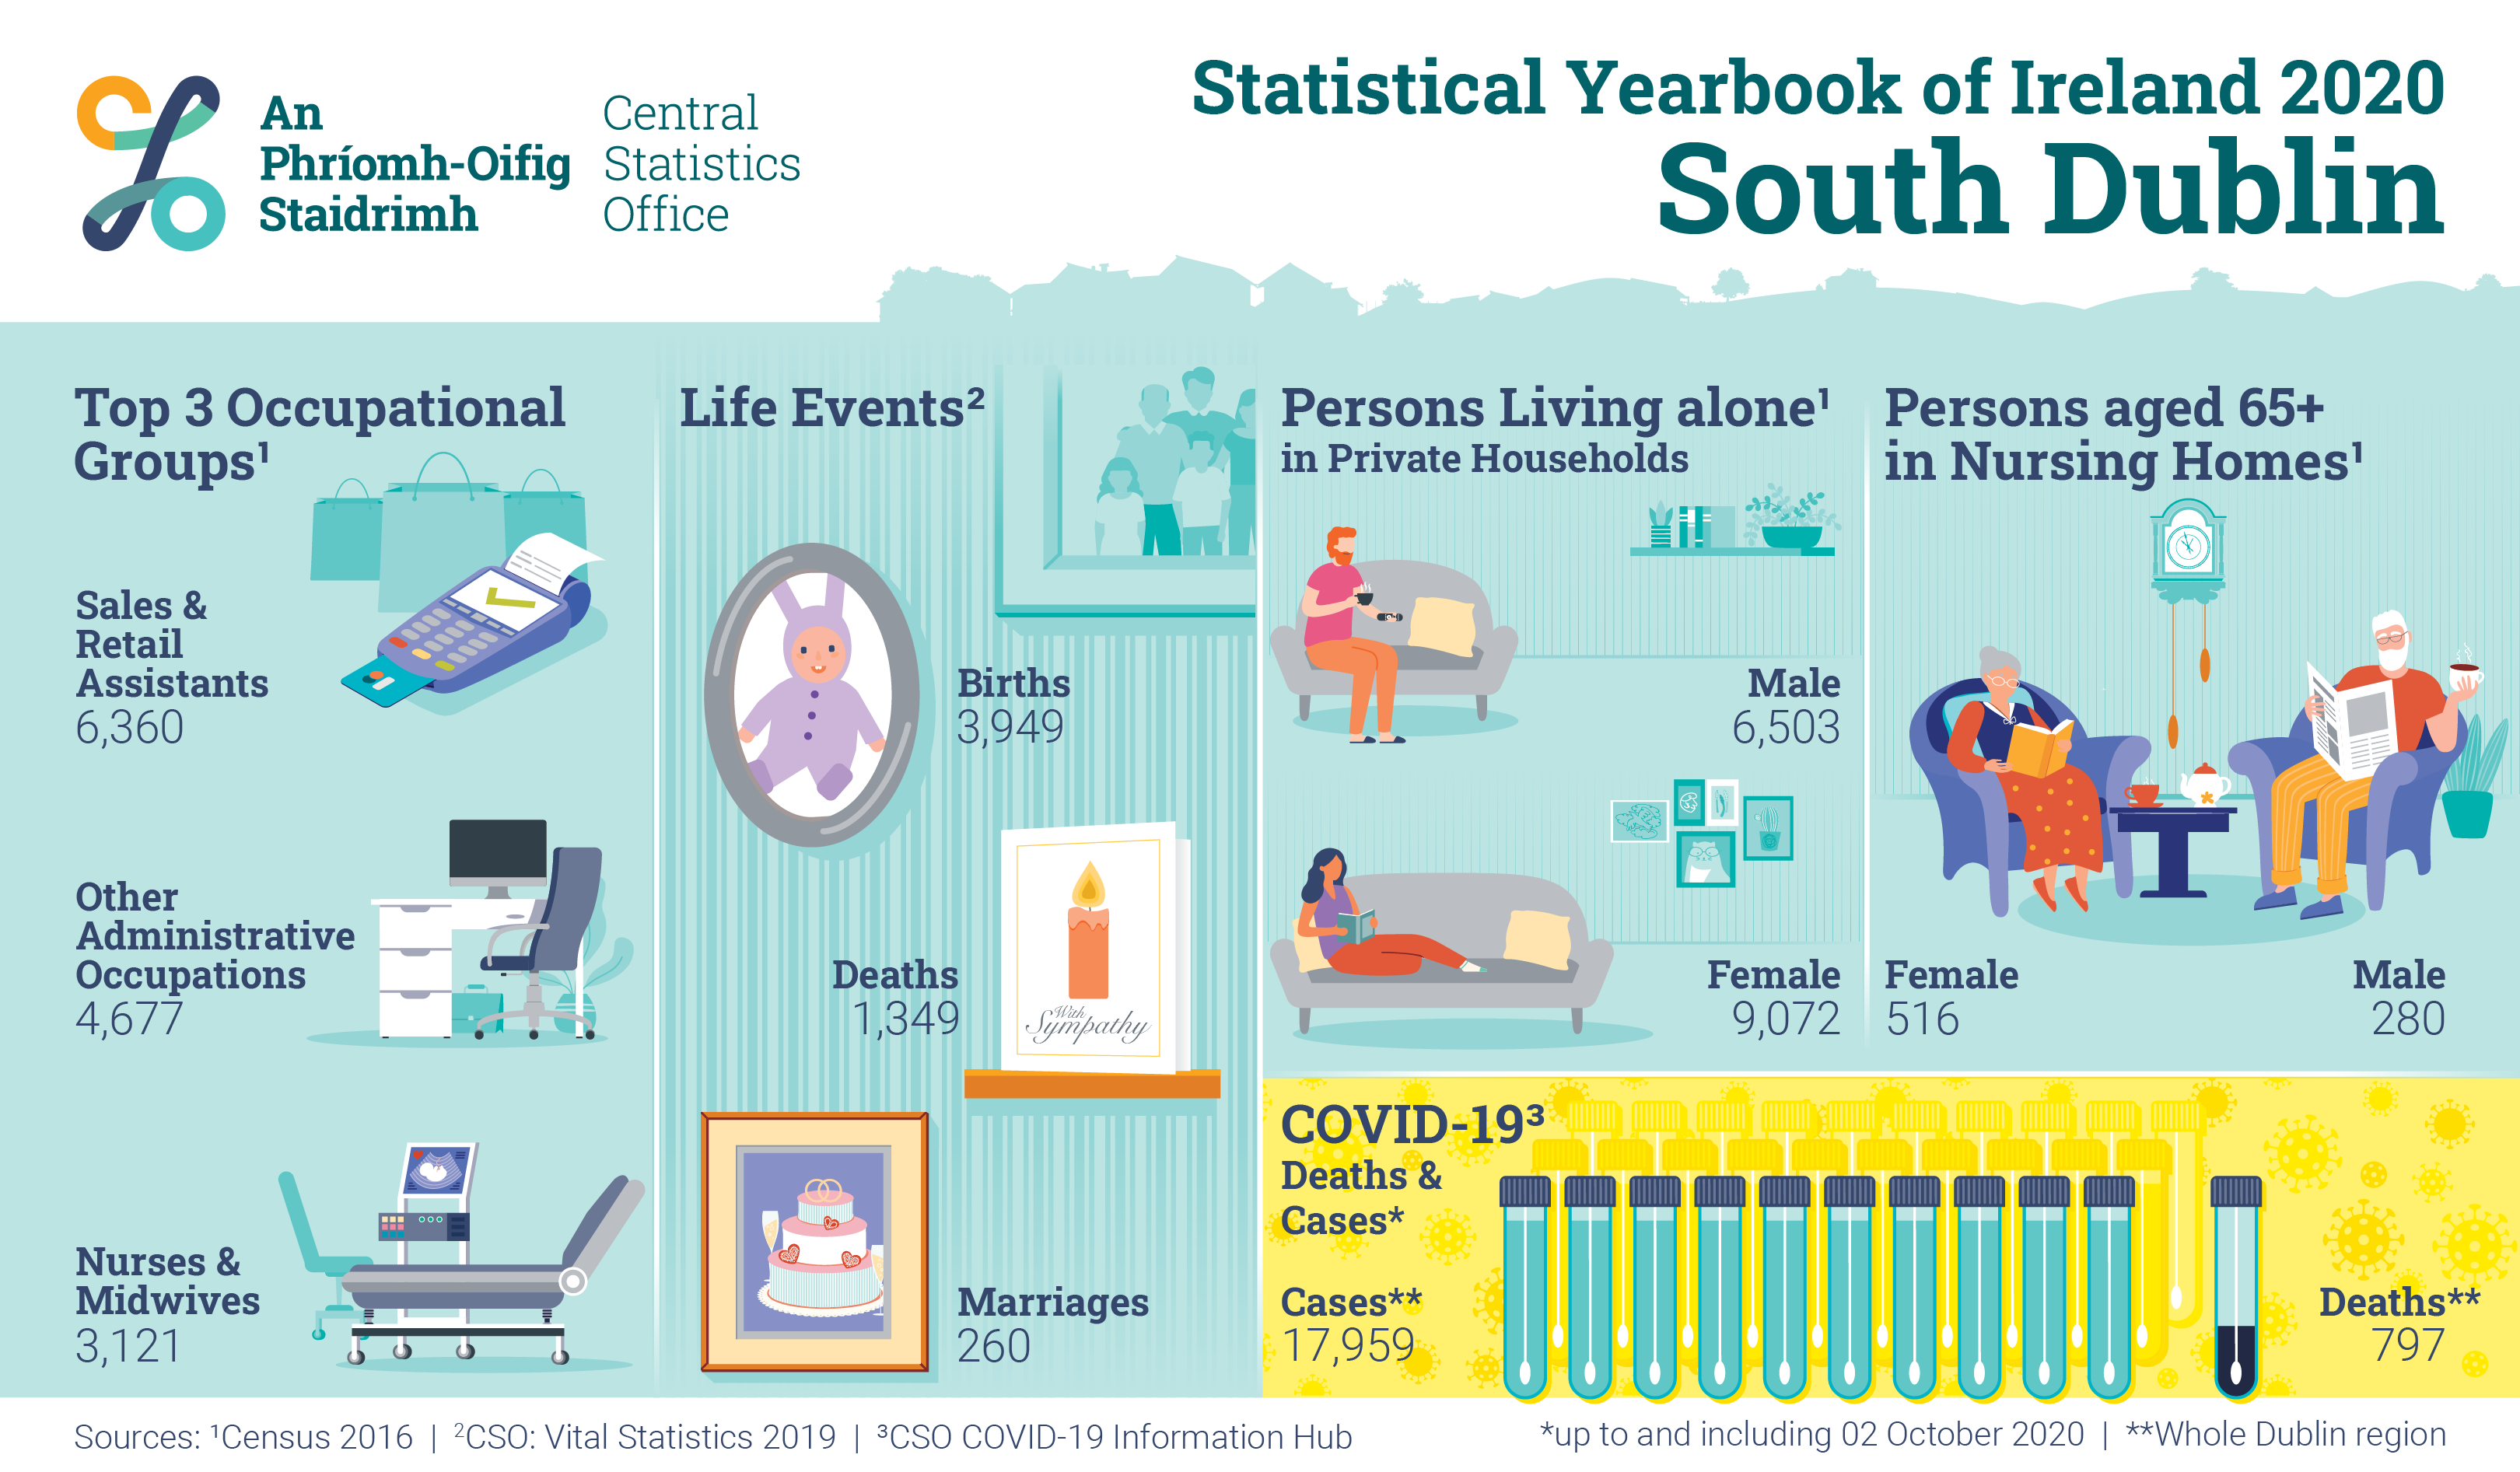
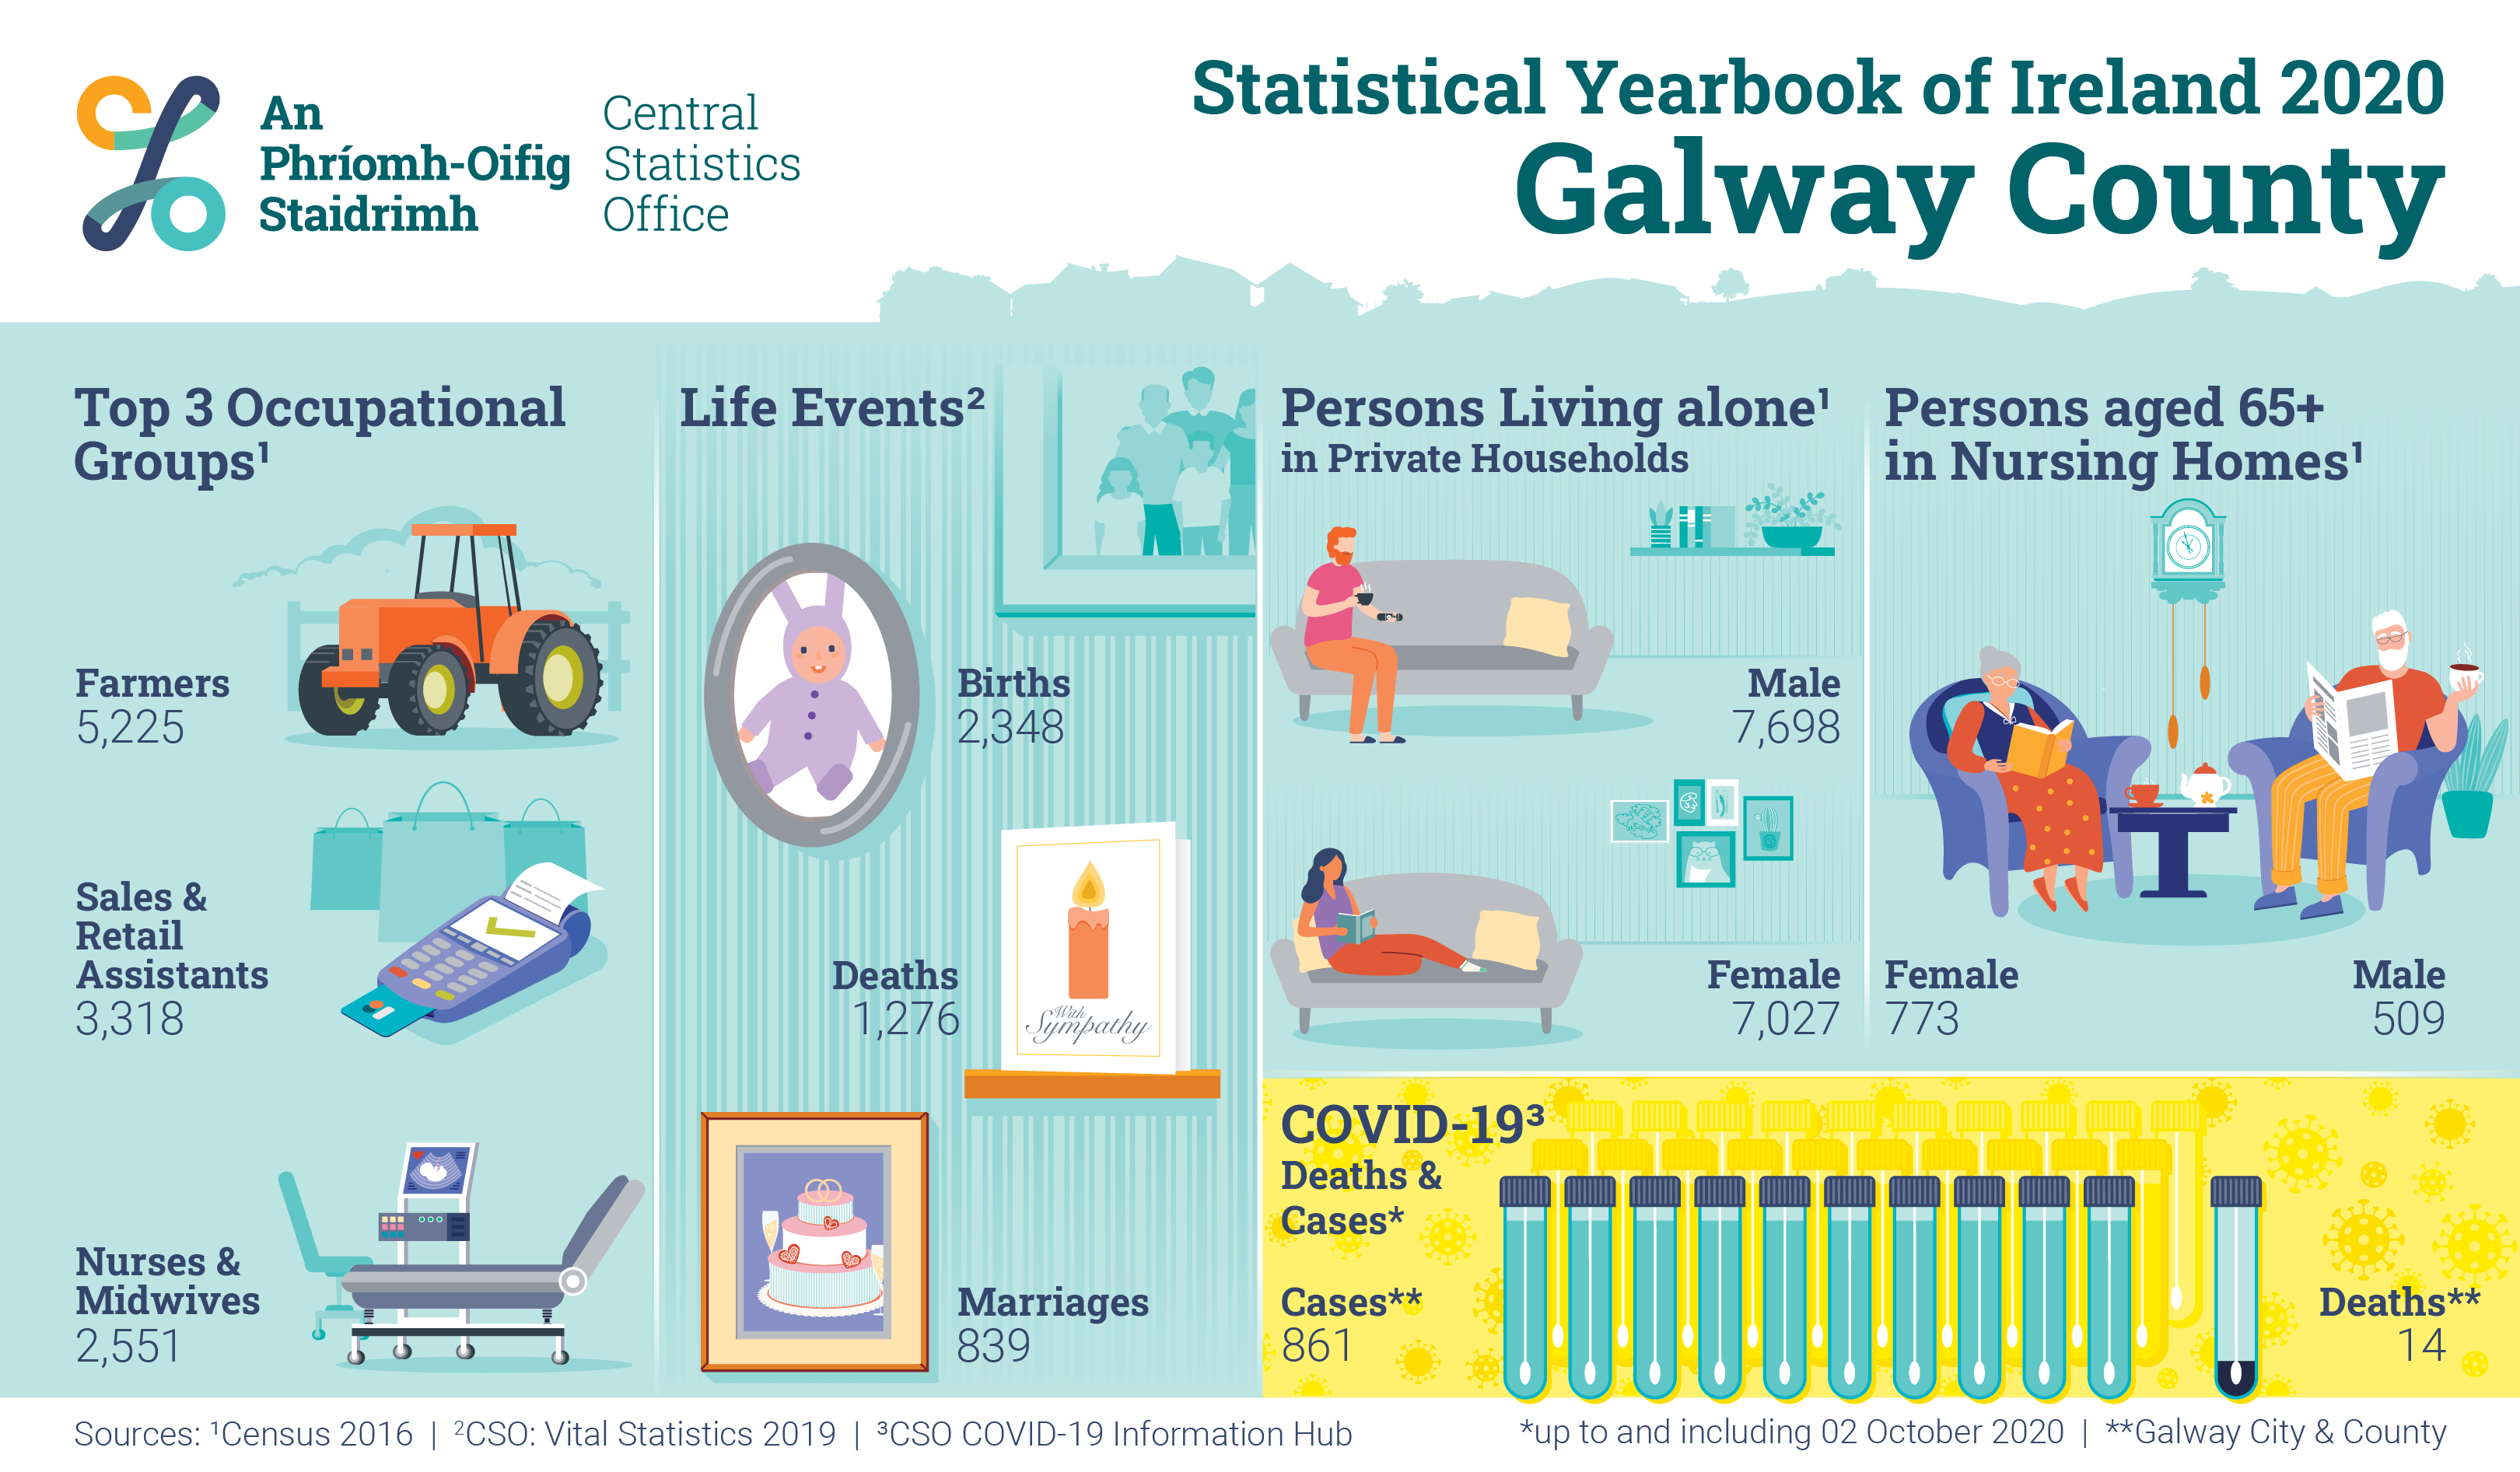
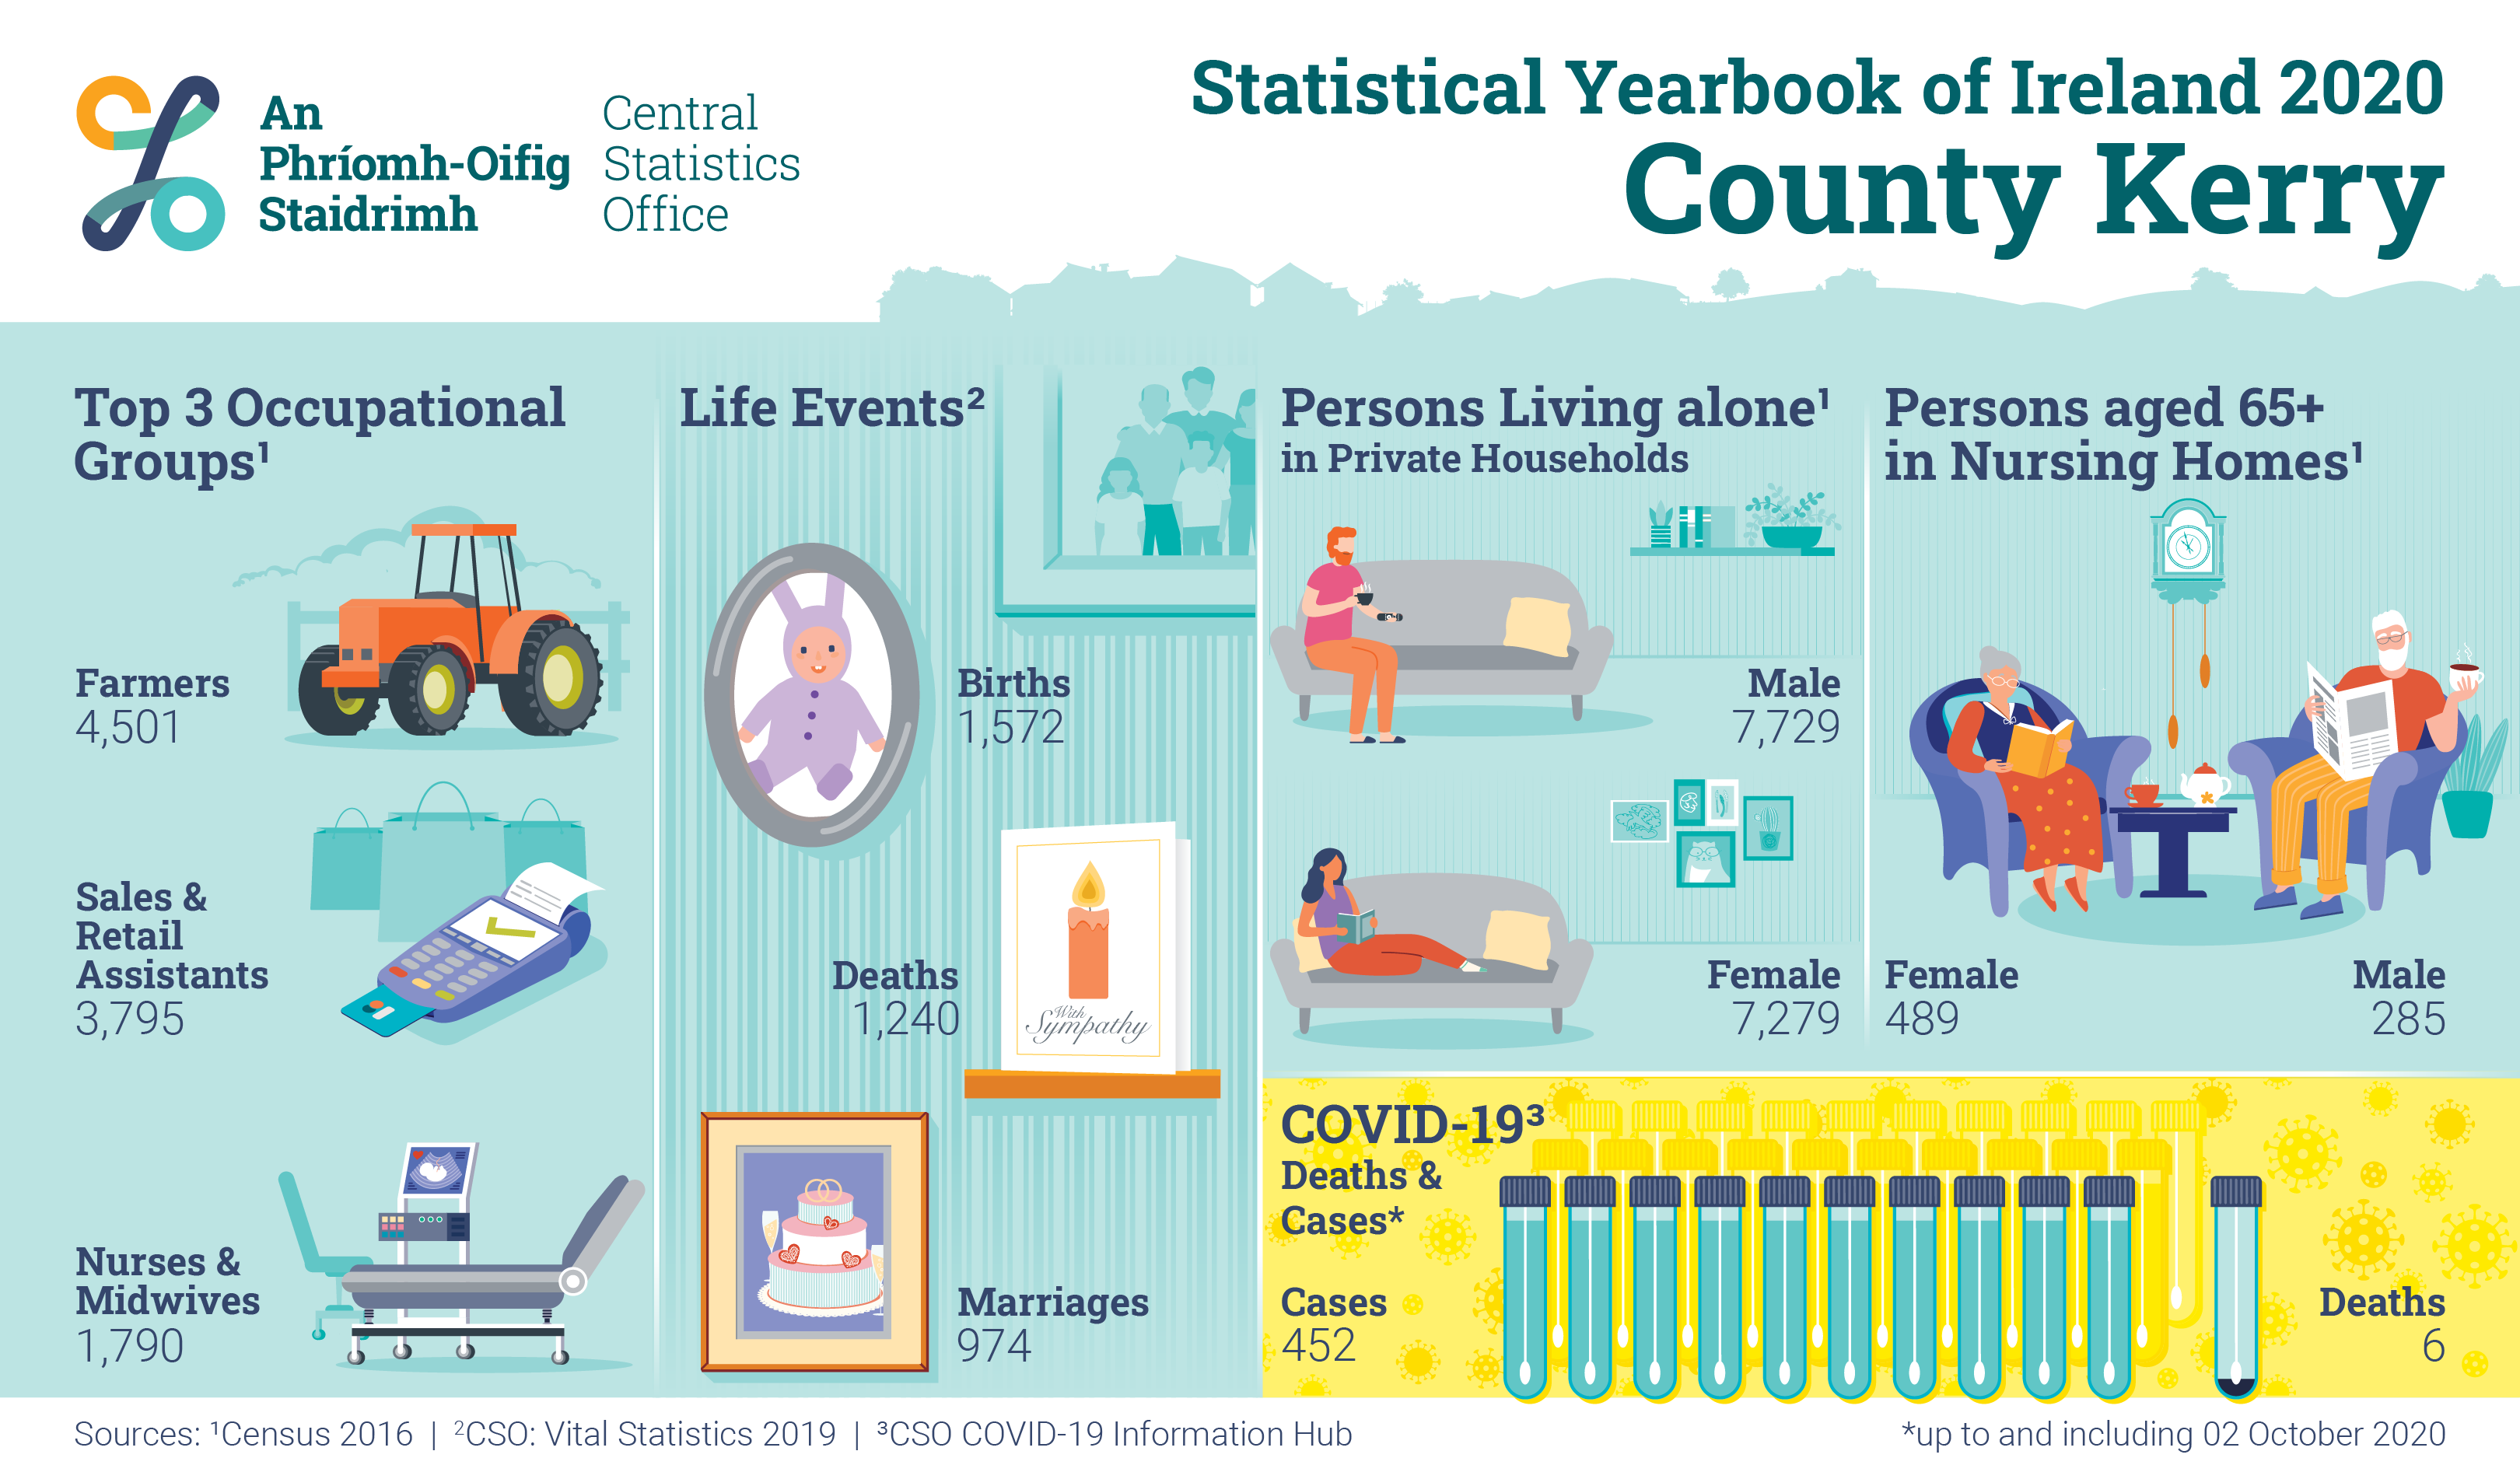
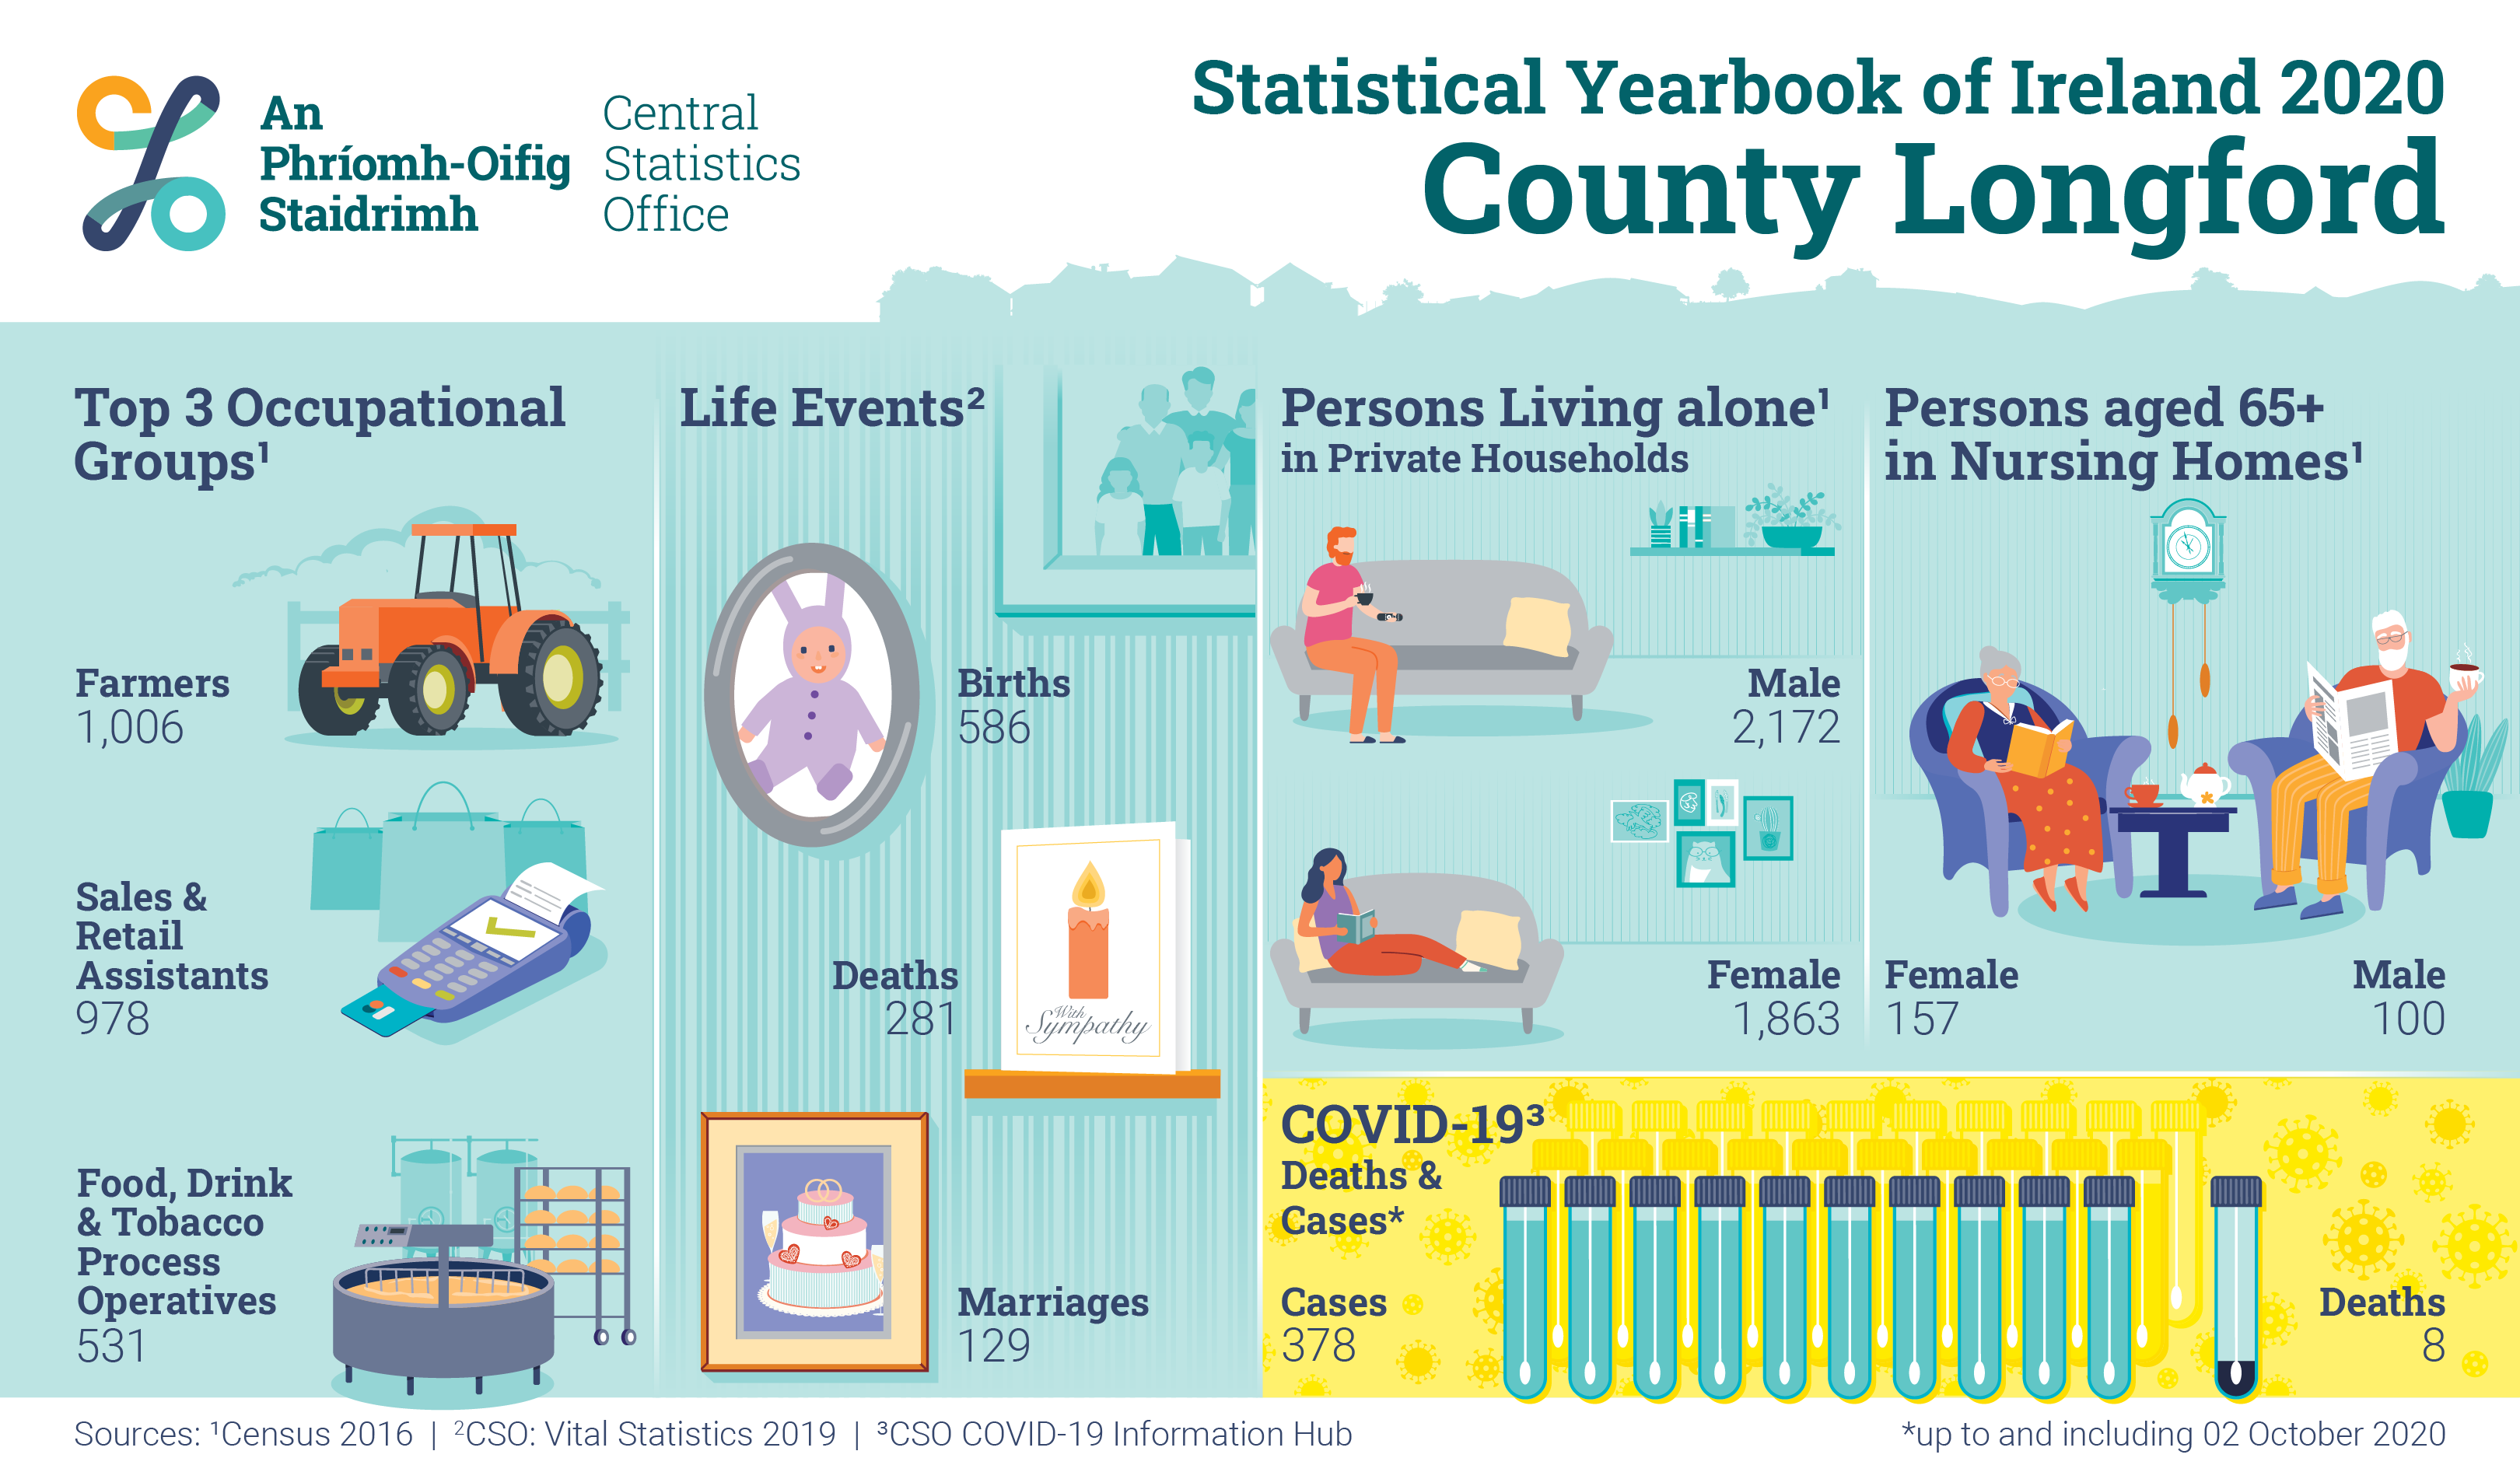
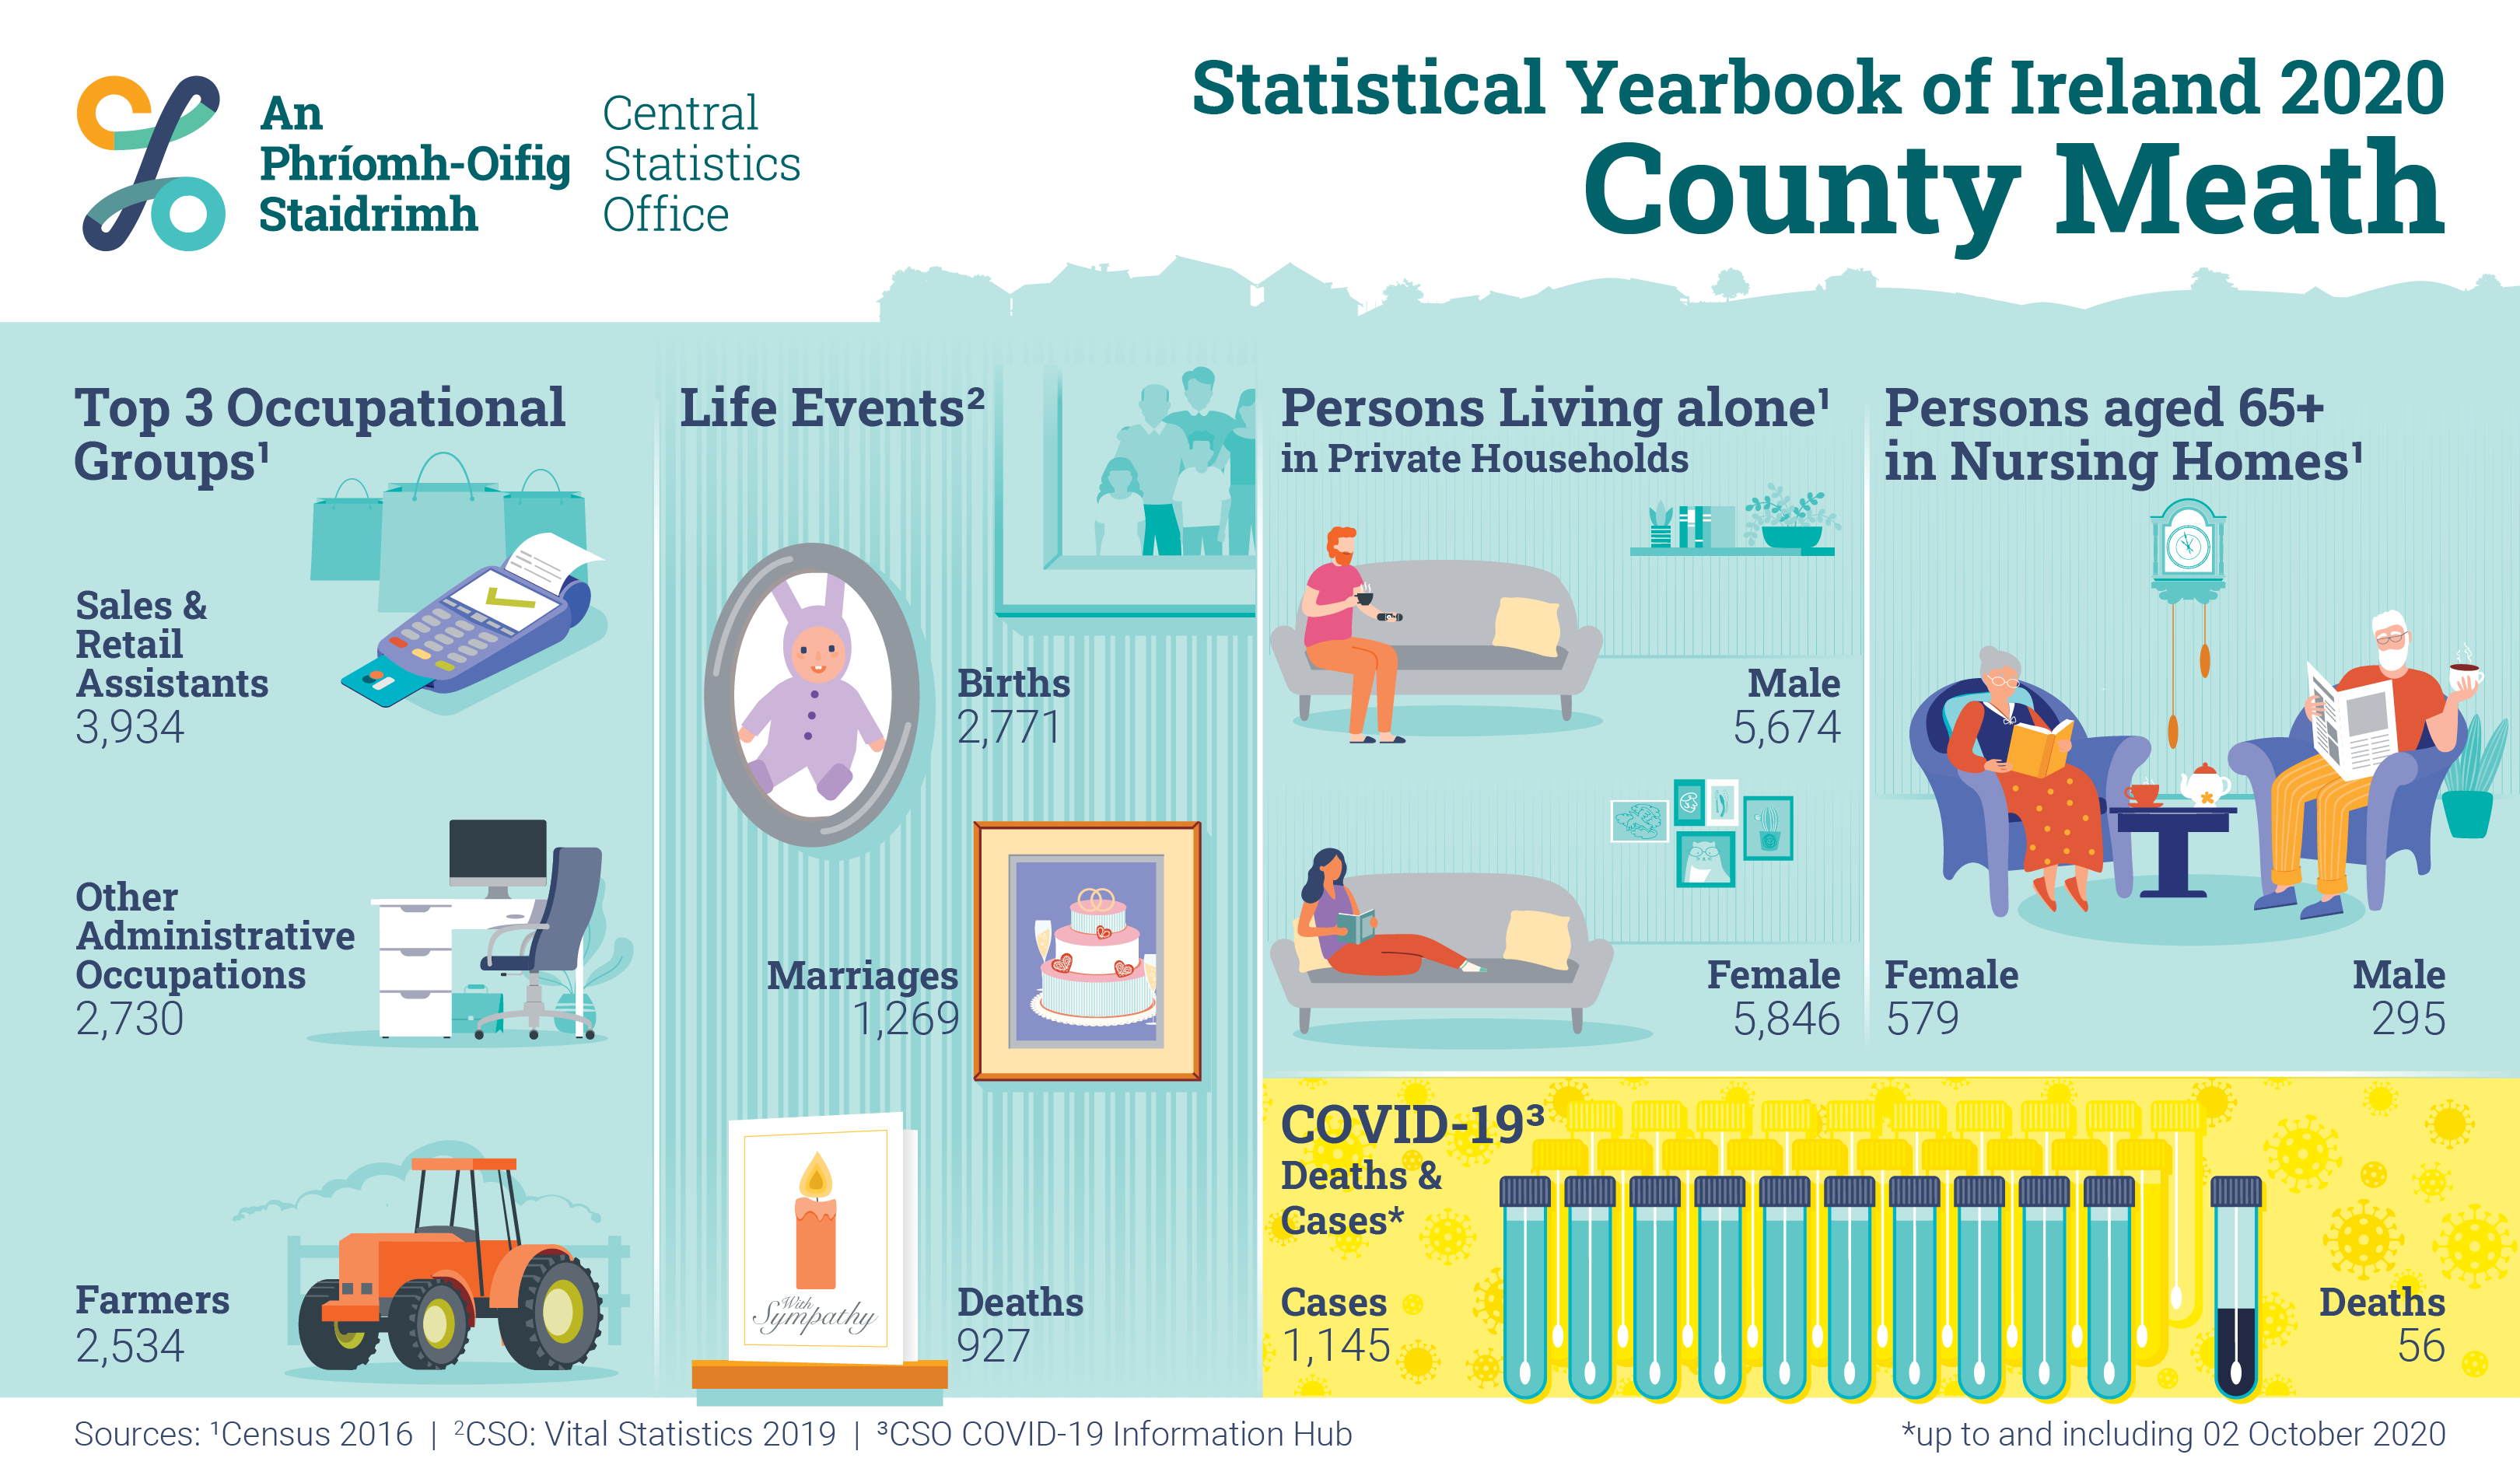
For this chapter we used Census 2016, Vital Statistics and COVID-19 data to create 27 county and city infographics plus the 4 Dublin regions. We have information on the Top 3 Occupational Groups, Persons living alone in private households, persons aged 65+ living in nursing homes, life events such as births, deaths and marriages, as well as information on COVID-19 deaths and cases. Watch the animation below to view every county in sequence or scroll down to view and download your county's infographic.
Find your county's profile below. Click to view larger or download to view and print.
Go to next chapter >>> Life Events
Learn about our data and confidentiality safeguards, and the steps we take to produce statistics that can be trusted by all.