

SDG 9.1.1 Proportion of the Rural Population who Live Within 2 Kms of an All-Season Road
SDG 9.1.2 Passenger and Freight Volumes, by Mode of Transport
SDG 9.1.1 Proportion of the rural population who live within 2 kms of an all-season road is indicated by data published by the CSO's Sustainable Developments Goals Division. Information on the Ireland's Road Network is published by the Department of Transport.
Regional and Local Road Network
The Department of Transport's Regional and Local Roads programme is important from economic, social and political perspectives. These roads serve an important economic role in the Irish context and also have valuable social and community functions. There are almost 94,000 kms of regional and local roads in Ireland, which accounts for 94% of the country's roads network and they carry around 55% of all road traffic. These roads are often the sole means of access for local economic activity.
These roads play a very important role in Ireland because of:
The network of regional and local roads provides mobility within and between local areas and provides vital links to the strategic national road network and the ports and airports which are our links with the wider European economy.
National Road Network
According to Our National Road Network the primary and secondary road network in Ireland is some 5,306 kms long and is made up of motorways, dual carriageways and single lane roads. Our network carries approximately 45% of the country's total road traffic and most of Ireland's freight is distributed by road. See Table 4.1.
Further information is available from the National Roads Network Indicators 2019 Report
Average distance to the Main Road Network
Average distances to the regional and local roads network is not available, however information on average distances to the main roads network has been calculated by the CSO, Sustainable Development Goals Division. The CSO publication titled ‘Measuring Distance to Everyday Services in Ireland’ shows the average distance of residential dwellings to the primary and secondary road network. The distances were calculated based on the Census of Population 2016 residential dwellings. Table 4.2 is taken form this report and shows the distance to the primary and secondary road network by county.
The average distance of residential dwellings in Ireland from the main road network (which accounts for 6% of the country's roads network) was 4.7 kms (excludes Regional and Local Roads Network). The nearest average distance to the main road network was 1.4 kms for Cork City dwellings, and the furthest was for Donegal residents at 8.7 kms. See Table 4.2 and Map 4.1.
State
Around 35% of the total population (over 1.65 million people) lived within 2 kms of the primary or secondary road network. People living within 5 kms of the main national road network accounted for 70% of the population, therefore only 30% of the population lived 5 kms or more from the main national road network.
The map shows the average distance to a main road network at county level.
Counties with the longest average distance to travel to a main road were:
1. Donegal = 8.7 kms
2. Leitrim = 8.6 kms
3. Cavan = 6.8 kms
Counties with the shortest average distance to travel to a main road:
1. Cork City = 1.4 kms
2. Galway City = 1.8 kms
3. Dun Laoghaire - Rathdown = 1.9 kms
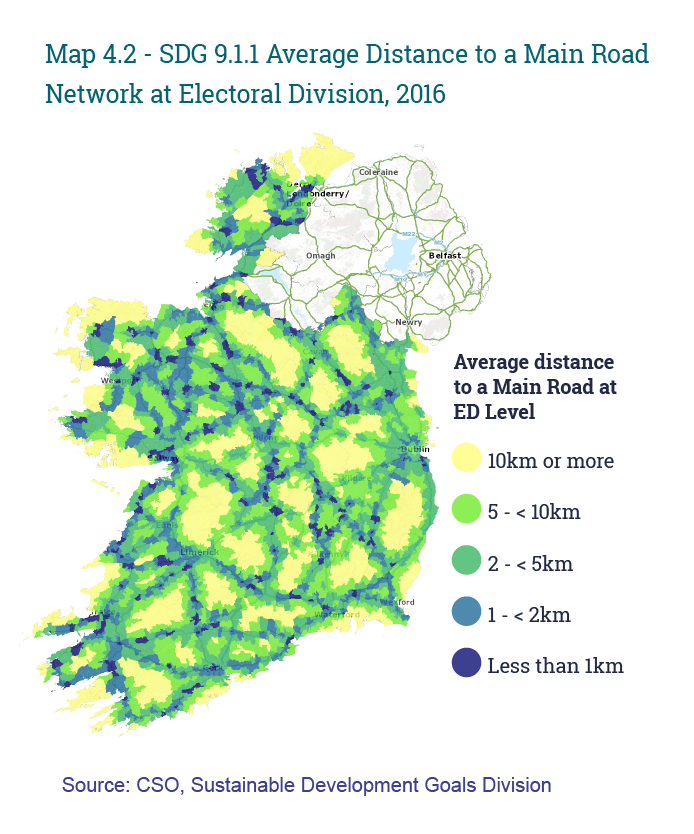
Electoral Division (ED) Areas
The SDG Data Hub gives a more detailed breakdown of distance to main roads at local level as indicated in Map 4.2, which shows the average distance to main road network at electoral division (ED) level across Ireland. The highest number of EDs were within the distance range of between 2-<5 kms from main road. There were 998 of the 3,409 EDs located at this distance range. See Map 4.2.
SDG 9.1.2 Passenger and freight volumes, by mode of transport is published by the CSO, Transport Division.
Passenger volumes by road, sea, rail and air are presented in this section.
Passenger Volume by Road
Following the re-introduction of Level 5 restrictions on 27 December 2020, car traffic volumes dropped significantly at the beginning of this year. However, in line with the gradual lifting of travel restrictions car traffic volumes increased over the first half of 2021. Latest available data for week 30 (week beginning 26 July 2021) show that car traffic volumes were 88.0% higher in Dublin and 119.2% higher in selected regional sites compared with week 1 of this year.
Current information on public transport volumes is published by the CSO Transport Division in their report titled 'Information on transport indicators during the COVID-19 period'. Additional information is also available from the CSO National Travel Survey and Transport Omnibus 2019.
According to Road Traffic Statistics the total number of vehicles rose from 2,593,375 to 2,790,778 between 2015 and 2019.
There were 2,168,099 private cars (78% of all vehicles) and 362,699 goods vehicles (13%) in 2019.
There were 47,072 million kms travelled in total in 2019. Private cars accounted for 35,453 million kms (75%), while goods vehicles accounted for 8,023 million kms (17%).
Each vehicle travelled 16,867 kms on average in 2019. Private cars travelled an average of 16,352 kms compared with 22,121 kms for goods vehicles. See Table 4.3 and Figure 4.1.
| Road Traffic Volume | No Entry Here | No Entry Here | No Entry Here | No Entry Here | No Entry Here | |
| Goods Vehicles | 362699 | |||||
| Tractors & Machinery | 84170 | |||||
| Other Vehicles | 72057 | |||||
| Small PSVs | 21457 | |||||
| Private Cars | 2168099 | |||||
| Large PSVs | 11206 | |||||
| Motor Cycles | 41471 | |||||
| Exempt Vehicles | 29619 |
Passenger Volume by Sea
According to the Maritime Statistics there were 2.6 million passengers moving through sea ports in 2019, down slightly from 2.8 million in 2015.
In 2019, most passengers (1.9 million) used Dublin port, with 0.6 million using Rosslare.
The numbers of inward and outward passengers were very similar in 2019, at about 1.3 million. See Table 4.4.
Passenger Volume by Rail
Figures from the CSO Rail Statistics show that the number of passenger journeys by rail rose from 39.7 million in 2015 to 50.0 million by 2019.
DART (Dublin Area Rapid Transit) journeys accounted for 43% of all passenger journeys by rail, followed by Dublin suburban services at 28% and mainline and other services at 26%.
Just 3% of all passenger journeys by rail were international. See Table 4.5.
Passenger Volume by Air
According to the CSO Aviation Statistics the number of passengers in airports rose from 29.7 million in 2015 to 38.1 million by 2019 before falling sharply to 8.3 million in 2020 due to the COVID-19 pandemic.
Most passengers use Dublin Airport. In 2019, 86% of all passengers were in Dublin, with 7% in Cork and 4% in Shannon. See Table 4.6.
The number of commercial flights in Ireland rose from 228,200 in 2015 to 273,600 by 2019 before falling sharply to 95,300 in 2020 due to the COVID-19 pandemic.
Most commercial flights use Dublin airport.
Dublin accounted for 84% of all commercial flights in 2019, while 8% were in Cork and 5% in Shannon. See Table 4.7.
Freight volumes by road, sea, rail and air are presented in this section.
Freight Volume by Road
According to the CSO Road Freight Statistics activity by road freight, measured as weight by distance, rose from 9.8 to 11.3 million tonne-kilometres between 2015 and 2020.
About 80% of this activity was on national journeys.
The quantity of goods transported by road rose from 118.1 to 141 million tonnes between 2015 and 2020.
About 95% of the freight carried by road during this period was on national journeys. See Table 4.8.
Freight Volume by Sea
The most recent Maritime Statistics from the CSO show that the tonnage of goods moving through Irish ports rose from 50.7 to 53.2 million tonnes between 2015 and 2019, before falling slightly to 51.4 million tonnes in 2020, partly due to the COVID-19 pandemic.
About half (49%) of the goods moved through Dublin port in 2020, with 18% in Shannon Foynes and 17% in Cork. See Table 4.9.
There were 51.4 million tonnes of goods handled by Irish ports in 2020.
Great Britain and Northern Ireland accounted for 39% of these goods, while 36% were with countries in the EU (excluding Ireland).
Goods received into Ireland accounted for 34.1 million tonnes, while 17.3 million tonnes of goods were forwarded from Ireland. See Table 4.10 and Figure 4.2.
| X-axis label | 2020 |
|---|---|
| Great Britain and Northern Ireland | 20040 |
| Other EU | 18643 |
| Non EU | 2144 |
| Other Ports | 8335 |
| Coastal Trade | 2202 |
Freight Volume by Rail
The CSO Rail Statistics shows the amount of freight traffic by rail rose from 540,000 tonnes in 2015 to 581,000 tonnes in 2016 before dropping back to 346,000 tonnes in 2019.
Activity by rail freight, measured as weight by distance, was 71.6 million tonne-kilometres in 2019. See Table 4.11.
Freight Volume by Air
The most recent Aviation Statistics shows that freight handled by Irish airports rose from 149,700 tonnes to 164,000 tonnes between 2015 and 2017.
The quantity of freight in airports then fell over each of the following three years, dropping to 157,400 tonnes in 2018, 145,900 tonnes in 2019 and 138,800 tonnes in 2020.
The COVID-19 pandemic, which started in early 2020, may have had some effect on the volume of freight handled in 2020. See Table 4.12.
Nearly 90% of the freight moving through Irish airports in 2020 was in Dublin.
Dublin handled 123,200 tonnes with 15,500 tonnes in Shannon. See Table 4.13.
Go to next chapter: Industry
Learn about our data and confidentiality safeguards, and the steps we take to produce statistics that can be trusted by all.