
Charting some of the changes in Ireland’s economic and social history to mark 50 years of Ireland in the EU.
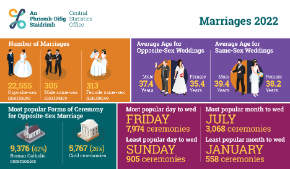
In 1973, there were 22,816 marriages registered over the year. While some 23,173 marriages took place in Ireland in 2022, this was just 357 more than the 1973 total. The 2022 marriages consisted of 22,555 opposite-sex marriages, 305 male same-sex marriages, and 313 female same-sex marriages.
The CSO now collects data on the popular days and months to get married. Friday was the most popular day to wed in 2022 with 7,974 ceremonies occurring on that day, while July was the most popular month with 3,068 ceremonies. Quarter 3 (July, August, September) 2022 had the most weddings with 8,046 ceremonies taking place in these months.
In 1973, the average age of grooms was 27.2 years, while it was 24.8 years for brides.
In 2022, the average age of brides and grooms in opposite-sex weddings was 37.4 years for males, and 35.4 years for females. Looking at same-sex weddings, the average age for males was 39.4 years and 38.2 years for females.
The first time that the ages of those marrying in this country were collected was part of the 1946 Census of Population.
At that Census, people were asked to state their date of marriage and a special analysis was made of 14,338 marriages which had taken place in the preceding 12 months.
Corresponding data have been available since 1957 from marriage registrations which has made it possible to analyse trends in age at marriage over the intervening period, which are summarised in the table.
Whereas, in 1945-46, 59% of the men who married were aged 30 years and over, the proportion over this age had fallen to 20.9 in 1973. In fact, the average age of men at marriage fell from 33.1 years in 1945-46 to 27.2 years in 1973.
In 1945-46, almost 33% of women marrying were aged 30 years and over compared with 12% in 1973. The average age at marriage for women also fell during this period, from 28.0 years in 1945-46 to 24.8 in 1973.
Same-sex marriage has been legal in Ireland since 16 November 2015, after the May 2015 referendum amended the Constitution of Ireland to provide that marriage is recognised irrespective of the sex of the partners. Ireland was the first country to legalise same-sex marriage on a national level by popular vote. Ireland is one of 14 EU Member States who have legalised same-sex marriage. The next will be Estonia in 2024. For a breakdown of same sex ceremonies by county and city, please click on the link to VSB10 in Table 2.5 below.
In 1973, of the 22,816 total marriages registered, 21,993 or 96% of marriages were Catholic ceremonies. The remaining 823 marriages registered were 491 Church of Ireland, 179 civil marriages, 113 Presbyterian, 25 Methodist, 12 Jewish, and three were from other religious denominations.
In 2022, while the most popular form of ceremony for opposite-sex couples was still a Catholic ceremony, it had dropped to 42% of all marriage ceremony types with 9,376 such marriages taking place. This was followed by a civil ceremony at 5,767 or 26% of all marriage ceremonies. The popularity of these two forms of ceremonies for opposite-sex couples has been in decline since 2014, when together they accounted for 87% of all marriage ceremonies.For a breakdown of opposite sex ceremonies by county and city, please click on the link to VSA44 in Table 2.6 below.
The remaining ceremony types for opposite-sex couples in 2022 were 2,200 Spiritualist Union, 284 Church of Ireland, 59 Presbyterian, 2,816 by other religious denominations, and 2,053 Humanist.
In 2022, a civil ceremony was the choice of 304 same-sex couples (49%). Humanist ceremonies accounted for 9% or 2,053 of all opposite-sex marriages and 17% or 104 of all same-sex marriages in 2022.
The rate for Catholic marriages in 1973 was 7.59 per 1,000 of the Catholic population. The rate for all other marriages combined was 5.39 per 1,000 of the population other than Catholic.
The rate for all marriages in 2022 was 4.5 per 1,000 population, 4.4 for opposite-sex marriages and 0.1 for same-sex marriages.
| % | |
| Roman Catholic | 96.3 |
| Civil Marriages | 0.8 |
| Presbyterian | 0.5 |
| Methodist | 0.1 |
| Jewish | 0.1 |
| Church of Ireland | 2.2 |
| % | |
| Roman Catholic | 40.5 |
| Civil Marriages | 26.2 |
| Humanist Association | 9.3 |
| Spiritualist Union of Ireland | 9.9 |
| Other Religious | 12.9 |
| Church of Ireland | 1.2 |
Learn about our data and confidentiality safeguards, and the steps we take to produce statistics that can be trusted by all.