
In the world economy, substantial investments are transferred daily between many different countries, a lot of which have different taxation systems and accounting practices. This reality necessitates a separation of funds going into economies, from funds that are intended as actual investment and those which are simply passing through. For a globalised economy like Ireland, these complex capital flows can sometimes lead to the interpretation of macroeconomic statistics being difficult. Therefore, it is becoming increasingly important to adopt new methods in FDI statistics to reduce globalisation effects. Continuing in the theme of experimental research, this chapter provides two methods to identify non-conventional FDI applied to balance of payments data: the special purpose entity (SPE) method and the pass-through method.
A special purpose entity (SPE) is a company set up for reasons that are beyond the production of goods and services; often they are established for financing purposes or to hold certain assets or liabilities. The present IMF guidance1 defines them as businesses which: have no more than five employees, very little production within their resident economy, have a foreign ultimate controlling parent, and have a high ratio of foreign assets relative to domestic. A question for many countries such as Ireland, the Netherlands and Luxembourg (countries which exhibit a large disparity in FDI figures with their European counterparts) is to what extent these types of firms may influence investment figures, making those figures more difficult to interpret. “The use of SPE structures has rocketed in a context of multifaceted and flexible multinational enterprise (MNE) structures, which have become increasingly global and seek to obtain benefits from different legal and tax regimes” (IMF SPE Task Force, 2018). In light of these factors, the EU and the OECD is encouraging member states to report more information on them.
| % of FDI Attributed to SPEs | |
| Luxembourg | 96.0152867856174 |
| Netherlands | 64.2617769990109 |
| Hungary | 46.3219436164341 |
| Denmark | 21.3611691939582 |
| Austria | 15.2442769402589 |
| Switzerland | 13.8374467015623 |
| Spain | 5.14046262577526 |
| Portugal | 5.10622985010766 |
| Iceland | 4.03367337726772 |
| Ireland | 3.77879436758284 |
| Norway | 3.63548051460918 |
| Estonia | 2.9701601906207 |
| Belgium | 2.43531383895654 |
| Lithuania | 1.58715247279162 |
| France | 0 |
| Germany | 0 |
| Greece | 0 |
| Poland | 0 |
Get the data: OECD Statistics
The SPE method defines the FDI activity within these entities as non-conventional investments that are merely passing through the host economy. Figure 10.1 shows that SPEs account for the majority of FDI for some countries such as Luxembourg and the Netherlands. For most EU countries however, the percentage of SPE based FDI is far lower. Some countries such as France and Germany report that none of their FDI can be attributed to SPEs. In Ireland 4% of FDI in 2018 can be attributed to SPEs based on the IMF definition. While the level of FDI coming into Ireland via SPEs is on par with most other EU countries on average, the fact that Ireland has high levels of FDI means their presence in our figures is relatively low when compared to other nations.
| SPE FDI Liabilities | Total Inward FDI | |
| 2013 | 11.533618266 | 300.732779453 |
| 2014 | 17.920250362 | 354.045426326 |
| 2015 | 27.781984261 | 817.580360577 |
| 2016 | 26.643202721 | 797.5208 |
| 2017 | 29.781502529 | 882.1712 |
| 2018 | 33.016917262 | 873.7421 |
As seen in Figure 10.2, SPEs operating in Ireland constitute a relatively small amount of FDI when compared to the rest of the international businesses established here.
| Percentage of FDI Attributed to SPE Firms | |
| 2013 | 3.83517163874799 |
| 2014 | 5.06156810100953 |
| 2015 | 3.3980738286562 |
| 2016 | 3.34075333470927 |
| 2017 | 3.3759323053167 |
| 2018 | 3.77879436758284 |
Figure 10.3 shows that SPE presence in Ireland has remained in between approximately 3-5% with the percentage standing at 4% in 2018. The decrease that occurs in 2015 is as a result of the large increase in total FDI positions for that year which was due to the financing of intellectual property in Ireland. SPE FDI actually increased in 2015 by approximately €10bn and has subsequently risen by approximately €5bn between 2015-2018. The difference in SPE activity for 2013 and 2014 compared with results published last year is as a result of an updated methodology in the collection of our SPE data.
| Top 25 | 25-50 | 50-75 | 75-100 | 100+ | SPEs | |
| 2013 | 57.8033206306813 | 20.0644047905918 | 11.5443777773303 | 7.7093818088143 | 2.87851499258228 | 3.83517163874799 |
| 2014 | 60.5614598842975 | 17.7387270975475 | 10.1414640706516 | 7.15163346697399 | 4.40671548052954 | 5.06156810100953 |
| 2015 | 71.949294055701 | 11.839467303786 | 5.48936799312447 | 3.72298869859477 | 6.99888194879378 | 3.3980738286562 |
| 2016 | 75.919029897248 | 11.9151255320759 | 5.95232014655008 | 4.00239623836215 | 2.21112818576387 | 3.34075333470927 |
| 2017 | 77.7840990639303 | 10.7533141178864 | 5.65038241993638 | 3.45993340820015 | 2.35227099004684 | 3.3759323053167 |
| 2018 | 70.7772415461903 | 12.9698377246971 | 6.60126515000148 | 4.02884722167192 | 5.62280835743925 | 3.77879436758284 |
As illustrated in Figure 10.4, the 25 firms that receive the highest amount of FDI in Ireland are responsible for the majority (70%) of Ireland’s FDI inward positions. In relation to the other stratified compilations of firms, the SPEs have a relatively low amount of FDI that is attributed to them.
The second method used to mitigate globalisation effects from FDI statistics involves estimating pass-through: foreign multinationals investing in their Irish affiliates which then subsequently invest in another economy. It has been shown globally that there exists a strong correlation between inward and outward FDI flows (Blanchard & Acalin, 2016)2. This suggests that FDI statistics are being inflated as investments flow through their economies instead of entering them. The result of this is that a highly globalised economy’s inward and outward FDI figures may be inflated.
Currently, there is no benchmark definition of pass-through FDI since it can come in different forms and largely depends on the level of operational activity within MNEs in an economy. For instance, although the SPE method is able to explain the large majority of FDI for Luxembourg and the Netherlands, it fails to explain a similar portion of Ireland’s FDI figures. This is because MNE activity in Ireland is quite different to that of Luxembourg or the Netherlands. Many multinationals here are non-financial enterprises, often with large employment; i.e. firms that fall outside the definition of an SPE. Therefore, pass-through activity in these regular operational enterprises may not be captured using the SPE method.
The method used in this publication to estimate pass-through FDI occurring in Ireland involves comparing a firm’s FDI assets and liabilities. The lower of these is then chosen and used as the estimate of pass-through FDI for that particular enterprise. The results are then aggregated to give an overall estimate of pass-through FDI in Ireland. The premise for this method is that it captures non-conventional FDI activity among all firms, not just SPEs. The method is formally shown at the end of this chapter and is based on pass-through analysis first introduced by Leino and Ali-Yrkko (2014)3.
| FDI Assets (left axis) | FDI Liabilities (left axis) | Pass-Through (left axis) | Pass-Through as a % of FDI Liabilities (right axis) | |
| 2012 | 613.491 | 591.626 | 316.48372416 | 53.4938836629898 |
| 2013 | 711.919 | 624.894 | 364.76757007 | 58.3727112230234 |
| 2014 | 912.372 | 756.712 | 441.10118868 | 58.2918189060039 |
| 2015 | 1325.798 | 1307.848 | 672.77091659 | 51.4410632267664 |
| 2016 | 1413.802 | 1398.684 | 766.02180039 | 54.7673241697195 |
| 2017 | 1363.344 | 1422.683 | 786.7074778 | 55.2974540217322 |
| 2018 | 1460.331 | 1510.572 | 894.84949615 | 59.2391157885887 |
Figure 10.5 shows this method applied to Irish FDI data. In 2018, pass-through FDI was estimated to be €894.8bn. For a better conceptual understanding of this figure, it can be viewed in terms of a percentage of FDI liabilities. In 2018, 59% of FDI liabilities are estimated to be pass-through. In order to view the presence of pass-through investment in Ireland’s inward FDI, reverse investment must first be removed from the pass-through estimate. This is because inward FDI figures are derived using the directional principle, which involves a netting process to remove reserve investment, whereas Figure 10.5 show's Ireland's FDI on an asset/liability basis (see: Two Methods of Measuring Foreign Direct Investment). Since reverse investment is likely to be captured in the pass-through estimate, it must be netted from the estimate to avoid double counting when viewing pass-through in relation to inward FDI.
| Pass-Through | Remaining Inward FDI | |
| 2013 | 75.157240483 | 225.57553897 |
| 2014 | 68.657035626 | 285.3883907 |
| 2015 | 263.140523867 | 554.43983671 |
| 2016 | 265.7597017 | 531.7610983 |
| 2017 | 298.98220747 | 583.18899253 |
| 2018 | 312.3619674 | 561.3801326 |
Using group-level data to capture pass-through that may occur in chains of subsidiaries, the pass-through estimate for 2018 becomes €949bn. After removing reverse investment, this estimate becomes €312.4bn, which represents 35.7% of inward FDI (directional basis); as shown in Figure 10.6.
| Table 10.1 Pass-Through Presence in Inward FDI | € billion | |||||
| 2013 | 2014 | 2015 | 2016 | 2017 | 2018 | |
| Pass-Through (net of reverse investment) | 75.2 | 68.7 | 263.1 | 265.8 | 299.0 | 312.4 |
| Inward FDI | 300.7 | 354.1 | 817.6 | 797.5 | 882.2 | 873.7 |
| Pass-Through presence in Inward FDI | 25% | 19% | 32% | 33% | 34% | 36% |
| Financial and Insurance Activities | Manufacturing | Scientific and Technical Activities | Information and Communication | Administrative and Support Services | |
| 2012 | 170.41345275 | 57.310125893 | 20.227854219 | 13.00660908 | 28.87570028 |
| 2013 | 168.06985458 | 81.691638345 | 31.007510721 | 15.266523777 | 38.185910623 |
| 2014 | 189.50084635 | 85.87431438 | 72.755378267 | 20.29480039 | 38.156758192 |
| 2015 | 219.37499985 | 143.30393499 | 175.01800884 | 28.099924302 | 83.423889415 |
| 2016 | 242.87614919 | 147.22539151 | 220.41657811 | 34.539081337 | 96.283649675 |
| 2017 | 170.71344879 | 139.18967256 | 177.27045003 | 178.8172491 | 90.147388842 |
| 2018 | 278.83997274 | 199.00913614 | 177.81357792 | 123.14758778 | 84.083678683 |
Figure 10.7 shows pass-through FDI by NACE classification, with FDI presented on an asset/liability basis. In 2018, financial and insurance activity enterprises engaged in the most pass-through activity with €278.8bn. However, some of the entities in this sector are merely the financial arm of the enterprise and may not represent the actual operating activity of the enterprise as a whole. Manufacturing enterprises followed second with €199bn.
| United States | Ireland | United Kingdom | Japan | France | Bermuda | |
| 2012 | 231.17132484 | 33.678936296 | 16.970469205 | 2.48353584 | 9.13956908 | 7.692366171 |
| 2013 | 267.85151254 | 36.587851319 | 20.875222647 | 7.550935636 | 10.379539777 | 8.020658466 |
| 2014 | 305.74535334 | 75.254236922 | 7.730554858 | 8.404728975 | 11.501009036 | 11.048864389 |
| 2015 | 428.57303501 | 170.87454456 | 16.249970549 | 12.512415434 | 11.233514841 | 11.326261701 |
| 2016 | 477.46004746 | 215.38154056 | 15.655353959 | 13.19023877 | 12.842483029 | 7.909829073 |
| 2017 | 528.01591523 | 177.04387794 | 14.752387702 | 12.76095731 | 12.414288284 | 9.830451625 |
| 2018 | 630.43820777 | 182.44259012 | 14.904643312 | 13.32354018 | 12.057945178 | 11.315872405 |
Figure 10.8 shows that firms with an ultimate controlling parent in the United States have engaged in the most pass-through activity, totalling €630.4bn in 2018 (again FDI figures here are presented on an asset/liability rather than directional basis, see Two Methods of Measuring Foreign Direct Investment). The estimated pass-through occurring in firms with an Irish ultimate controlling parent is mostly coming from redomiciled PLCs. These PLCs can have FDI liabilities coming from debt instruments such as loans and trade credits. Given that these firms have large outward FDI positions, the applied method will label their FDI liabilities as pass-through.
FDI Liabilities Breakdown
One procedure that can be applied to Ireland's FDI liabilities figure is to remove reverse investment and pass-through investment. Additionally, since the on-shoring of intangible assets, intellectual property and tangible fixed assets in the aircraft leasing sector further leads to difficulty in the interpretation of headline FDI figures in Ireland, the associated FDI financing of these assets can also be removed from our FDI liabilities. These features of MNE activity are seen to have a relatively small effect on the Irish economy, yet they contribute largely to Ireland's FDI figures.
The estimate for pass-through rises to nearly 63% of FDI liabilities when firm-level data is aggregated to group-level where possible to capture pass-through that may occur in chains of subsidiaries.
These estimates for pass-through activity are derived using FDI asset/liability data. However, when seeking to analyse the effect that FDI has on the economy, it is more precise to look at FDI figures presented using the directional principle which involves a netting process to remove reverse investment (see: Two Methods of Measuring Foreign Direct Investment). Since it is likely that some reverse investment is already captured in the pass-through estimate, applying the two methods separately is necessary so as to eliminate the possibility of double-counting.
| Reverse Investment | Pass-Through | Aircraft, IP + Intangible Assets | Remaining Inward FDI | |
| 2013 | 324.161320547 | 75.157240483 | 30.08559847 | 195.4899405 |
| 2014 | 402.666273674 | 68.657035626 | 62.007231512 | 223.381159188 |
| 2015 | 490.267739423 | 263.140523867 | 303.633771811 | 250.806064899 |
| 2016 | 601.1636 | 265.7597017 | 302.816083591 | 228.945014709 |
| 2017 | 540.512 | 298.98220747 | 330.12336667 | 253.06562586 |
| 2018 | 636.8297 | 312.3619674 | 348.832197607 | 212.547934993 |
Figure 10.9 displays Inward FDI with the removal of these features. The pass-through component here represents the amount over and above reverse investment to avoid double counting. Positions of intangible assets, IP, and aircraft were used as a proxy for the associated FDI financing of these assets. In 2018, after removing these elements from our FDI liabilities figure, inward FDI was €213bn. This figure can be interpreted as an estimate for inward FDI removed of globalisation effects and helps explain the investment in Ireland's capital stock (see: Estimates of the Capital Stock of Fixed Assets).
By removing these elements from our FDI figures it implies that they provide zero contribution to real economic activities in Ireland. However, it’s conceivable that pass-through funding could in some way create economic spill-overs that result in positive effects on the economy. This applies to the on-shoring of intangible and tangible fixed assets in the aircraft leasing sector where employment and earnings have increased substantially along with the increases in those assets. This is noteworthy if seeking to use the remaining inward FDI figure derived above to estimate the effect FDI has on the Irish economy.
Further Notes
Due to how the CSO classifies firms in the aircraft leasing sector, not all their financing investments are defined as FDI. Therefore, only tangible fixed assets financed by reported FDI in this sector are included in the 'Aircraft, Intangible Assets, & IP' component in Figure 10.9. This meant excluding a considerable amount of this sector’s fixed assets from the analysis. The excluded fixed assets in these firms are financed by other investments in the context of CSO internal classifications and therefore are not relevant to this experimental FDI analysis.
Pass-Through Estimation Method
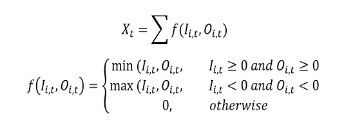
where Ii,t denotes inward FDI position of an enterprise and 0i,t is the outward FDI position.
Footnotes
1IMF SPE Task Force, 2018
2Blanchard, Olivier & Acalin, Julien (2016) “What does Measured FDI Actually Measure?”, Peterson Institute for International Economics
3Leino, Topias & Ali-Yrkko, Jyrki (2014) “How Well Does Foreign Direct Investment Measure Real Investment by Foreign-Owned Companies? – Firm-Level Analysis”, Bank of Finland Research Discussion Papers, vol. 12
Next Chapter >> Background Notes
Learn about our data and confidentiality safeguards, and the steps we take to produce statistics that can be trusted by all.