Your feedback can help us improve and enhance our services to the public. Tell us what matters to you in our online Customer Satisfaction Survey.
| Directional Presentation | Asset/Liability Presentation | |
| 2002 | 174.404 | 245.15772062 |
| 2003 | 176.435 | 270.494869721 |
| 2004 | 152.446 | 276.226521504 |
| 2005 | 138.62 | 354.579088283 |
| 2006 | 118.824 | 343.670782056 |
| 2007 | 138.362 | 378.774786249 |
| 2008 | 135.295 | 404.563422582 |
| 2009 | 173.61 | 467.478976972 |
| 2010 | 213.722 | 507.316618623 |
| 2011 | 224.511 | 536.974540093 |
| 2012 | 290.466 | 592.182 |
| 2013 | 296.411 | 620.344 |
| 2014 | 342.7 | 749.372 |
| 2015 | 795.644 | 1307.579 |
| 2016 | 796.474 | 1338.567 |
1. Introduction
This publication is intended to supplement the CSO’s current publications on Foreign Direct Investment (FDI) in Ireland and explain any differences found between FDI figures published by the CSO or other international organisations. The CSO publishes values of FDI using two internationally agreed methods. These two methods are the asset/liability presentation and the directional presentation. This publication will outline the differences between the methods, as well as identifying situations where the use of a particular method will provide a more accurate interpretation of FDI.
Section 2, describes the two methods of presentation used for FDI data. Section 3, describes the netting process used in the directional presentation. Section 4, describes situations where the use of a particular method is more appropriate. Section 5, quantifies the differences between FDI figures published by the CSO. Finally, this document ends with a brief conclusion in Section 6.
2. Asset/Liability vs. Directional Presentation
When compiling FDI data using the asset/liability method, assets are measured as total assets held by both Irish resident parent companies and affiliates. Likewise, liabilities are measured as total liabilities of both Irish resident parent companies and affiliates. This method is less detailed than the directional method as the direction of the direct investment relationship is not analysed, but it is useful when looking at the extent to which increased investment leads to higher or lower levels of assets and liabilities held by Irish resident parent companies and affiliates. It is also more appropriate when looking at the composition of Ireland’s assets and liabilities, which allows an evaluation of our exposure to crises. Figure 2 below, shows total FDI values for the period 2012-2016 using the asset/liability presentation.
| 2012 | 2013 | 2014 | 2015 | 2016 | |
| Direct Investment Assets | 614.02 | 712 | 917 | 1327 | 1386 |
| Direct Investment Liabilities | 592 | 620 | 749 | 1308 | 1387 |
| Direct Investment Net | 22 | 92 | 167.479 | 20 | -1 |
The directional presentation of FDI separates the data between inward foreign direct investment1 and outward foreign direct investment2. With this method direct investment abroad by Irish MNCs is measured as outward FDI. Direct investment in Ireland by foreign resident companies is measured as inward FDI. Importantly with this method, the country compiling the data does so on a net basis. The netting process will be explained in Section 3. As the Irish economy monitors large investments pass through the country, the netting process is especially important in analysing Ireland’s FDI relationship with the rest of the world.
The directional method also differs from the asset/liability method, as it allows for more detailed analysis by source and destination of FDI. For these reasons, directional presentation is the preferred method when providing detailed statistics by geography and economic activity. Figure 3 below, shows FDI calculations for the period 2012-2016 using the directional presentation.
| 2012 | 2013 | 2014 | 2015 | 2016 | |
| Direct Investment Abroad | 312 | 388 | 510 | 836 | 799 |
| Direct Investment in Ireland | 290 | 296 | 343 | 816 | 800 |
| Direct Investment Net | 22 | 92 | 167.479 | 20 | -1 |
3. The Netting Process in the Directional Presentation
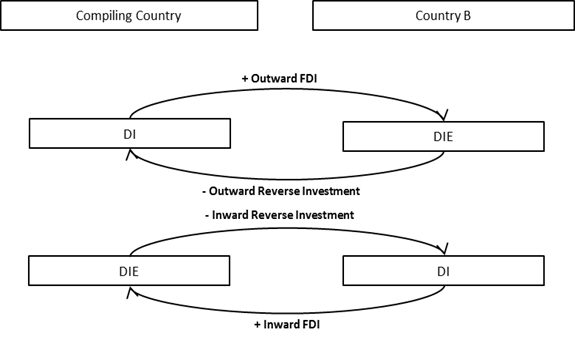
Conventional investment arises when a parent company, known as a direct investor3 (DI), lends funds to or acquires equity in a subsidiary, known as a direct investment enterprise4 (DIE). Reverse investment arises when a DIE lends funds to or acquires equity in its immediate or indirect DI5.
When FDI figures are presented using the directional presentation, reverse investment is taken into account in the netting process.
1. Reverse investment, in the form of both equity and debt instruments, is subtracted from the inward or outward investment figure in accordance with the direction of control. As an example, if a resident DI borrows money from its foreign DIE, this liability is subtracted in calculating the reporting country’s outward investment.
Equally, if a foreign DI borrows money from its resident DIE this asset is subtracted from the compiling country’s inward investment. This is illustrated visually below.

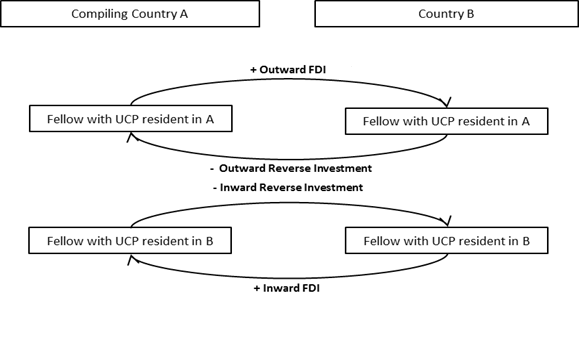
2. Under the ‘extended directional’ principle, the direction of the direct investment relationship between a sister company, known as a fellow enterprise6 (FE), and an Irish resident DIE is determined by the residency of their ultimate controlling parent (UCP). If the UCP is resident in Ireland, FDI is classified as outward investment. If the UCP is not resident in Ireland, FDI is classified as inward investment. Where investment flows in the opposite direction, from an FE in the country where the UCP is not resident to an FE in the country where the UCP is resident, it is subtracted from the outward and inward positions, respectively.

The largest netting occurs in the reverse investment of debt securities, i.e., DIEs lending to DIs. This is often observed where large Non-Financial Corporations (NFC) lend to other group companies where interest payments can be deducted from revenue in these countries, and reduce taxable profits.
4. Selecting the appropriate FDI presentation
When FDI values are presented using the asset/liability presentation, it allows for more accurate comparisons with other macroeconomic statistics published by the CSO, and other National Statistics Institutes (NSI) globally. This is because FDI values presented in this way follow the same logic as other statistical categories of investment found in the Balance of Payments and the International Investment Position. These other measures of investment include portfolio investment, reserve assets, financial derivatives, and “other” investment.
FDI values published using the directional presentation, however, are more useful when attempting to analyse the drivers of FDI and its effect on the Irish economy such as multinational exports. Given the more detailed nature of FDI values presented with this method, with breakdowns by country and region of foreign resident MNCs, this form of presentation makes it easier for researchers to identify the countries investing in Ireland. This method also breaks down investment by foreign resident MNCs by the sector of economic activity, allowing for more accurate analysis of the economic sectors that attract FDI into Ireland.
The CSO provides Irish FDI data to a number of international bodies. The data is provided quarterly on an asset/liability basis to the ECB, Eurostat, the OECD, the UNCTAD, and the IMF. The data is also provided on a quarterly basis using a directional presentation to the OECD and the UNCTAD. FDI figures are provided on an annual basis to Eurostat, the OECD and the IMF using a directional presentation.
Figure 4 below, shows the stock of direct investment in Ireland for the year 2016, with positions classified by the country of investor.
| Directional | Asset /Liability | |
| United States | 232.281 | 374.027 |
| Netherlands | 109.018 | 208.684 |
| Luxembourg | 68.849 | 171.827 |
| United Kingdom | 61.29 | 109.085 |
| Switzerland | 58.15 | 98.847 |
| France | 19.021 | 22.356 |
| Belgium | 9.569 | 22.395 |
| Spain | 8.132 | 11.263 |
| Italy | 7.68 | 9.451 |
| Canada | 2.17 | 3.549 |
| Japan | 2.145 | 5.881 |
| China | 1.872 | 2.821 |
This provides an example of where it would be less accurate to use the asset/liability presentation, and where the directional principal will result in more accurate analysis. The asset/liability presentation in this case would show higher stock figures for investment liabilities, which were actually reverse outward investment. As a result, analysis of direct investment in Ireland using the asset/liability presentation could produce misleading results.
5. Example of Differences Found in FDI Values Published by the CSO
One of the clearest examples of where differences arise in FDI values published by the CSO can be found when comparing FDI figures found in the CSO’s International Investment Position release and the CSO’s Institutional Sector Accounts release. FDI figures found in the International Investment Position are compiled using the directional presentation, while FDI figures compiled in the Institutional Sector Accounts use the asset/liability presentation. These FDI estimates are presented in Table 1 below.
| Table 1: FDI presentations in CSO releases | €bn | ||||
| IIP (Directional) (Published) | IIP (Asset/Liability) | ROW Financial Account (Published) | |||
| Total Foreign Assets | 4,367 | Total Foreign Assets | 4,955 | Total Foreign Assets | 4,954 |
| of which FDI (abroad) | 799 | of which FDI (asset) | 1,386 | ||
| Total Foreign Liabilities | 4,851 | Total Foreign Liabilities | 5,440 | Total Foreign Liabilities | 5,439 |
| of which FDI (in Ireland) | 800 | of which FDI (liability) | 1,387 | ||
| Total (Net IIP) | -485 | Total (Net IIP) | -485 | Total (Net IIP) | -485 |
| of which FDI (Net) | -1 | of which FDI (Net) | -1 | ||
Although both presentations provide differing values for investment positions, flows and earnings, they are identical in terms of net FDI. This can be seen in Table 1 above.
The €588 billion difference between Total Foreign Assets in the International Investment Position release and Total Foreign Assets in the Institutional Sector Accounts is almost entirely as a result of the different methods used to present FDI figures. When the International Investment Position is presented using the asset/liability presentation the difference falls to less than €1 billion.
6. Conclusion
Differences in FDI figures published by the CSO and other international organisations can be explained by whether these figures are being reported with the asset/liability presentation or the directional presentation.
As well as explaining the different ways in which FDI figures are calculated using each method, this document also briefly discussed situations in which each method of presentation is best used for the purpose of analysis.
____________________________________________________________________________________________________________________________________________________________________________________
1 Investment originating abroad, resulting in the establishment by a non-resident direct investor of a direct investment enterprise resident in the compiling economy
2 Investment originating in the compiling economy, resulting in the establishment by a resident direct investor of a direct investment enterprise abroad
3 An entity or group of related entities that is able to exercise control or a significant degree of influence over another entity that is resident of a different economy (IMF, 2009)
4 An entity which is subject to control, or a significant degree of influence, by a direct investor (IMF, 2009)
5 Provided it does not own equity comprising 10% or more of the voting power in that direct investor
6 Enterprises that are under the control or influence of the same immediate or indirect investor, however, neither fellow enterprise controls or influences the other fellow enterprise (IMF, 2009)
Joseph O'Connor (+353) 1 498 4115
Christopher Sibley (+353) 1 498 4305
Learn about our data and confidentiality safeguards, and the steps we take to produce statistics that can be trusted by all.