
Compensation of Employees (COE) is defined as the total remuneration, in cash or in kind, payable by an employer to an employee in return for work done. COE is made up of the following components: (a) wages and salaries and (b) employers’ social contributions. Wages and salaries in cash include gross pay including overtime, bonuses, commission, tips, holiday pay and allowances. Wages and salaries in kind include free or subsidised canteens, discounts on company products, company car, car parking, free travel, gym membership, child care for the children of employees, bonus shares and loans to employees at reduced rates of interest.
Further information available at Compensation of Employees.
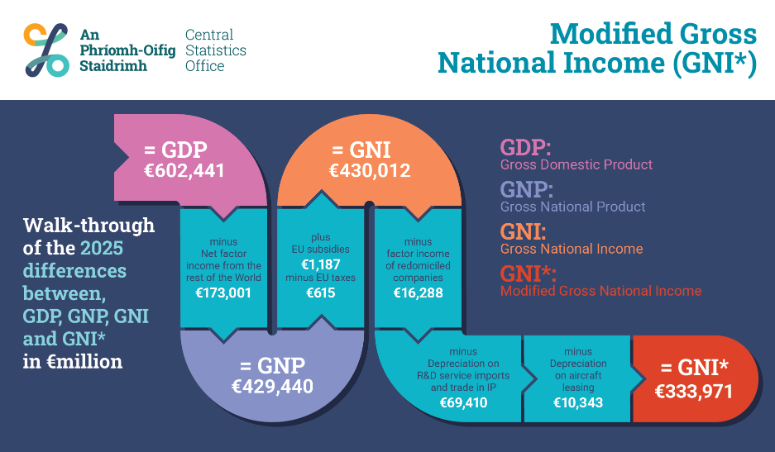
Gross National Income (GNI) is equal to Gross National Product at market prices plus EU subsidies less EU taxes. This is more commonly described as being equal to Gross Domestic Product (GDP) plus net primary incomes from abroad. GNI gives a more precise picture of the national economy compared to GDP.
Further information available at Gross National Product (GNP) and Gross National Income (GNI)
Modified Gross National Income (GNI*) is equal to Gross National Income at market prices less the factor income of redomiciled companies, less depreciation on R&D service imports and trade in IP and less depreciation on aircraft related to aircraft leasing. It is an indicator designed specifically to measure the size of the deglobalised Irish economy.
Further information available at Modified GNI.
NACE is an acronym derived from the French title 'Nomenclature générale des Activités économiques dans les Communautés Européennes'. The NACE classification of economic activities in the European Community is used for a wide variety of European statistics in the economic, social, environmental, and agricultural domains.
| Sector | NACE Rev. 2 (A10) code | NACE Rev. 2 (2-digit) code |
|---|---|---|
| Agriculture, Forestry & Fishing | A | 01-03 |
| Industry (excluding Construction) | B, C, D, E | 05-39 |
| Construction | F | 41-43 |
| Distribution, Transport, Hotels & Restaurants | G, H, I | 45-56 |
| Information & Communication | J | 58-63 |
| Financial & Insurance Activities | K | 64-66 |
| Real Estate Activities | L | 68 |
| Professional, Admin & Support Services | M, N | 69-82 |
| Public Admin, Education & Health | O, P, Q | 84-88 |
| Arts, Entertainment & Other Services | R, S, T | 90-98 |
Further information available at NACE - Classification of Economic Activities.
Foreign-owned MNE dominated sectors include:
Further information available at Gross Value Added for Foreign-Owned Multinational Enterprises.
The value of some good or service is made up of two components: its volume and its price. As we observe the change in value of this commodity over time, this is typically a result of both a change in volume sold and a change in price. Current prices refer to the prices that goods and services were sold at in that year.
A time series of COE from 2011 to 2025 at current prices obscures what is the main driver behind this change: is COE generally increasing from year to year because there are more people employed and/or employees are working more hours i.e. increase in volume? Or is COE increasing because of changes in labour costs per hour i.e. increase in price?
Further information available at Current and Constant Prices.
Measuring COE at constant prices removes the effect of year-on-year price changes and presents COE as a measure of labour input i.e. volume which is largely dependent on total hours worked as well as labour quality. COE at constant prices is computed via a process called chain-linking which accounts for year-on-year changes in price using a chain-linked reference year. In the CSO, our chain-linked reference year is set 1 year before the most recent Annual National Accounts (ANA) release. For example since ANA 2025, the chain-linked reference year has been set to 2024.
A COE time series at constant prices with a reference year of 2024 is akin to presenting the value of COE at each year in the series at 2024 prices. Thus, the change that we observe in the CoE at constant prices series is due to a change in volume i.e. total hours worked as well as labour quality.
Further information available at Current and Constant Prices and Chain Linking.
Say that we were interested in the year-on-year price change in COE. Below we define a Compensation Price index as a ratio of COE prices from the chain-linked reference year (used to find the series COE at constant prices) to year = i:
| Compensation Price Index (year=i) = 100 | x | COE in current prices (year = i) |
| COE in constant prices (year = i) |
This is defined similarly to the GDP deflator, used to show average price changes from the chain-linked reference year to year = i:
| GDP deflator (year=i) = 100 | x | GDP in current prices (year = i) | -100 |
| GDP in constant prices (year = i) |
Further information available at Gross Domestic Product (GDP) and GDP and Growth Rates.
Finally, the Compensation Price Index evolves from 2011 to 2025 in a similar manner to the Labour Cost Index. This is defined as the total labour costs divided by the total hours worked and indexed to some reference year. Total labour costs include COE as well as other labour costs e.g. training and recruitment costs. This index is transmitted quarterly to Eurostat by the Labour Market & Earnings division.
| Labour Cost Index (year=i) = 100 | x | Total labour costs (year = i) |
| Total hours worked (year = i) |
Further information available at Wages and labour costs - Statistics Explained - Eurostat and Labour Cost Index (LCI) - Statistics Explained - Eurostat.
COE at constant prices is a way to measure Compensation of Employees by factoring out year-on-year price changes. It presents COE as a measure of labour input i.e. volume. The term “real wages” is often used to describe the value of wages when accounting for the effects of inflation over time i.e. the Consumer Price Index. For example, say an employee’s gross salary was €40,000 in 2019, measured in current prices. What buying power would this have in 2025?
| Value in new period = Value in old period | x | Index in new period |
| Index in old period |
| Value in 2025 = (Value in 2019) | x | CPI in 2025 (Base month Dec. 2023 = 100) |
| CPI in 2019 (Base month Dec. 2023 = 100) |
| Value in 2025 = (€40,000) | x | 102.9 | = €48,825.62 |
| 84.3 |
Further information available at How is the CPI used.
This is our main data source for COE containing administrative earnings data.
Our PMOD data is supplemented by DSP data relating to social benefits received.
LFS data includes total hours worked and allows us to find COE at constant prices.
Learn about our data and confidentiality safeguards, and the steps we take to produce statistics that can be trusted by all.