
The publication of the Household Travel Survey (HTS) resumes with the release of results for all four quarters of 2018, including revision of Quarter 1 2018 data.
The CSO has implemented a statistical adjustment to the HTS data from Q1 2018 onwards. Please note that the results from Q1 2018 onwards should be considered interim and are subject to revision as more data for 2019 becomes available.
The Quarter 2 2018 Household Travel Survey publication was suspended in October 2018 due to concerns the CSO had about the quality of the data collected in the survey. The Quarter 3 and 4 2018 publications were subsequently also deferred while the CSO conducted an in-depth examination of the statistical issues affecting the results.
The statistical quality issues of concern were a falling response rate to the survey and, in tandem with this, a substantial increase in the percentage incidence of trips taken in the respondent sample. The CSO considered the values observed across the survey’s key indicators (i.e. domestic and outbound trips, nights and expenditure) to be implausible when compared to those of previous years; and considered that there was a strong possibility of statistical bias in the survey data.
In response the CSO undertook a comprehensive investigation of the current statistical processes in the HTS, reviewing the sampling, collection, processing, and estimation methodology and the survey data. The purpose of the review was to identify anything that could be having a biasing impact on the survey results and consider what options were available to address the issues in the data.
Following the outcome of this review (outlined in more detail below) the CSO has decided to apply a statistical adjustment to the 2018 HTS data to address a response bias in the proportion of people responding to the survey who had taken an overnight trip.
The CSO has also initiated a formal methodological review of the survey to look at the long-term design options for the HTS. This review, due to be completed during the second half of 2019, will make recommendations for sampling, weighting and the calculation of data quality indicators.
This section outlines the steps taken by the CSO to analyse the 2018 HTS data and the outcome of that analysis.
The CSO reviewed all of the operational procedures used in the post-out, receipt, scanning, verification and processing of HTS survey forms during each quarter of 2018. This established that the same procedures were followed throughout 2018 as in previous years, and that all of the survey forms received were accounted for and handled exactly as they would have been in the past.
The HTS is a postal survey that uses the electoral register as a sampling frame to identify private households. The HTS is based on a quarterly sample of 13,800 households that is selected from the electoral register by a third-party on instruction from the CSO. The HTS is a sample of private households selected randomly and stratified by District Electoral Division.
The CSO contacted the supplier of the quarterly samples, who verified that the same procedures were followed in the selection of households in 2018 as in 2017 and that the full electoral register was used as a frame for each sample drawn in 2018.
In July 2018, the CSO started using the 2018 version of the electoral register for the HTS sample (prior to this the sample was taken from the 2015 version of the Electoral Register). This is not believed to have made any material difference in relation to the issues of falling response rates and potential statistical bias.
There are several methodological steps followed in the production of the quarterly HTS results. Each step creates a series of weights that grosses the collected survey data to current population levels.
The HTS survey data is weighted to agree with the latest quarterly population estimates by region, sex and age provided by the Demography Section of CSO. In an additional step the estimates of outbound travel (trips, nights and expenditure) from the HTS are weighted to agree with the results of the Tourism & Travel survey.
Each of these steps has been checked and verified by the CSO in respect of the 2018 data.
The 2018 HTS survey data was analysed to determine if there was potentially a response bias in the survey. In other words, could there be something unique about those who responded or did not respond to the survey that impacted the data in 2018?
The data was analysed in a variety of different ways to see if the demographic characteristics (e.g. age, sex, region, household size) of those who responded to the 2018 surveys were in any way different to the previous year or the population. There was no demographic bias observed in the 2018 data.
However, this analysis did highlight several issues in the survey data:
Falling response rates
The response rate to the HTS in the full year 2017 was 42%. The corresponding figure for all of 2018 was 35%. Broken down by quarter, the response rates in 2017 and 2018 (and in Q1 2019) were as follows:
| Table 1: Response rate to Household Travel Survey: 2017, 2018 and Q1 2019 | |||
| Quarter | 2017 | 2018 | 2019 |
| Q1 | 45% | 38% | 40% |
| Q2 | 43% | 35% | |
| Q3 | 42% | 36% | |
| Q4 | 39% | 33% | |
| Year | 42% | 35% | |
A total of 55,200 forms is issued to households each year in the HTS. In 2017, the CSO received 23,300 completed forms. With the reductions in response rates shown in Table 1, the number of completed forms received fell by almost 4,000 in 2018, to 19,500 forms.
There is a consensus internationally that survey response rates are dropping despite increased efforts on the part of survey agencies. Commentators point to a variety of social and cultural factors, that vary across countries, to account for falling response rates. Societal changes such as smaller household size, increased information demands and greater awareness of privacy issues have been identified as factors that can impact survey response rates. It is widely accepted that low response rates can increase the risk of non-response bias, although this is not always the case.
Evidence of non-response bias
Another notable difference in the 2018 data compared with previous years is an obvious increase in the percentage of respondents in the sample who indicated that they had been on an overnight trip, either domestic or outbound, during 2018.
In the six years prior to 2018 the percentage of respondents in the sample who indicated that they had been on an overnight trip was quite stable in each quarter, with predictable seasonal variations (see Table 2). However, from Q2 2018 the percentage of people in the sample who had taken an overnight trip increased between 5 and 7 percentage points (see highlighted figures in Table 2).
| Table 2 Percentage of respondents in sample who took an overnight trip in each quarter in the years 2012 to 2018 | ||||
| Q1 | Q2 | Q3 | Q4 | |
| 2012 | 18% | 23% | 30% | 20% |
| 2013 | 16% | 22% | 29% | 19% |
| 2014 | 16% | 23% | 29% | 20% |
| 2015 | 17% | 23% | 31% | 20% |
| 2016 | 19% | 23% | 31% | 21% |
| 2017 | 20% | 25% | 32% | 23% |
| 2018 | 21% | 31% | 39% | 28% |
While changes in the percentages of people who take overnight trips would normally be expected as the survey tracks growth and contraction in the underlying market, the unprecedented scale of change evident in the 2018 survey data has led the CSO to conclude that there is a statistical bias in the collected data.
It is not possible to say with certainty what caused the bias in the data as there were a number of changes to the 2018 survey form that may have had an impact.
The instruction removed was: “if no trips were taken complete Q1 and Q2 only”. Removing this instruction is likely to have reduced the propensity of households that did not go on any overnight trip in the reference month to complete and send back a return.
While it is difficult to attribute the lower than expected response rate and the apparent response bias to any one change that was made in the questionnaire, it seems likely that each of the changes described above has had at least some impact. In particular the increase in the length and complexity of the survey form and the removal of key instructions for households which had taken no trips may have led to an increase in the number of non-responding households.
There are well-established and documented statistical approaches to measuring and addressing non-response bias in survey data. Most of these usually involve a comparison of the characteristics of survey respondents and non-respondents with each other and with the population of interest, to see if there are differences between the two groups and the population. For example: Is owner-occupied accommodation over- or under-represented amongst responding households? Are households from specific socio-economic, income or age groups over- or under-represented?
These types of comparison are generally done using supplementary data about all of the people or households in the selected sample. This data is either collected through the survey (paradata) or is available from the original sampling frame (auxiliary data). When such data is available, an adjustment can generally be built into the calculation of the survey weights, to correct for the over- or under-representation of a population subgroup in the survey sample.
The CSO explored whether the auxiliary data needed to adjust for non-response bias was available. Specific options examined were:
The lack of information about the non-responding element of the HTS sample means that a traditional non-response bias analysis and subsequent adjustment is not possible for the HTS data, and an alternative solution was required.
The combination of questionnaire changes, falling response rates and increasing share in the respondent sample of households which had taken a trip have had an impact on the 2018 HTS data. The share of persons in the achieved sample who took no overnight trip has been deflated and the weight assigned to those who did take trips increased significantly, producing an apparent bias in the final data.
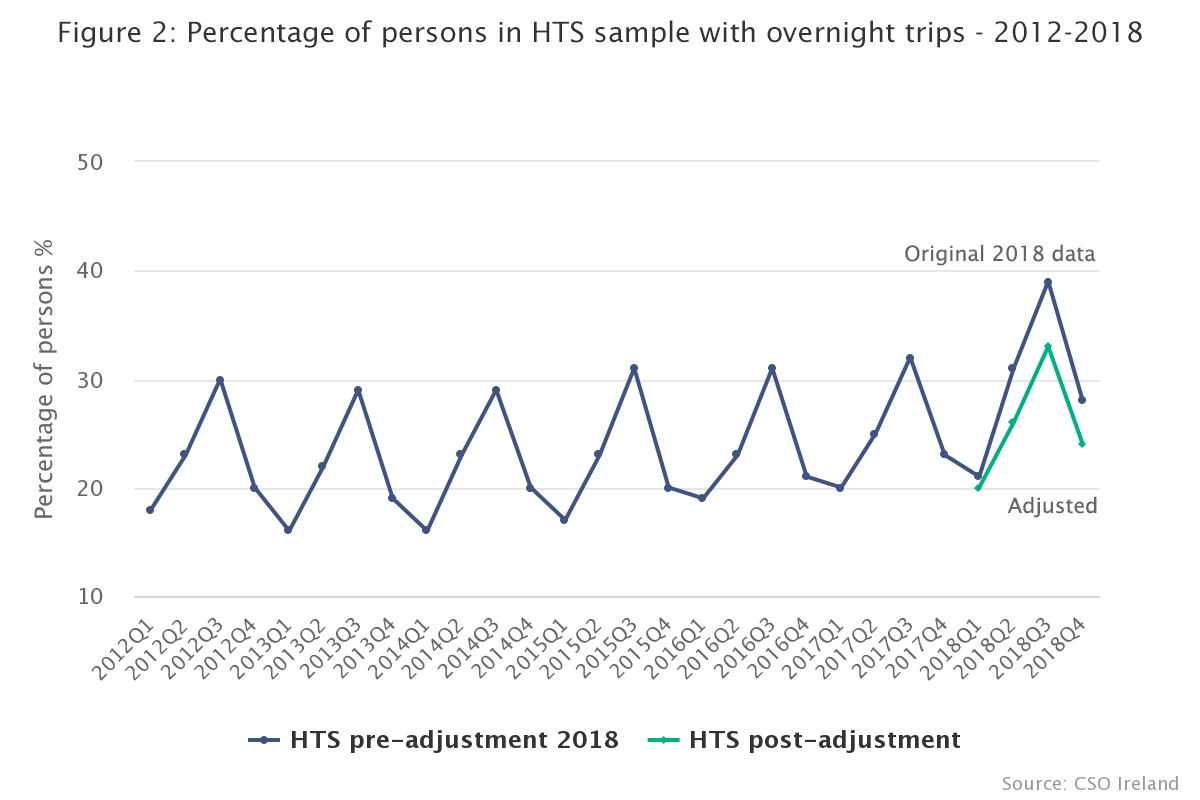
In the absence of auxiliary data to correct for this statistical bias, the CSO has applied an adjustment to the HTS weights that takes account of the pattern of response observed in the data over the previous six years of the survey. This approach makes an adjustment for the non-response bias in the data using historical trends in the data to forecast the 2018 response pattern. This adjustment is based on the percentage of persons with and without trips reported in the HTS sample over the previous six years, 2012 to 2017, broken down by region, sex and age group. As Figure 1 illustrates, the quarterly percentage of people indicating overnight trips taken was relatively stable from 2012 to 2017, with a gradual upward trend and consistent seasonal patterns; but the percentage of people taking overnight trips was substantially higher in 2018 - particularly in quarters 2, 3 and 4 - due to the issues described above.
| 2012 | 2013 | 2014 | 2015 | 2016 | 2017 | 2018 | |
| Quarter 1 | 18 | 16 | 16 | 17 | 19 | 20 | 21 |
| Quarter 2 | 23 | 22 | 23 | 23 | 23 | 25 | 31 |
| Quarter 3 | 30 | 29 | 29 | 31 | 31 | 32 | 39 |
| Quarter 4 | 20 | 19 | 20 | 20 | 21 | 23 | 28 |
Procedure
The adjustment uses an exponential smoothing procedure¹ to forecast the percentage of people with and without trips in each cell of the sample for the four quarters of 2018.
The forecast percentage for each cell² is then divided by the actual percentage of persons with and without trips in each cell of the sample to create adjustment factors.
These factors are then used to reweight the grossing factors to align the percentage of people with and without trips in each cell of the sample to the forecast percentages.
The effect of the adjustment is to rebalance the distribution of those with and without trips in the achieved sample to mirror the forecast percentage of persons with and without trips, based on the shape and pattern of the distribution in the equivalent quarters over the previous six years.
In this way the effect of the bias observed in the HTS sample data across the four quarters of 2018 is addressed to give a more accurate estimate of the domestic tourism market in 2018.
Effect of non-response adjustment
The effect of the non-response adjustment applied to all four quarters of the 2018 HTS data, is to reduce the percentage of people in the weighted sample who took overnight trips. The graph below (Figure 2) illustrates the effect the adjustment has had on the HTS data and shows that the adjustment maintains both the trend and seasonal effect in the data. The graph also shows the original 2018 data and illustrates the bias in the collected data.
In order to understand the context for the adjusted 2018 HTS data, the CSO has examined other data sources that provide an insight into trends in the tourism sector during 2018.
CSO Labour Force Survey: Employment trends in both the Accommodation and Food Service Activities sectors (NACE 55 and 56) showed moderate employment increases across the quarters of 2018, with stronger growth in Q2 (11%) and Q3 (10%) compared to 2017.
CSO Monthly Service Inquiry: The indices created by the CSO’s Monthly Services Inquiry (MSI) for the Accommodation sector (NACE 55) and Food Service Activities (NACE 56.1 and 56.2) both show strong growth. In the Accommodation sector³ the estimated growth for as measured by the MSI 2018 was 21%, with strong growth in particular for quarters 2, 3 and 4. For Accommodation and Food Services combined, the MSI estimated growth of 9% in 2018.
Fáilte Ireland Accommodation Survey: Fáilte Ireland’s Accommodation Survey shows an annual increase in hotel bednights sold of 3% in 2018. Quarter 1 had the highest year-on-year change with an increase of 13%.
Concerts and Events: Media reports suggest a strong increase in the number of concerts and live entertainment events held in Ireland during 2018 compared to 2017.
While none of the data sources examined is directly comparable with the Household Travel Survey or indeed with each other, all of them showed evidence of growth, to varying degrees, in the tourism sector in 2018 compared with 2017. The comparison with other sources does not distinguish between domestic and inbound demand, but it provides a broader context for the HTS results.
The CSO is currently undertaking a detailed review of the Household Travel Survey, from both a methodological and design perspective. It is expected that this review will make recommendations for the sampling frame used for the survey, the design of the sample, a non-response calibration methodology and the calculation of standard errors for the estimates.
The CSO’s assessment of the 2018 HTS data is that the number of households returning survey forms with overnight trips was proportionally much higher than previously, possibly because of changes within the survey form that were exacerbated by falling response rates. This would have produced statistically biased estimates of trips, nights and expenditure if it had not been addressed.
The CSO examined the possibility of getting supplementary data about non-responding households and applying a standard non-response bias adjustment. However, as the sample contained many non-unique household addresses it was not possible to obtain or link auxiliary data for non-responding households.
The CSO has applied an adjustment to the 2018 HTS data that estimates the percentage of respondents in the sample with and without overnight trips, based on the trends observed in the data over the previous six years of the survey. The estimates produced from the 2018 HTS data are a function of this adjustment and the collected 2018 survey data.
The 2018 HTS results are to be considered interim and may be subject to future revision.
[¹] SAS – PROC ESM procedure
[²] For weighting purposes, the sample is broken down by region (8), sex (2) and age group (7) resulting in 112 cells.
[³] NACE 55 on the MSI is primarily based on a matched sample of hotels.
Published 19 June 2019, 11am
Learn about our data and confidentiality safeguards, and the steps we take to produce statistics that can be trusted by all.