
| Table 1 Ireland's FDI Asymmetry with the US, 2014 | €billion |
| US outward FDI to Ireland, 2014 (BEA) | 252 |
| Inward FDI from US to Ireland, 2014 (CSO) | 33 |
| Asymmetry | 219 |
Due to the increasingly complex nature of world economic activity, differences in the measurement of the same foreign direct investment (FDI) statistics arise between National Statistics Institutes (NSIs). These differences are called asymmetries. This document explains the existence of an asymmetry between the CSO and the US Bureau of Economic Analysis’ (BEA) measurement of Ireland’s inward FDI position with the US, which, at 219 billion euros, is by far the largest of Ireland’s bilateral FDI asymmetries.
This document is divided into eight sections. Section two provides context to the asymmetry, describing some of the challenges globalisation presents in measuring FDI and the international community’s efforts to reduce these asymmetries. Section three describes how measuring FDI using the location of a firm’s ultimate controlling parent resolves most of this asymmetry. Section four discusses how the measurement of debt is a major source of the asymmetry. Section five examines how the basis of measurement differs between the two NSIs, limiting comparability. Section six discusses how better understanding Special Purpose Entities (SPEs) in Ireland may reduce this asymmetry even more. Section seven describes how exploring the asymmetry by sector is useful to further reduce the asymmetry in future. Section eight concludes.
Globalisation has brought increasingly larger and more complex business activity between countries and continents. In the past, production was mainly confined to the national economy, employment was mainly local, private investment was mainly funded within the economy and financial transactions were largely domestic. Currently, however, firms often organise production at a global level, with processes spanning several countries. Capital such as intellectual property is used simultaneously across the world, labour has become far more mobile and purchasing has become much more international (UNECE, 2011).
An important part of this phenomenon is the growth of FDI. FDI inflows have increased globally by over 1,500 percent since 1970 (World Bank, 2016). Multinational firms conduct their business with little regard to national boundaries (UNECE, 2011). A multinational enterprise’s main centre of operations may invest in a subsidiary in a separate country which may in turn invest in a subsidiary in a third country. The subsidiary in this third country may undertake further FDI activities and may interact directly with the main centre of FDI operations. It may even exercise oversight or some effective control over the subsidiary from which it has directly received FDI. Furthermore, the group headquarters of a multinational firm may be located in a separate country to its main centre of operations and to the stock exchange in which its shares are being traded.
There are two possible approaches to identify the source and recipient country in measuring FDI. The typical way is to use the ‘immediate counterpart country’, also described as the immediate home and host country (OECD, 2008). This is the approach followed by the CSO in its FDI statistics (CSO, 2015a), as is required for its international reporting obligations. We term this methodology ‘direct FDI’ in this document.
A second approach is to examine FDI by its ultimate source and host economy (IMF, 2009). The CSO monitors the location of a firm’s ultimate controlling parent (UCP) for this purpose. The location of the UCP is typically considered to be the country where the group headquarters of the firm lies. We term this methodology ‘indirect FDI’ in this document.
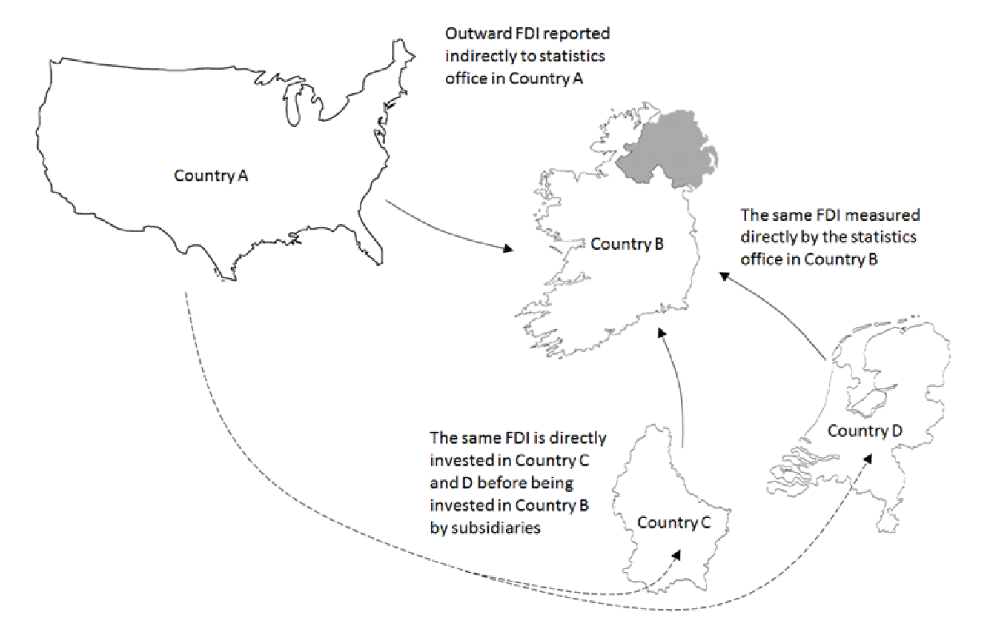
With increasingly large amounts of FDI in the world economy, and the growth in the complexity of multinational enterprises’ activity, it has also become increasingly important to reduce asymmetries between different NSIs’ statistics. An FDI asymmetry occurs when the outward FDI from Country A to Country B (as measured by the NSI in Country A) is different to the inward FDI from Country A to Country B (as measured by the NSI in Country B) (see Diagram 1). One initiative to reduce these asymmetries is the IMF Coordinated Direct Investment Survey (CDIS) Project on Bilateral Asymmetries. This was begun in 2010 to improve the quality of direct investment data across the world (IMF, 2015a).
Diagram 1: Describing an FDI asymmetry

Ireland’s largest FDI asymmetry is with the US. In October 2013 the IMF CDIS team contacted the US Bureau of Economic Analysis (BEA) to provide them with information on the ten largest bilateral asymmetries between the US and other countries in its outward direct investment positions (i.e. outward FDI stocks). The countries with the largest such asymmetries were the United Kingdom, Ireland, the Netherlands and Belgium. The BEA reported a 188 billion dollar outward investment position with Ireland at the end of 2011, while the CSO reported a 6 billion dollar inward investment position from the US in the same period, resulting in an asymmetry of 182 billion dollars (BEA, 2014a).
This asymmetry has increased since then. The BEA measures US outward FDI positions with Ireland in 2014 as 310 billion dollars (252 billion euros) (BEA, 2014b).2 On the other hand, the CSO calculates its 2014 inward FDI position with the US to be 33 billion euros, resulting in an asymmetry of 219 billion euros for 2014. Irish inward FDI and US outward FDI positions in 2014 are displayed by country in Table 2 and Table 3, respectively, below.
| Table 2 Inward FDI Positions in Ireland by Country | € million |
| Luxembourg | 66,729 |
| Netherlands | 61,562 |
| United Kingdom | 43,255 |
| United States | 33,372 |
| Other countries | 106,590 |
| Total inward FDI | 311,508 |
| Source: CSO Foreign Direct Investment Annual 2014 | |
| Table 3 Outward US Direct Investment Positions by Country | € million |
| Netherlands | 611,859 |
| United Kingdom | 477,598 |
| Luxembourg | 377,859 |
| Ireland | 252,305 |
| Other countries | 3,201,032 |
| Total outward FDI | 4,920,653 |
| Source: BEA Direct Investment and MNE data, 2014 | |
Getting to grips with FDI asymmetries is made more difficult by the primary concern NSIs have for data confidentiality. Ireland and the US both have distinct legal infrastructure in place to avoid direct and indirect statistical disclosure, making it impossible to exchange micro data or data at an especially detailed sector level.3 However, there is still a lot we can establish about this FDI asymmetry with the US.
Most of this FDI asymmetry can be resolved by examining how the source and destination of FDI is measured. The data reported to the BEA looks through intermediate FDI locations in determining the destination of US-owned FDI. Secondly, US firms that domicile their headquarters abroad (i.e. US corporate inversions) are likely to invest in their subsidiaries abroad through their main US subsidiary (formerly the company at the top of their group structure). This means that US outward FDI figures are unlikely to change as a result of these inversions (BEA, 2015). On the other hand, the CSO measures FDI as originating from the immediate country of investment and classifies all companies headquartered in Ireland as Irish firms.4 These two differences in reporting FDI are responsible for most of this asymmetry.
The following figures show the breakdown of the value of FDI stocks in Ireland. Figure 1 measures the value of FDI stocks in Ireland by the location of a multinational subsidiary’s immediate controlling parent company, as is usually presented by the CSO.5 Figure 2 measures the value of FDI stocks in Ireland by the location of a multinational enterprise’s Ultimate Controlling Parent (UCP). The UCP location is defined as where the final control of the multinational enterprise lies, typically the location of the group headquarters.
| Inward FDI (direct) | |
| Luxembourg | 66729 |
| Netherlands | 61562 |
| United Kingdom | 43255 |
| United States | 31010 |
| Bermuda | 22817 |
| Other countries | 86135 |
Source: CSO, see Appendix for data source
| Inward FDI (Indirect) | |
| United States | 173647 |
| United Kingdom | 29111 |
| US Corp. Invs in Ireland | 21464 |
| Germany | 12539 |
| Ireland | 11563 |
| Other countries | 63184 |
Source: CSO, see Appendix for data Source
From these figures it is evident that the FDI position in Ireland controlled by US domiciled firms is worth 174 billion euros (i.e. US indirect FDI), 139 billion euros more than the direct US FDI position in Ireland.
In addition to this, 21 billion euros of Irish FDI into Ireland is ultimately from formerly US-based corporate inversions that have re-located to Ireland.6 Since it appears that these firms’ FDI into Ireland continues to be measured as coming from the US in the BEA’s outward FDI statistics we can add these together to get a more comparative measure of Ireland’s inward FDI position from the US of 195 billion euros. Using this measure causes the asymmetry to fall by 162 billion, or 74 percent. This is explained below in Table 4 and 5.
| Table 4 The Asymmetry, Using the CSO’s Direct Measure of FDI in 2014 | € million |
| US outward FDI to Ireland, 2014 (BEA) | 252,305 |
| Inward FDI from US to Ireland, 2014 (CSO) | 33,372 |
| Asymmetry | 218,933 |
| Table 5 The Asymmetry using the CSO’s Indirect Measure of FDI in 2014 | € million |
| US outward FDI to Ireland, 2014 (BEA) | 252,305 |
| Inward FDI to Ireland from firms with UCP in US, 2014 (CSO) | 173,647 |
| Inward FDI to Ireland from US Corporate Inversions, 2014 (CSO) | 21,464 |
| Total | 195,111 |
| Asymmetry | 57,194 |
FDI can be divided into two components; equity and debt. The equity proportion of FDI is what one might usually think of when considering FDI. However, firms in a multinational group may also provide loans and other types of debt to their counterparts in other countries, which also constitutes FDI.7
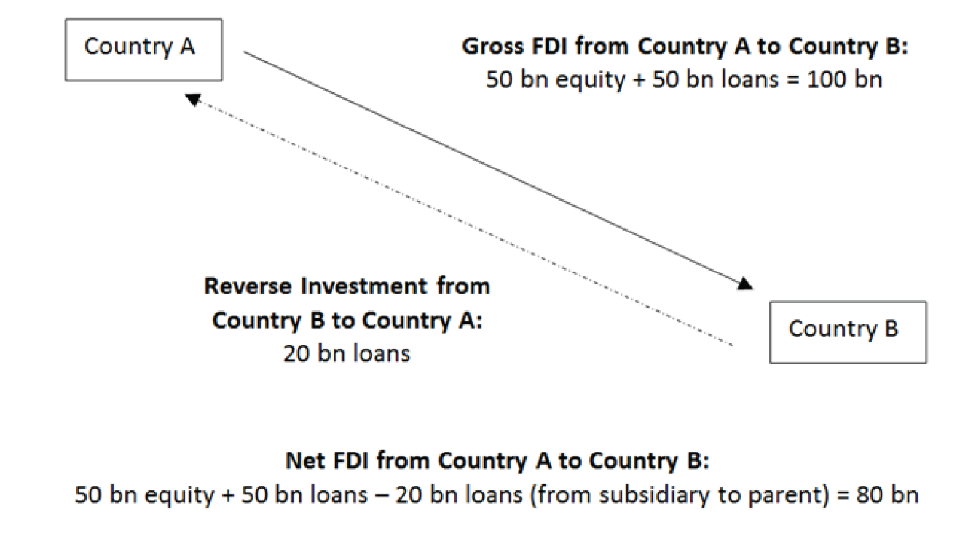
Measuring the debt component of FDI is more difficult than measuring equity. These difficulties arise with transactions between subsidiaries and parents and with transactions between fellow subsidiaries. A subsidiary can re-invest in its parent investor, resulting in reverse investment. Reverse investment reduces the net inward FDI that occurs (Diagram 3). This re-investment may not be fully captured by the BEA.
Secondly, a loan from a US-owned subsidiary in Ireland to a fellow US-based subsidiary of the same US multinational parent will be recorded by the BEA as positive FDI from Ireland. On the other hand, the CSO will record this loan as reverse investment from the United States and will net this figure against the parent’s FDI flow to the subsidiary. Even though both NSIs are following the international recommendations, a bilateral asymmetry is created (BEA, 2014a). Thirdly, the BEA do not fully capture debt transactions between fellow subsidiaries in their FDI data (BEA, 2014a) while the CSO do capture these transactions.
It is worth noting the overall picture of FDI by debt and equity in Ireland in 2014, displayed in Figure 3 below. The total FDI position in Ireland excluding debt is 28 billion euros higher than total FDI in Ireland with debt and equity combined. This means that foreign multinationals in Ireland provide significant financing to their counterparts in the rest of the world.
| Inward FDI | |
| Equity and Debt | 311508 |
| Equity Only | 339260 |
| Debt only | -27752 |
The asymmetry between the CSO and the BEA data falls further when we examine the equity component of FDI only. This suggests a considerable amount of the overall asymmetry is due to differences in measuring debt.
Figure 4 below displays the effect of excluding debt from the CSO’s measure of Ireland’s inward FDI positions in 2014. US FDI positions in Ireland are 193 billion, 20 billion higher than when debt is included.8 Adding the equity value of the US corporate inversions to this figure gives us 212 billion. On the other hand, excluding debt from the BEA’s measure of the US outward FDI position in Ireland reduces this figure to 224 billion euros.9 Therefore, in terms of equity, 95 percent (or 194 billion euros) of this FDI asymmetry can be explained by UCP and the measurement of US corporate inversions.
| Equity and Debt | Equity | |
| United States | 173647 | 193303 |
| United Kingdom | 29111 | 37699 |
| US Corp. Invs in Ireland | 21464 | 18618 |
| Germany | 12539 | 12162 |
| Ireland | 11563 | 10879 |
| France | 7568 | 11127 |
| Canada | 7068 | 7123 |
| Netherland | 6115 | 5581 |
| Switzerland | 4713 | 5558 |
| Other countries | 37720 | 37210 |
| Table 6 The Equity Asymmetry using the CSO’s Indirect Measure of FDI | € million |
| US outward FDI to Ireland, 2014 (IMF, 2015a) | 223,842 |
| Inward FDI to Ireland from firms with UCP in US, 2014 (CSO) | 193,303 |
| Inward FDI to Ireland from US Corporate Inversions, 2014 (CSO) | 18,618 |
| Total | 211,921 |
| Asymmetry | 11,921 |
The comparability of the BEA’s measure of FDI with that of the CSO is limited also by different valuation methodologies. The BEA uses a historical-cost basis for measuring FDI positions with individual countries while the CSO uses the internationally agreed methodology of prices in the current period.10 Historical-cost data reflect the price levels of earlier periods and tend to understate overall FDI levels. For example, the value of total US outward FDI positions, measured by the BEA at historical costs, was 4.66 trillion dollars in 2013, while it was calculated to be 6.28 trillion dollars when measured at current prices.11 However, the particular effect of measuring FDI into Ireland by this alternative method is not clear since FDI statistics in current prices are only available from the BEA for FDI positions with the rest of the world without geographic breakdown.
A further part of the asymmetry relates to the measurement of special purpose entities (SPEs). SPEs are firms established to hold assets, incur liabilities and receive and pay out income on behalf of a parent entity, often for tax reasons. They are also known as special purpose vehicles, shell companies, special financial institutions, brass plate companies, mailbox companies and international business companies. They tend not to have any employees or non-financial assets and usually have little physical presence (UNECE, 2011).
SPEs can be located at the top and bottom of an enterprise’s group structure. For example, a multinational group’s entire operations in a particular country may be held by a holding company. On the other hand, an aircraft leasing firm may set up a separate SPE for each of its aeroplanes. The BEA has agreed to look further into the entities classified as holding companies to see if there is more meaningful economic activity occurring below the holding company level at which they are categorising nearly half of US FDI into Ireland.
We can examine the asymmetry by comparable sector. When we compare the CSO’s direct measure of inward FDI from the US with the BEA’s data every comparable sector except for Other Manufacturing is lower in the CSO data than that of the BEA (Figure 5).
The results are very different when we compare the CSO’s indirect measure with the BEA data (Figure 6). Six out of nine sectors are larger in the CSO data. The sectors especially large in the CSO indirect data are Pharmaceuticals and Other Manufacturing. It is noteworthy also that there is a relatively large asymmetry in the Food and Beverages sector (1.9 billion euros in the CSO data versus 365 million euros in the BEA data). However, what is probably most striking about both Figure 4 and 5 is the holding companies sector. The BEA reports that 121.5 billion euros of US FDI positions in Ireland is in holding companies, almost half of its total FDI figure. The equivalent CSO figure for US holding companies in Ireland is small, although it unfortunately cannot be displayed for confidentiality reasons. As we have seen in the previous section, holding companies fall into the category of SPEs and it is evident that better understanding the nature of the sectors classified by the BEA as holding companies can help to further resolve the asymmetry. More details on this can be found in Table A3 in the Appendix.
| FDI from US (CSO, direct) | FDI to Ireland (BEA) | |
| Food & Bev. | -5 | 365 |
| Pharmaceuticals | 876 | 14973 |
| Comp & Instr. Eng. | 366 | 4439 |
| Other Manufacturing | 10666 | 4581 |
| Wholesale & Retail Trade | * | 165 |
| Information & Comms. | 937 | 29905 |
| Insurance Services | 4364 | 8080 |
| Admin. & Support | * | 12042 |
| HoIding Companies | * | 121521 |
| FDI from US (CSO, indirect) | FDI to Ireland (BEA) | |
| Food & Bev. | 1939 | 365 |
| Pharmaceuticals | 42953 | 14973 |
| Comp. & Instr. Eng. | 6134 | 4439 |
| Other Manufacturing | 16600 | 4581 |
| Wholesale & Retail Trade | 9350 | 165 |
| Information & Comms. | 13018 | 29905 |
| Insurance Services | 7977 | 8080 |
| Admin. & Support | 25761 | 12042 |
| HoIding Companies | * | 121521 |
This asymmetry between the BEA and the CSO’s measure of FDI from the US into Ireland can be mostly explained by the direct and indirect reporting of FDI and the effect of US corporate inversions. These factors can explain 74 percent of the difference between the CSO data and those of the BEA. Another contributor to the asymmetry is measuring debt, which is more difficult to measure than equity. CSO data suggests that, in terms of the debt component of FDI, more reverse investment takes place with the US than gross FDI into Ireland from the US. On the other hand, BEA data suggests that the opposite is the case. This means that when we focus on the equity component of FDI only, we can explain 95 percent of the FDI asymmetry. Using historical costs rather than current prices also reduces comparability. Finally, re-examination of SPEs by the BEA should further explain the asymmetry and focusing on the asymmetry by sector can help us to do this.
____________________________________________________________________________________________________________________________________
1We are grateful to the BEA for comments on this document.
2 The exchange rate between dollars and euros used from this point onwards is taken to be the December 2014 rate of 0.81 euro to one dollar.
3 See the Statistics Act (1993) in the case of Ireland.
4 This practice is in line with international recommendations. See CSO (2015b) and IMF (2010).
5 See CSO’ Foreign Direct Investment Annual 2014 (2015b).
6 For more information on these corporate inversions/redomiciled PLCs see CSO (2015c).
7 The debt component of FDI consists of long term loans, short term loans, bonds and notes, money market instruments and derivatives.
8 This suggests that US multinational firms in Ireland provide significant financing to their parent and fellow firms abroad.
9 See Table 3: Individual Economy Mirror Data in IMF (2015a).
10 See CDIS Metadata Responses by Economy in IMF (2015a).
11 See page 3, BEA (2014b).
BEA Direct Investment Positions for 2013: Country and Industry Detail. 2014b. (PDF)
BEA Guide to the BEA’s Direct Investment Surveys. (PDF)
BEA The Effects of Corporate Inversions on the International and National Economic Accounts. 2015. (PDF)
CSO Foreign Direct Investment Annual 2014. 2015a.
CSO Foreign Direct Investment - Background Notes (PDF 215KB)
CSO Redomiciled PLCs in the Irish Balance of Payments (PDF 183KB)
IMF Balance of Payments and International Investment Position Manual. 2009. (PDF)
IMF Coordinated Direct Investment Survey (CDIS). 2015a.
IMF Revisiting Global Asymmetries — Think Globally, Act Bilaterally: Paper by IMF. 2015b. (PDF)
IMF The Coordinated Direct Investment Survey Guide. 2010. (PDF)
Irish Statute Book Irish Statute Book. Statistics Act. 1993.
OECD OECD Benchmark Definition of Foreign Direct Investment: Fourth Edition. 2008. (PDF)
World Bank Foreign direct investment, net inflows. 2016.
| Table A1: FDI stocks in Ireland by Country, 2014 | (€million) | |
| Country | Immediate Value | UCP Value |
| Luxembourg | 66,729 | * |
| Netherlands | 61,562 | 6,115 |
| United Kingdom | 43,255 | 29,111 |
| United States | 31,010 | 173,647 |
| Bermuda | 22,817 | * |
| France | 15,307 | 7,568 |
| Spain | 12,559 | * |
| Switzerland | 12,063 | 4,713 |
| Germany | 9,807 | 12,539 |
| Italy | 5,882 | 8,128 |
| Belgium | 4,865 | * |
| Canada | 3,594 | 7,068 |
| US Corporate Inversions | - | 21,464 |
| Ireland (excl. corporate inversions) | - | 11,563 |
| Other countries | 22,058 | 29,592 |
| Total | 311,508 | 311,508 |
| *Data suppressed for confidentiality reasons. | ||
| Table A2: FDI by Indirect Source – Equity and Debt vs Equity, 2014 (million) | ||
| Equity and Debt | Equity | |
| United States | 173,647 | 193,303 |
| United Kingdom | 29,111 | 37,699 |
| US Corporate Inversions | 21,464 | 18,618 |
| Germany | 12,539 | 12,162 |
| Ireland (excl. corporate inversions) | 11,563 | 10,879 |
| France | 7,568 | 11,127 |
| Canada | 7,068 | 7,123 |
| Netherlands | 6,115 | 5,581 |
| Switzerland | 4,713 | 5,558 |
| Other countries | 37,720 | 37,210 |
| Total | 311,508 | 339,260 |
| Table A3: Inward FDI Position from the US by Comparable Sector, 2014 | (€million) | ||||
| CSO sector | NACE code(s) | FDI from US (CSO, direct) | FDI from US (CSO, indirect) | FDI to Ireland (BEA) | Equivalent BEA sector |
| Food and beverages | 10, 11 & 12 | -5 | 1,939 | 365 | Food |
| Pharmaceuticals | 21 | 876 | 42,953 | 14,973 | Chemicals |
| Computers and instrument engineering | 24, 25, 26 & 28 | 366 | 6,134 | 4,439 | [1] |
| Other manufacturing | 10,668 | 16,600 | 4,581 | Sum of: Other Manufacturing, Primary and fabricated metals | |
| Wholesale and retail trade | G | * | 9,350 | 165 | Wholesale Trade |
| Information and communication | J | 937 | 13,018 | 29,905 | Information |
| Insurance services | 65 | 4,364 | 7,977 | 8,080 | Finance (except depository institutions) and insurance |
| Administrative and support | N | * | 25,781 | 12,042 | Professional, scientific, and technical services |
| Holding companies | 64.2 | * | * | 121,521 | Holding Companies (nonbank) |
| *Data suppressed for confidentiality reasons. | |||||
| [1] Sum of: Machinery, Computers and electronic products, Computers and electronic products, Electrical equipment, appliances and components | |||||
Eoin Flaherty (+353) 1 498 8425
Christopher Sibley (+353) 1 498 4305
Learn about our data and confidentiality safeguards, and the steps we take to produce statistics that can be trusted by all.