
As part of the Quarterly National Accounts and the National Income and Expenditure publications, the CSO publishes data on Personal Consumption Expenditure (PCE). A broader and more internationally comparable measure of household welfare is Actual Individual Consumption (AIC).
PCE measures:
1. Household expenditure on goods and services.
2. Consumption expenditure of Non-Profit Institutions Serving Household (NPISH).
3. General government purchases of goods and services from market producers that are supplied to households as social transfers in kind, for example, the services provided by GPs to medical card holders.
In addition to the above AIC measures:
4. General government social transfers in kind that are non-market produced, for example, primary school education expenditure.
AIC includes all items measured by PCE, but the general government purchases are not limited to being from market producers. Instead, AIC covers all individual expenditure.
Individual expenditure has the characteristic of being attributable to an individual, such as spending on health or education and contrasts with collective expenditure such as spending on defence. As such, AIC consists of the goods and services actually consumed by individuals, irrespective of whether these goods and services are purchased and paid for by households, by government, or by non-profit institutions serving households.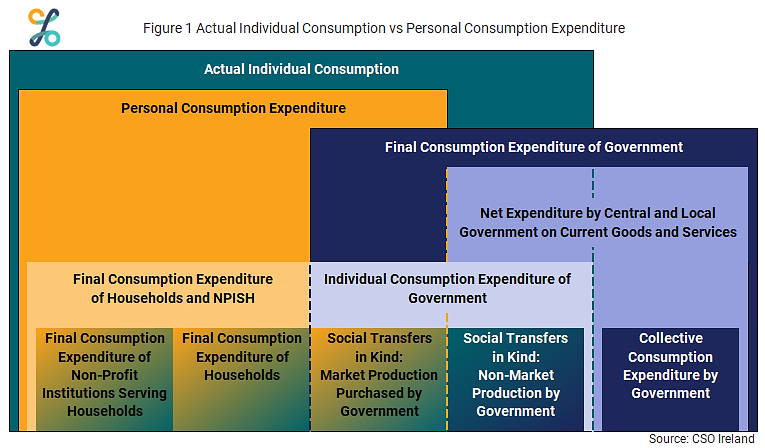
Figure 2 shows AIC in current prices. The share of Government individual expenditure in AIC steadily increased from the beginning of the series before peaking in 2009 at 22.1%. However, the peak in 2009 has since been surpassed with the share of Government individual expenditure reaching 25.3% in 2020 as household expenditure declined reflecting the COVID-19 related economic restrictions.
| NPISH | Government | Households | |
| 1995 | 0.6824264359 | 5.8071177217 | 28.0159228611828 |
| 1996 | 0.7011264016 | 6.1672541926 | 31.0158228816849 |
| 1997 | 0.7774114135 | 6.9532446641 | 34.0582369865238 |
| 1998 | 0.5821510343 | 7.8850062171 | 38.4829432899684 |
| 1999 | 0.7284781852 | 8.9929859439 | 43.3024432530883 |
| 2000 | 0.7099654179 | 10.2083604058 | 50.1997410508769 |
| 2001 | 0.7574988724 | 12.1629565687 | 54.8818926170185 |
| 2002 | 0.9158160971 | 14.193887076 | 59.6865720001604 |
| 2003 | 1.0610433333 | 15.5581293935 | 63.6692071410262 |
| 2004 | 1.2543798391 | 16.9576965282 | 67.1328907768194 |
| 2005 | 1.2665422956 | 18.7875883412 | 73.0462052332412 |
| 2006 | 1.4467495681 | 20.2992611093 | 79.5824739040097 |
| 2007 | 1.6622249979 | 22.2648119543 | 87.3936345328842 |
| 2008 | 1.7970893515 | 23.5068869676 | 88.8133643003515 |
| 2009 | 1.7894546062 | 22.7721329389 | 78.3519914470577 |
| 2010 | 2.1384735423 | 21.1057786414 | 77.0840608524 |
| 2011 | 2.1186075222 | 21.4547369859 | 76.8565891768 |
| 2012 | 2.0389567517 | 21.0303561329 | 77.2928876504 |
| 2013 | 2.0152406984 | 20.4434088923 | 78.6153216069 |
| 2014 | 2.0321792578 | 21.091519313 | 81.3659237365 |
| 2015 | 1.8193150579 | 21.7908736697 | 84.6880992175 |
| 2016 | 1.8356985712 | 22.8346852045 | 89.3241590646 |
| 2017 | 1.7356169376 | 24.5023393148 | 92.1791355762001 |
| 2018 | 1.7381807895 | 25.9910825224 | 97.6006943838 |
| 2019 | 1.7775102669 | 28.4493479129 | 102.8102349709 |
| 2020 | 1.5660956841 | 31.6666832977 | 91.8524595558 |
Get the data: Eurostat
Figure 3 shows AIC and PCE at constant prices. The two series closely mirror each other and both show the different trend for the period 1995-2007 compared to the period 2008-2020.
| AIC | PCE | |
| 1995 | 55.0143980173455 | 44.822156192 |
| 1996 | 58.517709850316 | 47.9666914554 |
| 1997 | 62.5991400718268 | 51.3887442454 |
| 1998 | 67.698803564563 | 55.690351093 |
| 1999 | 73.9800762369241 | 60.9454062181 |
| 2000 | 81.2774419493418 | 67.3759118288 |
| 2001 | 86.0681713731694 | 70.6932432138 |
| 2002 | 90.0191954227372 | 73.5086474356 |
| 2003 | 92.6989383818925 | 75.5899771492 |
| 2004 | 96.0366108046993 | 78.6124044592 |
| 2005 | 102.747021084004 | 84.2761490654 |
| 2006 | 108.676977728524 | 89.7324806931 |
| 2007 | 115.735885330101 | 95.8650160622 |
| 2008 | 116.198926342273 | 96.2822881903 |
| 2009 | 110.490235779816 | 91.5460506479 |
| 2010 | 109.765323271413 | 92.2779188863 |
| 2011 | 108.817512899173 | 91.1654767587 |
| 2012 | 107.499806416716 | 90.8874296302 |
| 2013 | 107.63503785001 | 90.862743161 |
| 2014 | 110.614395412163 | 93.2476702894 |
| 2015 | 114.084090345055 | 96.2180583095 |
| 2016 | 119.741658334232 | 101.093824576 |
| 2017 | 122.930801589581 | 103.4053255015 |
| 2018 | 127.888348096226 | 107.4807007845 |
| 2019 | 133.0370931507 | 111.0543325533 |
| 2020 | 124.059668332709 | 99.504292678 |
Get the data: PxStat N2014
Figure 4 shows the seasonally adjusted quarterly AIC and PCE at constant prices from 2015. The impact of COVID-19 related economic restrictions can clearly be seen, particularly in Q2 2020.
| AIC | PCE | |
| 2015 Q1 | 28.234610009 | 23.775676969 |
| 2015 Q2 | 28.432495167 | 23.99244157 |
| 2015 Q3 | 28.683840504 | 24.246352205 |
| 2015 Q4 | 28.908218068 | 24.388227588 |
| 2016 Q1 | 29.976222062 | 25.384635905 |
| 2016 Q2 | 29.721435958 | 25.113774152 |
| 2016 Q3 | 29.787139125 | 25.12001652 |
| 2016 Q4 | 30.282861144 | 25.513035357 |
| 2017 Q1 | 30.550296211 | 25.754063718 |
| 2017 Q2 | 30.428611586 | 25.603435865 |
| 2017 Q3 | 30.817434768 | 25.913593479 |
| 2017 Q4 | 31.04258685 | 26.050003611 |
| 2018 Q1 | 31.63054911 | 26.674694292 |
| 2018 Q2 | 32.082546095 | 26.973081555 |
| 2018 Q3 | 32.128735143 | 26.917624173 |
| 2018 Q4 | 31.928632993 | 26.794912124 |
| 2019 Q1 | 33.277291509 | 27.829567596 |
| 2019 Q2 | 33.452202666 | 27.976593042 |
| 2019 Q3 | 33.240270101 | 27.676314902 |
| 2019 Q4 | 32.94987351 | 27.451768069 |
| 2020 Q1 | 31.972825209 | 26.457362412 |
| 2020 Q2 | 28.846101666 | 22.50348937 |
| 2020 Q3 | 31.661545153 | 25.457367672 |
| 2020 Q4 | 31.43588698 | 24.941489437 |
| 2021 Q1 | 29.780145529 | 23.461975953 |
Get the data: PxStat NQQ49 (PCE), Eurostat (AIC)
Figure 5 shows AIC per capita in Euro (€) for 2020.
| 2020 | |
| Luxembourg | 33470.1041992755 |
| Denmark | 31002.0861230313 |
| Sweden | 26607.7978122483 |
| Finland | 24573.1809287183 |
| Netherlands | 23583.2540814823 |
| Germany | 22913.5958015702 |
| Ireland | 22841.1885413015 |
| Austria | 22196.0767836295 |
| Belgium | 22066.5761765737 |
| France | 21644.9988811682 |
| Euro Area | 19567.7227694481 |
| Italy | 17825.3198511747 |
| EU27 | 17586.7333838988 |
| Cyprus | 17562.964172499 |
| Portugal | 13236.2766609534 |
| Greece | 13155.7069439799 |
| Malta | 12488.4368125248 |
| Slovenia | 12298.1438177436 |
| Czechia | 10076.74534145 |
| Lithuania | 9921.65606691266 |
| Slovakia | 9688.86597397924 |
| Estonia | 9641.85959716353 |
| Poland | 8692.98436082402 |
| Croatia | 8056.22738355883 |
| Latvia | 8052.83918906522 |
| Hungary | 7745.11475787055 |
| Romania | 6537.32521323837 |
| Bulgaria | 5106.22051528005 |
Get the data: Eurostat (AIC), Eurostat (population)
AIC is particularly useful for international comparisons of household welfare as it is not influenced by the extent to which services such as health and education are provided by market producers rather than non-market producers across countries.
Due to large price level differences across countries, a simple comparison of market expenditures is not appropriate. Purchasing Power Standard (PPS) is an artificial currency unit that adjusts for price level differences, allowing meaningful cross-country volume comparisons of consumption. Aggregates expressed in PPS are derived by taking the respective economic series measured at current prices in a national currency and dividing by the respective Purchasing Power Parity (PPP).
Figure 6 shows AIC per capita in PPS for 2020 and highlights that Ireland is below the EU27 average.
| 2020 | |
| United States | 156 |
| Luxembourg | 131 |
| Germany | 123 |
| Denmark | 121 |
| Netherlands | 117 |
| Austria | 114 |
| Finland | 114 |
| Belgium | 113 |
| Sweden | 111 |
| United Kingdom | 110 |
| France | 109 |
| Euro Area | 105 |
| EU27 | 100 |
| Cyprus | 98 |
| Italy | 97 |
| Lithuania | 96 |
| Ireland | 94 |
| Czechia | 87 |
| Spain | 87 |
| Portugal | 85 |
| Malta | 83 |
| Poland | 83 |
| Slovenia | 80 |
| Estonia | 79 |
| Romania | 79 |
| Greece | 78 |
| Slovakia | 73 |
| Latvia | 72 |
| Hungary | 69 |
| Croatia | 67 |
| Bulgaria | 61 |
Get the data: Eurostat
Figure 7 shows AIC per capita in PPS over the period 1995-2020. By this metric Ireland’s per capita consumption peaked in 2007. The other countries represented are those which have overtaken Ireland since 2007 in a EU28 ranking by AIC per capita in PPS, see Figure 8.
| Belgium | Cyprus | Finland | France | Germany | Ireland | Italy | |
| 1995 | 120 | 91 | 98 | 120 | 137 | 96 | 121 |
| 1996 | 119 | 91 | 98 | 120 | 135 | 99 | 119 |
| 1997 | 118 | 92 | 100 | 119 | 133 | 101 | 121 |
| 1998 | 116 | 93 | 102 | 119 | 130 | 106 | 122 |
| 1999 | 115 | 93 | 102 | 118 | 130 | 107 | 121 |
| 2000 | 119 | 95 | 102 | 120 | 126 | 111 | 121 |
| 2001 | 117 | 95 | 99 | 122 | 125 | 112 | 118 |
| 2002 | 117 | 95 | 100 | 121 | 121 | 113 | 115 |
| 2003 | 116 | 96 | 102 | 118 | 123 | 114 | 115 |
| 2004 | 114 | 98 | 105 | 116 | 122 | 115 | 113 |
| 2005 | 114 | 100 | 104 | 117 | 120 | 117 | 112 |
| 2006 | 112 | 101 | 106 | 115 | 119 | 118 | 112 |
| 2007 | 110 | 110 | 110 | 114 | 117 | 118 | 111 |
| 2008 | 110 | 115 | 113 | 112 | 116 | 112 | 111 |
| 2009 | 111 | 107 | 112 | 113 | 119 | 104 | 110 |
| 2010 | 113 | 105 | 113 | 113 | 119 | 103 | 111 |
| 2011 | 113 | 101 | 116 | 113 | 122 | 99 | 109 |
| 2012 | 115 | 97 | 117 | 113 | 124 | 99 | 106 |
| 2013 | 118 | 91 | 116 | 115 | 124 | 97 | 102 |
| 2014 | 118 | 91 | 115 | 114 | 125 | 96 | 100 |
| 2015 | 118 | 92 | 116 | 113 | 124 | 97 | 100 |
| 2016 | 116 | 94 | 115 | 112 | 124 | 97 | 100 |
| 2017 | 115 | 95 | 114 | 110 | 124 | 95 | 100 |
| 2018 | 115 | 96 | 114 | 109 | 123 | 94 | 100 |
| 2019 | 114 | 95 | 113 | 109 | 122 | 95 | 100 |
| 2020 | 113 | 98 | 114 | 109 | 123 | 94 | 97 |
Get the data: Eurostat
Figure 8 shows Ireland's rank over time among the 2019 EU28 countries for AIC per capita in PPS. Ireland's rank peaked at seven in 2006 and for the most recent year, 2020, Ireland's rank was 14.
| Rank | |
| 1995 | 12 |
| 1996 | 11 |
| 1997 | 11 |
| 1998 | 11 |
| 1999 | 11 |
| 2000 | 11 |
| 2001 | 11 |
| 2002 | 11 |
| 2003 | 10 |
| 2004 | 8 |
| 2005 | 8 |
| 2006 | 7 |
| 2007 | 7 |
| 2008 | 11 |
| 2009 | 14 |
| 2010 | 13 |
| 2011 | 13 |
| 2012 | 12 |
| 2013 | 12 |
| 2014 | 12 |
| 2015 | 12 |
| 2016 | 12 |
| 2017 | 13 |
| 2018 | 13 |
| 2019 | 13 |
| 2020 | 14 |
Get the data: Eurostat
Figure 9 shows AIC per capita in PPS for 2020. Three categories are shown: countries greater than the EU27 average, countries between 75-100% of the EU27 average and countries less than 75% of the EU27 average.
For further information see related Eurostat release on estimates for purchasing power parities for 2020.
Justin Flannery, Email: justin.flannery@cso.ie (+353) 1 498 4262
Christopher Sibley, Email: christopher.sibley@cso.ie (+353) 1 498 4305
Learn about our data and confidentiality safeguards, and the steps we take to produce statistics that can be trusted by all.