
The Forests and Woodlands 2012-2022 Frontier Series release was published on 20 March 2024, however, Coillte has since notified the CSO that the data it provided on the area of forests and woodlands for 2012 and 2015 has been revised. As a result of this, the CSO will update this publication based on the new input data, which will change the Extent and Tree Cover Density data for those years. We will notify users when these revisions have been applied.
This publication is categorised as a CSO Frontier Series Output. Particular care must be taken when interpreting the statistics in this release as it may use new methods which are under development and/or data sources which may be incomplete, for example new administrative data sources.
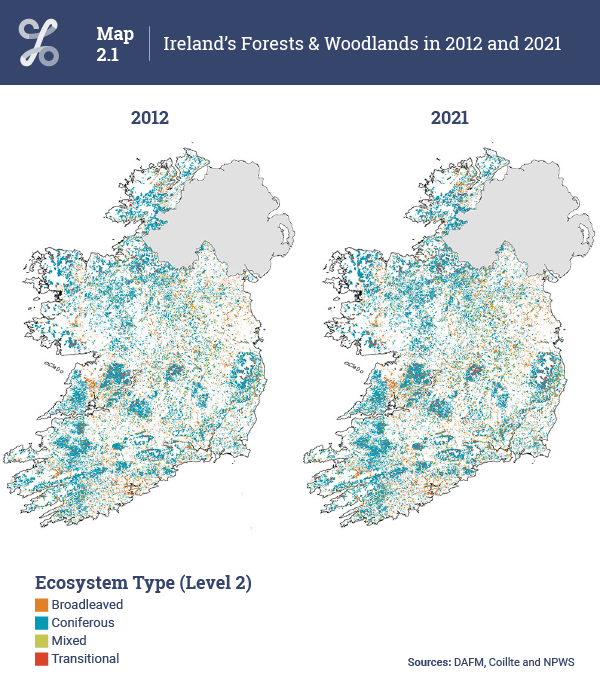
Forests & Woodlands extended to 758,444 hectares in 2021, representing around 11% of the area covered by terrestrial and transitional ecosystems in Ireland. This was an increase of almost 12% (80,468 hectares) on the 677,976 hectares of Forests & Woodlands in 2012. Not all types of Forests & Woodlands increased at the same rate, however, and while the area of Coniferous forests increased by more than 9% between 2012 and 2021, the area of Broadleaved forests increased by nearly 18%, and the area of Mixed forests increased by almost 20%. In 2021, our Forests & Woodlands comprised around 16% (122,163 hectares) Broadleaved forests, just over 76% (577,525 hectares) Coniferous forests, more than 5% (41,456 hectares) Mixed forests, and just over 2% (17,300 hectares) Transitional forests. Figure 2.1, Table 2.1.
The types of forests in Ireland have been strongly influenced by successive afforestation policies. In 1928 Ireland had just 98,000 hectares of Forests & Woodlands, around 1% of the national land area (National Forest Inventory 2022). Most of the increase in Forests & Woodlands since then has been down to afforestation through state sponsored or EU funded afforestation, although natural regeneration also plays a part. See Background Notes for more information on the different types of forests in this release.
| X-axis label | Broadleaved | Coniferous | Mixed | Transitional |
|---|---|---|---|---|
| 2012 | 103649 | 528512 | 34693 | 11122 |
| 2015 | 112353 | 560468 | 38789 | 19345 |
| 2018 | 116201 | 573774 | 40517 | 21639 |
| 2021 | 122163 | 577525 | 41456 | 17300 |
| Table 2.1 Extent of Forests & Woodlands 2012-2021 | ||||||||
| hectares | % | |||||||
| Ecosystem type (Level 2) | Area 2012 | Area 2015 | Area 2018 | Area 2021 | Net change (2012 to 2021) | Percentage change (2012 to 2021) | ||
| Broadleaved - Immature | 9,726 | 10,106 | 6,538 | 7,854 | -1,872 | -19.2 | ||
| Broadleaved - Mature | 93,923 | 102,247 | 109,663 | 114,309 | 20,386 | 21.7 | ||
| Broadleaved - All age categories | 103,649 | 112,353 | 116,201 | 122,163 | 18,514 | 17.9 | ||
| Coniferous - Immature | 41,008 | 59,500 | 63,198 | 60,550 | 19,542 | 47.7 | ||
| Coniferous - Mature | 487,504 | 500,968 | 510,576 | 516,975 | 29,471 | 6.0 | ||
| Coniferous - All age categories | 528,512 | 560,468 | 573,774 | 577,525 | 49,013 | 9.3 | ||
| Mixed - Immature | 2,562 | 1,934 | 1,489 | 1,100 | -1,462 | -57.1 | ||
| Mixed - Mature | 32,131 | 36,855 | 39,028 | 40,356 | 8,225 | 25.6 | ||
| Mixed - All age categories | 34,693 | 38,789 | 40,517 | 41,456 | 6,763 | 19.5 | ||
| Transitional | 11,122 | 19,345 | 21,639 | 17,300 | 6,178 | 55.5 | ||
| Total Forests & Woodlands | 677,976 | 730,955 | 752,131 | 758,444 | 80,468 | 11.9 | ||
The distribution of Ireland's Forests & Woodlands, and the change in distribution from 2012 to 2021, can be seen in Maps 2.1 and 2.2. Coniferous forests are clearly the dominant forest type. Due to the size of the forest patches, it is not easy to see exactly where each type of forest occurs. This will be examined in more detail in the next section.
Louth and Dublin were the counties with the lowest total coverage of Forests & Woodlands over the 2012 to 2021 period, with under 4,000 hectares in each county. Cork had the highest total area, increasing to almost 90,000 hectares in 2021. While all counties had an increase in total area covered by Forests & Woodlands over this time period, Donegal had the lowest percentage increase, at less than 5% (2,435 hectares), while the largest percentage increase was seen in Longford, with an increase of more than 25% (2,154 hectares). Table 2.2, Figure 2.2.
Meath, Dublin, and Louth were the counties with the lowest coverage of Forests & Woodlands as a percentage of the total county area in 2021, at 3.7%, 4%, and 4.1% respectively. Wicklow was the county with the highest coverage, at more than 20% of the total area of the county, followed by Leitrim (17.5%) and Clare (15.5%). Table 2.2, Map 2.3, Figure 2.3.
| X-axis label | Area of Forests & Woodlands |
|---|---|
| Cork | 89570 |
| Galway | 59257 |
| Mayo | 56027 |
| Donegal | 55735 |
| Kerry | 55690 |
| Clare | 53511 |
| Tipperary | 49616 |
| Wicklow | 41002 |
| Waterford | 27801 |
| Leitrim | 27786 |
| Limerick | 27573 |
| Roscommon | 25105 |
| Laois | 24773 |
| Sligo | 23025 |
| Kilkenny | 21140 |
| Offaly | 20712 |
| Cavan | 19768 |
| Wexford | 16035 |
| Westmeath | 15231 |
| Longford | 10666 |
| Kildare | 9668 |
| Meath | 8684 |
| Monaghan | 6603 |
| Carlow | 6381 |
| Dublin | 3666 |
| Louth | 3421 |
| X-axis label | Proportion of Forests & Woodlands |
|---|---|
| Wicklow | 20.2 |
| Leitrim | 17.5 |
| Clare | 15.5 |
| Waterford | 15 |
| Laois | 14.4 |
| Sligo | 12.5 |
| Cork | 11.9 |
| Kerry | 11.6 |
| Donegal | 11.5 |
| Tipperary | 11.5 |
| Offaly | 10.4 |
| Cavan | 10.2 |
| Kilkenny | 10.2 |
| Limerick | 10 |
| Mayo | 10 |
| Roscommon | 9.9 |
| Longford | 9.8 |
| Galway | 9.6 |
| Westmeath | 8.3 |
| Carlow | 7.1 |
| Wexford | 6.8 |
| Kildare | 5.7 |
| Monaghan | 5.1 |
| Louth | 4.1 |
| Dublin | 4 |
| Meath | 3.7 |
Cork had the largest total area of Forests & Woodlands in 2021, and the largest total area of Broadleaved (14,950 hectares), Coniferous (67,966 hectares), Mixed (4,636 hectares), and Transitional forests (2,018 hectares). As a proportion of the total area of Forest & Woodlands, Meath had the highest percentage coverage of Broadleaved forests (43.7%), followed by Louth (40.6%) and Kildare (37.1%). Mayo (85.5%), Donegal (84.7%) and Galway (82.7%) had the highest percentage of Coniferous forests. The highest percentage coverage of Mixed forests occurred in Kildare (17.4%), Westmeath (13.7%) and Meath (13.7%). Laois (3.8%), Wicklow (3.7%) and Louth (3.5%) had the highest percentage coverage of Transitional forests. Figure 2.5, Map 2.4, Table 2.3.
| X-axis label | Broadleaved | Coniferous | Mixed | Transitional |
|---|---|---|---|---|
| Carlow | 1298 | 4519 | 401 | 164 |
| Cavan | 4442 | 13531 | 1326 | 469 |
| Clare | 8421 | 42334 | 2082 | 675 |
| Cork | 14950 | 67966 | 4636 | 2018 |
| Donegal | 5604 | 47229 | 1508 | 1393 |
| Dublin | 820 | 2655 | 105 | 85 |
| Galway | 6820 | 49004 | 1881 | 1551 |
| Kerry | 8291 | 43957 | 2745 | 697 |
| Kildare | 3591 | 4338 | 1686 | 53 |
| Kilkenny | 4427 | 14814 | 1375 | 524 |
| Laois | 3549 | 18303 | 1969 | 952 |
| Leitrim | 2998 | 22875 | 1230 | 683 |
| Limerick | 3341 | 22067 | 1669 | 496 |
| Longford | 2518 | 7107 | 990 | 51 |
| Louth | 1389 | 1762 | 151 | 119 |
| Mayo | 4843 | 47928 | 1815 | 1440 |
| Meath | 3795 | 3602 | 1188 | 98 |
| Monaghan | 2033 | 4160 | 311 | 98 |
| Offaly | 5296 | 12235 | 2771 | 410 |
| Roscommon | 3132 | 20425 | 1202 | 346 |
| Sligo | 2696 | 18866 | 904 | 559 |
| Tipperary | 7884 | 37066 | 3068 | 1598 |
| Waterford | 4818 | 20558 | 1608 | 818 |
| Westmeath | 4685 | 8279 | 2081 | 185 |
| Wexford | 4006 | 10639 | 1107 | 284 |
| Wicklow | 6518 | 31306 | 1645 | 1533 |
| X-axis label | Broadleaved | Coniferous | Mixed | Transitional |
|---|---|---|---|---|
| Carlow | 20.3 | 70.8 | 6.3 | 2.6 |
| Cavan | 22.5 | 68.4 | 6.7 | 2.4 |
| Clare | 15.7 | 79.1 | 3.9 | 1.3 |
| Cork | 16.7 | 75.9 | 5.2 | 2.3 |
| Donegal | 10.1 | 84.7 | 2.7 | 2.5 |
| Dublin | 22.4 | 72.4 | 2.9 | 2.3 |
| Galway | 11.5 | 82.7 | 3.2 | 2.6 |
| Kerry | 14.9 | 78.9 | 4.9 | 1.3 |
| Kildare | 37.1 | 44.9 | 17.4 | 0.5 |
| Kilkenny | 20.9 | 70.1 | 6.5 | 2.5 |
| Laois | 14.3 | 73.9 | 7.9 | 3.8 |
| Leitrim | 10.8 | 82.3 | 4.4 | 2.5 |
| Limerick | 12.1 | 80 | 6.1 | 1.8 |
| Longford | 23.6 | 66.6 | 9.3 | 0.5 |
| Louth | 40.6 | 51.5 | 4.4 | 3.5 |
| Mayo | 8.6 | 85.5 | 3.2 | 2.6 |
| Meath | 43.7 | 41.5 | 13.7 | 1.1 |
| Monaghan | 30.8 | 63 | 4.7 | 1.5 |
| Offaly | 25.6 | 59.1 | 13.4 | 2 |
| Roscommon | 12.5 | 81.4 | 4.8 | 1.4 |
| Sligo | 11.7 | 81.9 | 3.9 | 2.4 |
| Tipperary | 15.9 | 74.7 | 6.2 | 3.2 |
| Waterford | 17.3 | 73.9 | 5.8 | 2.9 |
| Westmeath | 30.8 | 54.4 | 13.7 | 1.2 |
| Wexford | 25 | 66.3 | 6.9 | 1.8 |
| Wicklow | 15.9 | 76.4 | 4 | 3.7 |
Learn about our data and confidentiality safeguards, and the steps we take to produce statistics that can be trusted by all.