
| Overseas trips to Ireland | Trips by Irish residents overseas | ||||
| ‘000 | ‘000 | ||||
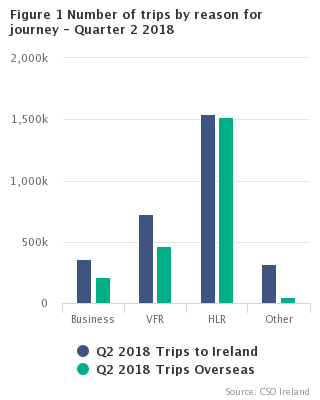
| Reason for journey | Apr - Jun 2017 | Apr - Jun 2018 | Apr - Jun 2017 | Apr - Jun 2018 | |
| Business | 413 | 360 | 240 | 212 | |
| Visits to Friends/Relatives | 632 | 730 | 489 | 465 | |
| Holiday/Leisure/Recreation | 1,419 | 1,545 | 1,345 | 1,522 | |
| Other | 305 | 317 | 46 | 48 | |
| Total | 2,769 | 2,952 | 2,119 | 2,248 | |
Overseas trips to Ireland:
Trips by Irish residents overseas:
| Table 1 Number of overseas trips to Ireland by non-residents classified by mode of travel, type of trip, route of travel, area of residence and reason for journey, 2015 - Quarter 2 2018 | |||||||||||
| '000 | |||||||||||
| 2015 | 2016 | 2017 | 2017 | 2018 | |||||||
| Trips | |||||||||||
| Jan-Mar | Apr-Jun | Jul-Sep | Oct-Dec | Jan-Mar | Apr-Jun | ||||||
| Total overseas trips to the Republic of Ireland | 8,643 | 9,584 | 9,932 | 1,796 | 2,769 | 3,096 | 2,271 | 1,921 | 2,952 | ||
| Trips by mode of travel | |||||||||||
| Air | 7,782 | 8,740 | 9,095 | 1,702 | 2,515 | 2,749 | 2,129 | 1,805 | 2,710 | ||
| Sea | 861 | 844 | 837 | 94 | 255 | 347 | 142 | 116 | 242 | ||
| Trips by type | |||||||||||
| Same-day trips | 894 | 1,157 | 1,206 | 224 | 317 | 371 | 294 | 249 | 333 | ||
| Overnight trips | 7,749 | 8,428 | 8,726 | 1,572 | 2,452 | 2,725 | 1,977 | 1,672 | 2,619 | ||
| Trips by route of travel | |||||||||||
| Cross channel | 4,379 | 4,757 | 4,404 | 932 | 1,174 | 1,239 | 1,058 | 914 | 1,187 | ||
| Continental | 3,076 | 3,416 | 3,716 | 623 | 1,058 | 1,178 | 857 | 709 | 1,215 | ||
| Transatlantic & Other Routes | 1,188 | 1,411 | 1,812 | 241 | 537 | 678 | 355 | 298 | 550 | ||
| Trips by area of residence | |||||||||||
| Great Britain | 3,547 | 3,924 | 3,729 | 796 | 949 | 1,065 | 918 | 798 | 988 | ||
| France | 505 | 531 | 549 | 107 | 169 | 164 | 109 | 97 | 178 | ||
| Germany | 629 | 652 | 681 | 99 | 210 | 225 | 148 | 130 | 245 | ||
| Italy | 321 | 344 | 363 | 60 | 97 | 130 | 76 | 71 | 108 | ||
| Other Europe | 1,588 | 1,774 | 1,888 | 329 | 546 | 568 | 445 | 380 | 573 | ||
| USA & Canada | 1,514 | 1,808 | 2,101 | 293 | 629 | 733 | 447 | 332 | 689 | ||
| Australia & New Zealand | 207 | 204 | 208 | 35 | 54 | 76 | 43 | 35 | 58 | ||
| All other areas | 331 | 346 | 411 | 76 | 115 | 135 | 85 | 78 | 112 | ||
| Trips by reason for journey | |||||||||||
| Business | 1,441 | 1,539 | 1,478 | 351 | 413 | 360 | 354 | 351 | 360 | ||
| Visit to Friends/Relatives | 2,297 | 2,553 | 2,566 | 548 | 632 | 719 | 667 | 529 | 730 | ||
| Holiday/Leisure/Recreation | 4,001 | 4,388 | 4,710 | 691 | 1,419 | 1,632 | 968 | 796 | 1,545 | ||
| Other | 904 | 1,105 | 1,178 | 206 | 305 | 384 | 282 | 244 | 317 | ||
| Table 2 Percentage distribution of overseas trips to Ireland by non-residents with at least one overnight in Ireland, cross classified by area of residence and reason for journey, Quarter 2 2017 and Quarter 2 2018 | |||||||||||
| Trips | Reason for journey | ||||||||||
| Business | Visit to Friends/Relatives | Holiday/Leisure/ Recreation | Other | Total | |||||||
| Apr-Jun 2017 | Apr-Jun 2018 | Apr-Jun 2017 | Apr-Jun 2018 | Apr-Jun 2017 | Apr-Jun 2018 | Apr-Jun 2017 | Apr-Jun 2018 | Apr-Jun 2017 | Apr-Jun 2018 | ||
| Total trips with at least one overnight in Ireland ('000s) | 360 | 304 | 612 | 709 | 1,385 | 1,508 | 95 | 98 | 2,452 | 2,619 | |
| Area of residence (%) | |||||||||||
| Great Britain | 39 | 43 | 55 | 52 | 24 | 24 | 14 | 10 | 34 | 33 | |
| France | 5 | 4 | 4 | 4 | 8 | 8 | 6 | 8 | 6 | 6 | |
| Germany | 6 | 5 | 3 | 6 | 11 | 11 | 9 | 8 | 8 | 9 | |
| Italy | 5 | 3 | 2 | 3 | 4 | 4 | 10 | 7 | 4 | 4 | |
| Other Europe | 30 | 27 | 16 | 19 | 20 | 19 | 30 | 36 | 21 | 20 | |
| USA & Canada | 9 | 11 | 11 | 10 | 28 | 28 | 25 | 24 | 21 | 21 | |
| All other areas (incl. Australia & New Zealand) | 7 | 7 | 8 | 6 | 6 | 6 | 6 | 6 | 6 | 6 | |
| All residencies | 100 | 100 | 100 | 100 | 100 | 100 | 100 | 100 | 100 | 100 | |
| Table 2a Percentage distribution of overseas trips to Ireland by non-residents with at least one overnight in Ireland, cross classified by area of residence and reason for journey, Years 2016 and 2017 | |||||||||||
| Trips | Reason for journey | ||||||||||
| Business | Visit to Friends/Relatives | Holiday/Leisure/ Recreation | Other | Total | |||||||
| 2016 | 2017 | 2016 | 2017 | 2016 | 2017 | 2016 | 2017 | 2016 | 2017 | ||
| Total trips with at least one overnight in Ireland ('000s) | 1,318 | 1,273 | 2,476 | 2,487 | 4,251 | 4,573 | 383 | 393 | 8,428 | 8,726 | |
| Area of residence (%) | |||||||||||
| Great Britain | 47 | 44 | 56 | 56 | 31 | 27 | 14 | 13 | 40 | 37 | |
| France | 5 | 5 | 4 | 4 | 7 | 7 | 9 | 8 | 6 | 6 | |
| Germany | 6 | 6 | 3 | 4 | 10 | 10 | 7 | 9 | 7 | 7 | |
| Italy | 3 | 4 | 2 | 2 | 4 | 4 | 14 | 11 | 4 | 4 | |
| Other Europe | 22 | 25 | 18 | 16 | 18 | 20 | 32 | 33 | 19 | 20 | |
| USA & Canada | 11 | 10 | 9 | 11 | 24 | 27 | 16 | 18 | 17 | 19 | |
| All other areas (incl. Australia & New Zealand) | 6 | 6 | 7 | 8 | 5 | 6 | 8 | 9 | 6 | 7 | |
| All residencies | 100 | 100 | 100 | 100 | 100 | 100 | 100 | 100 | 100 | 100 | |
| Table 3 Percentage distribution of overseas same-day trips to Ireland by non-residents cross classified by area of residence and reason for journey, Quarter 2 2017 and Quarter 2 2018 | ||||||||||
| Trips | Reason for journey1 | |||||||||
| Business | Visit to Friends/Relatives | Holiday/Leisure/ Recreation | Other | Total | ||||||
| Apr-Jun 2017 | Apr-Jun 2018 | Apr-Jun 2017 | Apr-Jun 2018 | Apr-Jun 2017 | Apr-Jun 2018 | Apr-Jun 2017 | Apr-Jun 2018 | Apr-Jun 2017 | Apr-Jun 2018 | |
| Total same-day trips (i.e. no overnight in Ireland) ('000s) | 53 | 56 | 20 | 22 | 34 | 36 | 211 | 219 | 317 | 333 |
| Area of residence (%) | ||||||||||
| Great Britain | 73 | 74 | 46 | 48 | 39 | 34 | 28 | 26 | 38 | 36 |
| Other Europe | 18 | 16 | 18 | 11 | 21 | 13 | 24 | 25 | 22 | 21 |
| All other areas | 10 | 10 | 36 | 41 | 40 | 53 | 48 | 49 | 40 | 42 |
| All residencies | 100 | 100 | 100 | 100 | 100 | 100 | 100 | 100 | 100 | 100 |
| 1 The contents of this table should be interpreted with caution due to small sample sizes. | ||||||||||
| Table 3a Percentage distribution of overseas same-day trips to Ireland by non-residents cross classified by area of residence and reason for journey, Years 2016 and 2017 | ||||||||||
| Trips | Reason for journey1 | |||||||||
| Business | Visit to Friends/Relatives | Holiday/Leisure/ Recreation | Other | Total | ||||||
| 2016 | 2017 | 2016 | 2017 | 2016 | 2017 | 2016 | 2017 | 2016 | 2017 | |
| Total same-day trips (i.e. no overnight in Ireland) ('000s) | 220 | 205 | 78 | 79 | 137 | 137 | 721 | 784 | 1,157 | 1,206 |
| Area of residence (%) | ||||||||||
| Great Britain | 81 | 77 | 52 | 44 | 47 | 44 | 34 | 30 | 46 | 41 |
| Other Europe | 12 | 14 | 20 | 18 | 16 | 19 | 22 | 23 | 19 | 21 |
| All other areas | 7 | 9 | 28 | 38 | 37 | 37 | 44 | 47 | 35 | 38 |
| All residencies | 100 | 100 | 100 | 100 | 100 | 100 | 100 | 100 | 100 | 100 |
| 1 The contents of this table should be interpreted with caution due to small sample sizes. | ||||||||||
| Table 4 Number of bednights spent in Ireland by non-residents on overseas trips cross classified by type of accommodation used and area of residence, Quarter 2 2017 and Quarter 2 2018 | |||||||||||
| '000 | |||||||||||
| Bednights | Area of Residence | ||||||||||
| Great Britain | Other Europe | USA & Canada | All Other Areas | Total | |||||||
| Apr-Jun 2017 | Apr-Jun 2018 | Apr-Jun 2017 | Apr-Jun 2018 | Apr-Jun 2017 | Apr-Jun 2018 | Apr-Jun 2017 | Apr-Jun 2018 | Apr-Jun 2017 | Apr-Jun 2018 | ||
| Type of accommodation used | |||||||||||
| Hotel | 1,117 | 1,019 | 2,401 | 2,178 | 2,080 | 1,937 | 460 | 455 | 6,058 | 5,589 | |
| Guest House/B&B | 387 | 309 | 1,119 | 1,379 | 837 | 930 | 174 | 258 | 2,518 | 2,876 | |
| Rented House/Apartment | 408 | 290 | 1,368 | 1,970 | 567 | 581 | 423 | 380 | 2,766 | 3,221 | |
| Friends/Relatives | 1,415 | 1,618 | 1,190 | 1,428 | 439 | 457 | 688 | 578 | 3,733 | 4,082 | |
| Other | 788 | 640 | 1,749 | 1,489 | 463 | 522 | 241 | 265 | 3,241 | 2,916 | |
| Total | 4,115 | 3,877 | 7,828 | 8,443 | 4,387 | 4,428 | 1,986 | 1,936 | 18,316 | 18,684 | |
| Table 4a Number of bednights spent in Ireland by non-residents on overseas trips cross classified by type of accommodation used and area of residence, Years 2016 and 2017 | |||||||||||
| '000 | |||||||||||
| Bednights | Area of Residence | ||||||||||
| Great Britain | Other Europe | USA & Canada | All Other Areas | Total | |||||||
| 2016 | 2017 | 2016 | 2017 | 2016 | 2017 | 2016 | 2017 | 2016 | 2017 | ||
| Type of accommodation used | |||||||||||
| Hotel | 4,554 | 4,027 | 7,088 | 7,131 | 5,385 | 6,402 | 1,495 | 1,623 | 18,522 | 19,183 | |
| Guest House/B&B | 1,048 | 1,174 | 4,077 | 4,191 | 2,080 | 2,533 | 649 | 696 | 7,854 | 8,594 | |
| Rented House/Apartment | 1,377 | 1,435 | 5,345 | 5,480 | 1,703 | 1,633 | 1,962 | 2,277 | 10,387 | 10,825 | |
| Friends/Relatives | 6,674 | 6,617 | 5,886 | 5,136 | 2,036 | 2,177 | 2,624 | 3,038 | 17,219 | 16,969 | |
| Other | 2,785 | 3,214 | 6,610 | 6,745 | 1,809 | 1,781 | 1,213 | 1,341 | 12,417 | 13,082 | |
| Total | 16,437 | 16,468 | 29,006 | 28,683 | 13,013 | 14,525 | 7,943 | 8,976 | 66,399 | 68,652 | |
| Table 5 Number of bednights spent in Ireland by non-residents on overseas trips cross classified by type of accommodation used and reason for journey, Quarter 2 2017 and Quarter 2 2018 | |||||||||||
| '000 | |||||||||||
| Bednights | Reason for journey | ||||||||||
| Business | Visit to Friends/Relatives | Holiday/Leisure/ Recreation | Other | Total | |||||||
| Apr-Jun 2017 | Apr-Jun 2018 | Apr-Jun 2017 | Apr-Jun 2018 | Apr-Jun 2017 | Apr-Jun 2018 | Apr-Jun 2017 | Apr-Jun 2018 | Apr-Jun 2017 | Apr-Jun 2018 | ||
| Type of accommodation used | |||||||||||
| Hotel | 1,075 | 826 | 683 | 514 | 4,141 | 4,055 | 159 | 195 | 6,058 | 5,589 | |
| Guest House/B&B | 195 | 244 | 233 | 287 | 1,883 | 2,115 | 207 | 231 | 2,518 | 2,876 | |
| Rented House/Apartment | 597 | 459 | 247 | 242 | 611 | 864 | 1,311 | 1,656 | 2,766 | 3,221 | |
| Friends/Relatives | 141 | 204 | 2,660 | 3,071 | 696 | 636 | 235 | 171 | 3,733 | 4,082 | |
| Other | 342 | 318 | 442 | 519 | 1,552 | 1,441 | 904 | 637 | 3,241 | 2,916 | |
| Total | 2,350 | 2,051 | 4,265 | 4,632 | 8,884 | 9,110 | 2,817 | 2,890 | 18,316 | 18,684 | |
| Table 5a Number of bednights spent in Ireland by non-residents on overseas trips cross classified by type of accommodation used and reason for journey, Years 2016 and 2017 | |||||||||||
| '000 | |||||||||||
| Bednights | Reason for journey | ||||||||||
| Business | Visit to Friends/Relatives | Holiday/Leisure/ Recreation | Other | Total | |||||||
| 2016 | 2017 | 2016 | 2017 | 2016 | 2017 | 2016 | 2017 | 2016 | 2017 | ||
| Type of accommodation used | |||||||||||
| Hotel | 3,856 | 3,814 | 1,769 | 2,050 | 12,369 | 12,853 | 528 | 465 | 18,522 | 19,183 | |
| Guest House/B&B | 507 | 618 | 795 | 864 | 5,549 | 6,101 | 1,003 | 1,010 | 7,854 | 8,594 | |
| Rented House/Apartment | 2,300 | 2,449 | 852 | 933 | 2,443 | 2,546 | 4,792 | 4,897 | 10,387 | 10,825 | |
| Friends/Relatives | 882 | 760 | 12,729 | 12,274 | 2,844 | 3,080 | 764 | 854 | 17,219 | 16,969 | |
| Other | 1,218 | 1,437 | 2,198 | 2,232 | 5,025 | 5,539 | 3,975 | 3,874 | 12,417 | 13,082 | |
| Total | 8,764 | 9,078 | 18,343 | 18,355 | 28,230 | 30,118 | 11,062 | 11,101 | 66,399 | 68,652 | |
| Table 6 Estimated average length of stay (nights) by non-residents on all overseas trips to Ireland classified by area of residence and reason for journey, 2015 - Quarter 2 2018 | ||||||||||||
| Nights | ||||||||||||
| 2015 | 2016 | 2017 | 2017 | 2018 | ||||||||
| Average length of stay | ||||||||||||
| Jan-Mar | Apr-Jun | Jul-Sep | Oct-Dec | Jan-Mar | Apr-Jun | |||||||
| All overseas trips to Ireland | 7.1 | 6.9 | 6.9 | 6.2 | 6.6 | 7.6 | 6.9 | 6.5 | 6.3 | |||
| Trips by area of residence | ||||||||||||
| Great Britain | 4.3 | 4.2 | 4.4 | 4.0 | 4.3 | 5.2 | 3.9 | 3.9 | 3.9 | |||
| France | 8.6 | 9.4 | 9.3 | 8.6 | 8.1 | 9.5 | 11.3 | 9.1 | 8.7 | |||
| Germany | 9.5 | 8.6 | 8.3 | 8.4 | 7.5 | 8.8 | 8.7 | 7.5 | 7.5 | |||
| Italy | 8.6 | 7.8 | 8.5 | 5.7 | 8.8 | 9.0 | 9.6 | 6.9 | 6.8 | |||
| Other Europe | 8.7 | 8.9 | 7.8 | 7.1 | 7.4 | 8.8 | 7.8 | 8.0 | 7.5 | |||
| USA & Canada | 7.7 | 7.2 | 6.9 | 6.0 | 7.0 | 7.3 | 6.8 | 6.2 | 6.4 | |||
| Australia & New Zealand | 12.3 | 12.5 | 12.6 | 15.8 | 11.2 | 12.5 | 12.1 | 13.8 | 12.0 | |||
| All other areas | 15.1 | 15.6 | 15.5 | 16.5 | 12.0 | 14.7 | 20.3 | 19.1 | 11.0 | |||
| Trips by reason for journey | ||||||||||||
| Business | 5.3 | 5.7 | 6.1 | 5.0 | 5.7 | 6.6 | 7.3 | 5.9 | 5.7 | |||
| Visit to Friends/Relatives | 7.3 | 7.2 | 7.2 | 7.4 | 6.8 | 8.2 | 6.2 | 7.1 | 6.3 | |||
| Holiday/Leisure/Recreation | 6.5 | 6.4 | 6.4 | 4.9 | 6.3 | 7.7 | 5.5 | 5.2 | 5.9 | |||
| Other | 11.9 | 10.0 | 9.4 | 9.4 | 9.2 | 7.1 | 12.8 | 10.5 | 9.1 | |||
| Table 6a Estimated average length of stay (nights) by non-residents on all overseas trips to Ireland cross classified by area of residence and reason for journey, Quarter 2 2017 and Quarter 2 2018 | |||||||||||
| Nights | |||||||||||
| Average length of stay | Reason for journey | ||||||||||
| Business | Visit to Friends/Relatives | Holiday/Leisure/ Recreation | Other | Total | |||||||
| Apr-Jun 2017 | Apr-Jun 2018 | Apr-Jun 2017 | Apr-Jun 2018 | Apr-Jun 2017 | Apr-Jun 2018 | Apr-Jun 2017 | Apr-Jun 2018 | Apr-Jun 2017 | Apr-Jun 2018 | ||
| Area of Residence | |||||||||||
| Great Britain | 3.9 | 2.4 | 4.9 | 4.9 | 4.4 | 4.1 | 2.0 | 1.3 | 4.3 | 3.9 | |
| France | 4.7 | 8.3 | 5.6 | 6.2 | 7.3 | 6.7 | 23.3 | 26.1 | 8.1 | 8.7 | |
| Germany | 3.0 | 7.4 | 6.3 | 6.7 | 7.9 | 7.5 | 12.4 | 10.1 | 7.5 | 7.5 | |
| Italy | 11.4 | 4.9 | 9.5 | 5.4 | 5.8 | 4.9 | 16.2 | 20.4 | 8.8 | 6.8 | |
| Other Europe | 6.6 | 10.5 | 8.2 | 7.3 | 5.6 | 5.3 | 15.9 | 13.5 | 7.4 | 7.5 | |
| USA & Canada | 6.7 | 6.3 | 8.0 | 7.5 | 7.1 | 6.7 | 5.9 | 4.9 | 7.0 | 6.4 | |
| All other areas (incl. Australia & New Zealand) | 12.3 | 8.9 | 14.5 | 14.2 | 8.1 | 7.7 | 19.8 | 29.5 | 11.7 | 11.4 | |
| Total | 5.7 | 5.7 | 6.8 | 6.3 | 6.3 | 5.9 | 9.2 | 9.1 | 6.6 | 6.3 | |
| Table 6b Estimated average length of stay (nights) by non-residents on all overseas trips to Ireland cross classified by area of residence and reason for journey, Years 2016 and 2017 | |||||||||||
| Nights | |||||||||||
| Average length of stay | Reason for journey | ||||||||||
| Business | Visit to Friends/Relatives | Holiday/Leisure/ Recreation | Other | Total | |||||||
| 2016 | 2017 | 2016 | 2017 | 2016 | 2017 | 2016 | 2017 | 2016 | 2017 | ||
| Area of Residence | |||||||||||
| Great Britain | 2.8 | 3.6 | 5.3 | 5.3 | 4.3 | 4.4 | 1.7 | 2.0 | 4.2 | 4.4 | |
| France | 8.0 | 10.9 | 7.3 | 6.5 | 7.8 | 7.3 | 21.5 | 21.9 | 9.4 | 9.3 | |
| Germany | 6.6 | 5.0 | 6.8 | 7.4 | 8.2 | 8.0 | 18.2 | 16.3 | 8.6 | 8.3 | |
| Italy | 8.3 | 11.1 | 7.8 | 7.7 | 6.1 | 6.0 | 12.1 | 16.1 | 7.8 | 8.5 | |
| Other Europe | 10.4 | 8.1 | 8.4 | 7.8 | 6.6 | 6.1 | 16.3 | 14.2 | 8.9 | 7.8 | |
| USA & Canada | 5.7 | 7.0 | 9.4 | 8.8 | 7.3 | 7.3 | 5.9 | 4.1 | 7.2 | 6.9 | |
| All other areas (incl. Australia & New Zealand) | 12.0 | 13.4 | 15.9 | 16.6 | 9.7 | 9.3 | 30.0 | 29.5 | 14.4 | 14.5 | |
| Total | 5.7 | 6.1 | 7.2 | 7.2 | 6.4 | 6.4 | 10.0 | 9.4 | 6.9 | 6.9 | |
| Table 7 Expenditure by non-residents on overseas trips to Ireland classified by type of trip, area of residence, reason for journey and total overseas tourism and travel earnings, 2015 - Quarter 2 2018 | |||||||||||
| € million | |||||||||||
| 2015 | 2016 | 2017 | 2017 | 2018 | |||||||
| Estimated expenditure | |||||||||||
| Jan-Mar | Apr-Jun | Jul-Sep | Oct-Dec | Jan-Mar | Apr-Jun | ||||||
| Total expenditure in Ireland (excluding fares) (1) | 4,208 | 4,577 | 4,874 | 684 | 1,408 | 1,736 | 1,046 | 795 | 1,475 | ||
| Fare receipts of Irish carriers from overseas travellers to Ireland (2) | 1,322 | 1,487 | 1,611 | 261 | 468 | 551 | 331 | 284 | 495 1 | ||
| Total overseas tourism and travel earnings (1) + (2) | 5,530 | 6,064 | 6,485 | 945 | 1,876 | 2,287 | 1,377 | 1,079 | 1,970 1 | ||
| Total expenditure in Ireland (excluding fares) by trip type | |||||||||||
| Same-day trips | 38 | 48 | 53 | 10 | 16 | 13 | 14 | 9 | 14 | ||
| Overnight trips | 4,169 | 4,529 | 4,822 | 675 | 1,392 | 1,723 | 1,031 | 786 | 1,462 | ||
| Total expenditure in Ireland (excluding fares) by area of residence | |||||||||||
| Great Britain | 971 | 1,061 | 1,007 | 198 | 267 | 303 | 239 | 206 | 262 | ||
| France | 236 | 274 | 295 | 51 | 82 | 99 | 63 | 48 | 104 | ||
| Germany | 397 | 388 | 399 | 40 | 135 | 146 | 78 | 55 | 153 | ||
| Italy | 153 | 175 | 190 | 23 | 55 | 80 | 33 | 30 | 46 | ||
| Other Europe | 771 | 821 | 883 | 121 | 250 | 316 | 196 | 151 | 262 | ||
| USA & Canada | 1,197 | 1,335 | 1,523 | 152 | 476 | 580 | 315 | 194 | 493 | ||
| Australia & New Zealand | 200 | 204 | 207 | 38 | 53 | 76 | 41 | 35 | 56 | ||
| All other areas | 283 | 319 | 370 | 61 | 92 | 137 | 81 | 76 | 98 | ||
| Total expenditure in Ireland (excluding | |||||||||||
| fares) by reason for journey | |||||||||||
| Business | 675 | 724 | 766 | 151 | 213 | 199 | 204 | 169 | 189 | ||
| Visit to Friends/Relatives | 803 | 864 | 895 | 185 | 218 | 281 | 211 | 181 | 240 | ||
| Holiday/Leisure/Recreation | 2,330 | 2,547 | 2,758 | 283 | 861 | 1,106 | 507 | 350 | 925 | ||
| Other | 400 | 443 | 456 | 65 | 116 | 151 | 124 | 95 | 121 | ||
| 1 Provisional data that may be subject to future revisions. | |||||||||||
| Table 7a Total expenditure (excl fares) by non-residents on overseas trips to Ireland cross classified by area of residence and reason for journey, Quarter 2 2017 and Quarter 2 2018 | |||||||||||
| € million | |||||||||||
| Estimated expenditure | Reason for journey | ||||||||||
| Business | Visit to Friends/Relatives | Holiday/Leisure/ Recreation | Other | Total | |||||||
| Apr-Jun 2017 | Apr-Jun 2018 | Apr-Jun 2017 | Apr-Jun 2018 | Apr-Jun 2017 | Apr-Jun 2018 | Apr-Jun 2017 | Apr-Jun 2018 | Apr-Jun 2017 | Apr-Jun 2018 | ||
| Area of Residence | |||||||||||
| Great Britain | 60 | 54 | 82 | 85 | 118 | 119 | 7 | 4 | 267 | 262 | |
| France | 10 | 11 | 9 | 12 | 57 | 64 | 7 | 17 | 82 | 104 | |
| Germany | 12 | 9 | 7 | 12 | 105 | 121 | 10 | 11 | 135 | 153 | |
| Italy | 15 | 6 | 4 | 7 | 26 | 27 | 10 | 7 | 55 | 46 | |
| Other Europe | 55 | 49 | 34 | 38 | 130 | 140 | 30 | 35 | 250 | 262 | |
| USA & Canada | 37 | 37 | 40 | 46 | 362 | 381 | 37 | 28 | 476 | 493 | |
| All other areas (incl. Australia & New Zealand) | 24 | 23 | 41 | 40 | 64 | 73 | 15 | 18 | 144 | 154 | |
| Total | 213 | 189 | 218 | 240 | 861 | 925 | 116 | 121 | 1,408 | 1,475 | |
| Table 7b Total expenditure (excl fares) by non-residents on overseas trips to Ireland cross classified by area of residence and reason for journey, Years 2016 and 2017 | |||||||||||
| € million | |||||||||||
| Estimated expenditure | Reason for journey | ||||||||||
| Business | Visit to Friends/Relatives | Holiday/Leisure/ Recreation | Other | Total | |||||||
| 2016 | 2017 | 2016 | 2017 | 2016 | 2017 | 2016 | 2017 | 2016 | 2017 | ||
| Area of Residence | |||||||||||
| Great Britain | 234 | 223 | 344 | 344 | 455 | 410 | 28 | 30 | 1,061 | 1,007 | |
| France | 31 | 37 | 29 | 31 | 175 | 187 | 40 | 40 | 274 | 295 | |
| Germany | 43 | 43 | 32 | 30 | 285 | 289 | 28 | 37 | 388 | 399 | |
| Italy | 26 | 36 | 18 | 19 | 84 | 96 | 47 | 40 | 175 | 190 | |
| Other Europe | 161 | 184 | 143 | 130 | 391 | 434 | 126 | 136 | 821 | 883 | |
| USA & Canada | 130 | 150 | 143 | 164 | 963 | 1,124 | 98 | 86 | 1,335 | 1,523 | |
| All other areas (incl. Australia & New Zealand) | 99 | 94 | 154 | 178 | 194 | 218 | 76 | 87 | 524 | 577 | |
| Total | 724 | 766 | 864 | 895 | 2,547 | 2,758 | 443 | 456 | 4,577 | 4,874 | |
| Table 8 Number of overseas trips by Irish residents classified by mode of travel, type of trip, route of travel and reason for journey, 2015 - Quarter 2 2018 | |||||||||||
| '000 | |||||||||||
| 2015 | 2016 | 2017 | 2017 | 2018 | |||||||
| Trips | |||||||||||
| Jan-Mar | Apr-Jun | Jul-Sep | Oct-Dec | Jan-Mar | Apr-Jun | ||||||
| Total overseas trips by Irish residents | 6,965 | 7,405 | 7,939 | 1,569 | 2,119 | 2,495 | 1,756 | 1,599 | 2,248 | ||
| Trips by mode of travel | |||||||||||
| Air | 6,561 | 7,023 | 7,536 | 1,516 | 2,009 | 2,319 | 1,692 | 1,551 | 2,151 | ||
| Sea | 404 | 382 | 403 | 53 | 110 | 176 | 64 | 48 | 97 | ||
| Trips by type | |||||||||||
| Same-day trips | 184 | 181 | 211 | 59 | 65 | 46 | 41 | 41 | 44 | ||
| Overnight trips | 6,781 | 7,224 | 7,728 | 1,509 | 2,054 | 2,449 | 1,715 | 1,558 | 2,204 | ||
| Trips by route of travel | |||||||||||
| Cross channel | 2,617 | 2,683 | 2,877 | 673 | 738 | 794 | 673 | 656 | 733 | ||
| Continental | 3,772 | 4,142 | 4,376 | 779 | 1,217 | 1,472 | 908 | 799 | 1,314 | ||
| Transatlantic & Other Routes | 577 | 580 | 686 | 118 | 163 | 230 | 175 | 144 | 201 | ||
| Trips by reason for journey | |||||||||||
| Business | 890 | 817 | 879 | 236 | 240 | 177 | 227 | 231 | 212 | ||
| Visit to Friends/Relatives | 1,684 | 1,751 | 1,790 | 441 | 489 | 455 | 406 | 404 | 465 | ||
| Holiday/Leisure/Recreation | 4,209 | 4,563 | 5,058 | 855 | 1,345 | 1,808 | 1,050 | 928 | 1,522 | ||
| Other | 182 | 273 | 212 | 37 | 46 | 56 | 73 | 37 | 48 | ||
| Table 9 Estimated average length of stay (nights) by Irish residents on all overseas trips classified by route of travel and reason for journey, 2015 - Quarter 2 2018 | |||||||||||
| Nights | |||||||||||
| 2015 | 2016 | 2017 | 2017 | 2018 | |||||||
| Average length of stay | |||||||||||
| Jan-Mar | Apr-Jun | Jul-Sep | Oct-Dec | Jan-Mar | Apr-Jun | ||||||
| All overseas trips by Irish residents | 7.6 | 7.6 | 7.2 | 6.0 | 6.8 | 9.0 | 6.0 | 6.2 | 6.7 | ||
| Trips by route of travel | |||||||||||
| Cross channel | 5.0 | 5.0 | 4.8 | 4.5 | 4.6 | 6.1 | 4.0 | 4.4 | 4.6 | ||
| Continental | 8.4 | 8.6 | 8.2 | 6.9 | 7.7 | 10.1 | 6.9 | 7.1 | 7.6 | ||
| Transatlantic & Other Routes | 13.6 | 11.9 | 10.3 | 9.6 | 10.0 | 12.0 | 8.7 | 9.7 | 9.1 | ||
| Trips by reason for journey | |||||||||||
| Business | 3.7 | 3.6 | 3.6 | 3.0 | 2.9 | 5.5 | 3.7 | 3.3 | 3.6 | ||
| Visit to Friends/Relatives | 6.8 | 5.8 | 5.4 | 5.6 | 5.1 | 6.2 | 4.5 | 5.6 | 5.0 | ||
| Holiday/Leisure/Recreation | 8.6 | 8.9 | 8.4 | 7.1 | 8.1 | 10.1 | 7.0 | 7.2 | 7.6 | ||
| Other | 8.4 | 7.5 | 6.8 | 6.6 | 7.3 | 6.1 | 7.2 | 4.9 | 10.9 | ||
| Table 10 Estimated expenditure by Irish residents on overseas trips classified by reason for journey and total overseas tourism and travel expenditure, 2015 - Quarter 2 2018 | |||||||||||
| € million | |||||||||||
| 2015 | 2016 | 2017 | 2017 | 2018 | |||||||
| Estimated expenditure | |||||||||||
| Jan-Mar | Apr-Jun | Jul-Sep | Oct-Dec | Jan-Mar | Apr-Jun | ||||||
| Total expenditure (including fares) (1) | 5,843 | 6,350 | 6,594 | 1,173 | 1,664 | 2,362 | 1,394 | 1,299 | 1,831 | ||
| Fare payments by Irish travellers abroad to Irish carriers (2) | 1,148 | 1,247 | 1,377 | 221 | 383 | 487 | 287 | 252 | 393 1 | ||
| Total overseas tourism and travel expenditure (1) - (2) | 4,695 | 5,103 | 5,217 | 952 | 1,281 | 1,875 | 1,107 | 1,047 | 1,438 1 | ||
| Total expenditure (including fares) by reason for journey | |||||||||||
| Business | 650 | 606 | 617 | 152 | 164 | 133 | 169 | 164 | 172 | ||
| Visit to Friends/Relatives | 968 | 936 | 909 | 236 | 245 | 240 | 188 | 203 | 224 | ||
| Holiday/Leisure/Recreation | 4,089 | 4,608 | 4,912 | 763 | 1,227 | 1,944 | 977 | 908 | 1,391 | ||
| Other | 136 | 199 | 156 | 22 | 28 | 46 | 60 | 23 | 44 | ||
| 1 Provisional data that may be subject to future revisions. | |||||||||||
| Table 11 Tourism and travel estimated earnings from non-residents on overseas trips to Ireland and expenditure by Irish residents on overseas trips, 2015 - Quarter 2 2018 | |||||||||||
| € million | |||||||||||
| Estimated earnings and expenditure | 2015 | 2016 | 2017 | 2017 | 2018 | ||||||
| Jan-Mar | Apr-Jun | Jul-Sep | Oct-Dec | Jan-Mar | Apr-Jun | ||||||
| Overseas tourism and travel earnings from trips to Ireland | 5,530 | 6,064 | 6,485 | 945 | 1,876 | 2,287 | 1,377 | 1,079 | 1,970 1 | ||
| Overseas tourism and travel expenditure by Irish travellers abroad | 4,695 | 5,103 | 5,217 | 952 | 1,281 | 1,875 | 1,107 | 1,047 | 1,438 1 | ||
| Tourism and travel balance | 835 | 961 | 1,268 | -7 | 595 | 412 | 270 | 32 | 532 1 | ||
| 1 Provisional data that may be subject to future revisions. | |||||||||||
Introduction
The data in this release gives details on the number of overseas trips to Ireland and Irish trips abroad. It provides data on country of residence, reason for journey, the average length of stay (nights) and expenditure of overseas travellers to Ireland and by Irish residents on trips abroad.
Ireland
For the purposes of this release, Ireland refers to the Republic of Ireland.
Data Sources
The Central Statistics Office (CSO) carries out two sample surveys of passengers at airports and seaports. These are the Country of Residence Survey (CRS) and the Passenger Card Inquiry (PCI). Data from these surveys are used in conjunction with passenger movement figures supplied by the air and sea transport companies to provide the estimates for overseas tourism and travel in this release. The Country of Residence Survey is a continuous sample survey of passengers (both inward and outward) which provides an estimated country of residence breakdown for passengers entering and leaving Ireland. This distribution is applied to the total passenger movement figures to provide estimates of Irish trips abroad and trips to Ireland by non-residents. Trips to Ireland are categorised into the areas of residence shown in this release.
The Passenger Card Inquiry is a continuous sample survey of incoming and departing passengers. This survey provides information on the reason for journey, length of stay, expenditure and fare costs, in addition to residency. The results are combined with the overall residency estimates from the Country of Residence Survey to provide the overseas tourism and travel details shown in this release.
Periodicity
Quarterly.
Scope
The length of stay, residency, reason for journey, accommodation type (inbound travellers only) expenditure and fare costs for overseas travel into and out of Ireland.
Coverage
This release provides information on overseas travel into and out of Ireland. The results for overseas travel to Ireland are based on the travel and expenditure patterns of departing non-resident passengers while results for overseas travel by Irish residents are based on departing and incoming Irish passengers.
Travel by residents of Northern Ireland into or out of Ireland or travel within Ireland by Irish residents is excluded from this publication.
Data Collection
This release is based on the results of the Passenger Card Inquiry. The PCI surveys passengers at Dublin, Cork, Shannon and Knock airports and at Rosslare, Ringaskiddy and Dublin seaports. Data on the country of residence, length of stay, reason for journey, expenditure and fare costs is collected from passengers who complete a questionnaire provided by one of a team of Central Statistics Office (CSO) interviewers. This data is also collected by the Office of National Statistics staff on behalf of the CSO at Holyhead seaport covering passengers coming into the Republic of Ireland from Holyhead.
Sample Design
A sample of flights and sailings is selected to facilitate proper representation of airport/seaport pairings (e.g. Dublin-London Heathrow), day, night, weekday and weekend flights/sailings. The PCI card is then distributed by CSO interviewers to all passengers on these flights and sailings.
Where expenditure or fare data is missing, results are imputed using the ‘nearest neighbour’ imputation methodology. In other words, these expenditures and fares are estimated using the average fares of other observations in the sample with similar characteristics.
Sample Size
The effective sample size for the PCI in Quarter 2 2018 was 51,000 passengers.
Definitions
Trip
In this release, a trip is defined as a journey (usually including a return) from one place to another, for any purpose (i.e. both tourism and non-tourism). The number of trips is calculated as the sum of both outward journeys and inward journeys divided by two.
Same Day Traveller
A traveller is classified as a same day traveller if his/her trip does not include an overnight stay.
Transit/Transfer Passengers
Transit passengers are defined as those who make a stop at an airport without any particular purpose other than being en route to another destination. These passengers generally do not disembark from their aircraft and are therefore not covered by the Passenger Card Inquiry.
Transfer passengers or ‘connecting passengers’ are also defined as those who make a stop at an airport without any particular purpose other than being en route to another destination. However, unlike transits, transfer passengers disembark the aircraft and pass through the airport en route to their connecting flight. Such passengers are included in the estimates of trips and expenditure for the Tourism and Travel release and are treated in the same manner as same-day visits. They are surveyed for the Passenger Card Inquiry.
Country of Residence
Country of Residence is defined as the country in which the person has resided for 12 months prior to interview.
Total Expenditure
Total expenditure refers to the amount paid for the acquisition or consumption of goods and services for one’s own use or for use by others, for and during trips. It includes expenditure by travellers themselves, as well as expenses that are paid for or reimbursed by others. For example, expenses paid by another person (e.g. gift) or expenses paid directly by the employer for employees on business travel are included.
Total expenditure does not include purchases of land, real estate or motor vehicles.
Overseas Tourism & Travel Earnings
Overseas tourism and travel earnings refers to the total expenditure by overseas travellers while in Ireland plus fares paid by them to Irish air and sea carriers.
Overseas Tourism & Travel Expenditure
Overseas tourism and travel expenditure refers to the total expenditure of Irish residents on overseas trips (including all fares) less fares paid by them to Irish air and sea carriers.
Tourism & Travel Balance
This refers to the difference between tourism and travel earnings from overseas trips to Ireland and tourism and travel expenditure on trips abroad by Irish residents.
Rounding
Individual figures have been rounded independently and the sum of component items therefore may not necessarily add to the totals shown.
 Hide Background Notes
Scan the QR code below to view this release online or go to
http://www.cso.ie/en/releasesandpublications/er/tt/tourismandtravelquarter22018/
 Show Table 1 Number of overseas trips to Ireland by non-residents classified by mode of travel, type of trip, route of travel, area of residence and reason for journey, 2015 - Quarter 2 2018
 Hide Table 1 Number of overseas trips to Ireland by non-residents classified by mode of travel, type of trip, route of travel, area of residence and reason for journey, 2015 - Quarter 2 2018