
This release has been compiled during the COVID-19 crisis. The results contained in this release reflect some of the impacts of the COVID-19 pandemic. See Press Statement.
| Tonnage of goods handled by main Irish ports, Quarter 2 2018-2020 | ||||
| '000 tonnes | ||||
| Category of goods | Q2 2018 | Q2 2019 | Q2 2020 | % Change Q2 2019-2020 |
| Liquid bulk | 2,903 | 2,385 | 2,514 | 5.4% |
| Dry bulk | 4,112 | 3,547 | 3,245 | -8.5% |
| Lift-on/lift-off | 1,949 | 2,097 | 1,946 | -7.2% |
| Roll-on/roll-off | 4,131 | 4,031 | 3,151 | -21.8% |
| Break bulk & other goods | 249 | 280 | 187 | -33.2% |
| Total | 13,344 | 12,340 | 11,043 | -10.5% |
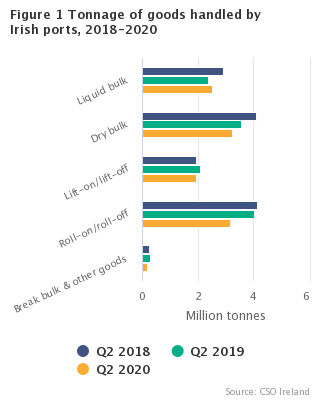
The seven main Irish ports handled 11.0 million tonnes of goods in Q2 2020, a decrease of 10.5% compared with Q2 2019. Goods forwarded from these ports amounted to 3.8 million tonnes in Q2 2020, while a total of 7.2 million tonnes of goods were received. See table 2.
The tonnage of goods handled decreased in four of the five traffic categories in Q2 2020 compared to the same period in 2019, but there was an increase in Liquid bulk traffic (+5.4%). See table 2 and graph.
The results also show that:
| Table 1: Number of arrivals and gross tonnage of vessels, Quarter 2 2018-2020 | ||||||||
| Port | Q2 2018 | Q2 2019 | Q2 2020 | |||||
| Number | Gross tonnage '000 | Number | Gross tonnage '000 | Number | Gross tonnage '000 | |||
| Bantry Bay | 11 | 347 | 4 | 164 | 11 | 426 | ||
| Cork | 405 | 7,813 | 391 | 7,871 | 269 | 2,940 | ||
| Drogheda | 111 | 295 | 110 | 303 | 98 | 252 | ||
| Dublin | 2,083 | 47,034 | 2,054 | 50,261 | 1,671 | 45,414 | ||
| Rosslare | 456 | 12,774 | 412 | 7,709 | 417 | 10,449 | ||
| Shannon Foynes | 128 | 1,685 | 127 | 1,549 | 105 | 1,354 | ||
| Waterford | 140 | 888 | 118 | 645 | 107 | 568 | ||
| Total | 3,334 | 70,837 | 3,216 | 68,503 | 2,678 | 61,405 | ||
| Table 2: Tonnage of goods handled classified by category of traffic, Quarter 2 2018-2020 | ||||
| ‘000 | ||||
| Category of traffic | Q2 2018 | Q2 2019 | Q2 2020 | % Change Q2 2019-2020 |
| Goods received | ||||
| Liquid bulk | 2,229 | 2,018 | 1,978 | -2.0% |
| Dry bulk | 3,033 | 2,570 | 2,419 | -5.9% |
| Lift-on/lift-off traffic1 | 1,030 | 1,123 | 1,021 | -9.1% |
| Roll-on/roll-off traffic | 2,204 | 2,156 | 1,715 | -20.5% |
| Break bulk and all other goods | 97 | 146 | 84 | -42.5% |
| Total | 8,593 | 8,014 | 7,216 | -10.0% |
| Goods forwarded | ||||
| Liquid bulk | 673 | 367 | 536 | 46.0% |
| Dry bulk | 1,079 | 977 | 826 | -15.5% |
| Lift-on/lift-off traffic1 | 920 | 973 | 925 | -4.9% |
| Roll-on/roll-off traffic | 1,927 | 1,875 | 1,436 | -23.4% |
| Break bulk and all other goods | 152 | 134 | 103 | -23.1% |
| Total | 4,751 | 4,326 | 3,826 | -11.6% |
| Total goods handled | ||||
| Liquid bulk | 2,903 | 2,385 | 2,514 | 5.4% |
| Dry bulk | 4,112 | 3,547 | 3,245 | -8.5% |
| Lift-on/lift-off traffic1 | 1,949 | 2,097 | 1,946 | -7.2% |
| Roll-on/roll-off traffic | 4,131 | 4,031 | 3,151 | -21.8% |
| Break bulk and all other goods | 249 | 280 | 187 | -33.2% |
| Total | 13,344 | 12,340 | 11,043 | -10.5% |
| 1 Data is provisional for Q2 2020 | ||||
| Table 3: Details of roll-on/roll-off traffic handled by port, Quarter 2 2020 | |||||||||||
| Port | Passenger cars, motorcycles and accompanying trailers/caravans | Passenger buses | Trade vehicles1 | Freight vehicles/trailers2 | |||||||
| Number | Number | Number | Tonnes '000 | Loaded | Empty | Total | |||||
| Number | Tonnes '000 | Number | Number | ||||||||
| Received | |||||||||||
| Cork | 0 | 0 | 4,805 | 6 | 109 | 3 | 8 | 117 | |||
| Dublin | 10,907 | 17 | 10,166 | 10 | 108,624 | 1,638 | 4,425 | 113,049 | |||
| Rosslare | 946 | 1 | 202 | 0 | 5,038 | 57 | 106 | 5,144 | |||
| Total | 11,853 | 18 | 15,173 | 16 | 113,771 | 1,699 | 4,539 | 118,310 | |||
| Forwarded | |||||||||||
| Cork | 0 | 0 | 103 | 0 | 83 | 3 | 15 | 98 | |||
| Dublin | 12,354 | 28 | 146 | 0 | 88,814 | 1,363 | 22,935 | 111,749 | |||
| Rosslare | 774 | 0 | 9 | 0 | 4,053 | 70 | 55 | 4,108 | |||
| Total | 13,128 | 28 | 258 | 0 | 92,950 | 1,436 | 23,005 | 115,955 | |||
| Total | |||||||||||
| Cork | 0 | 0 | 4,908 | 6 | 192 | 6 | 23 | 215 | |||
| Dublin | 23,261 | 45 | 10,312 | 10 | 197,438 | 3,002 | 27,360 | 224,798 | |||
| Rosslare | 1,720 | 1 | 211 | 0 | 9,091 | 127 | 161 | 9,252 | |||
| Total | 24,981 | 46 | 15,431 | 16 | 206,721 | 3,135 | 27,544 | 234,265 | |||
| 1 Vehicles imported or exported | |||||||||||
| 2 Includes data on (a) road goods vehicles and accompanying trailers (b) unaccompanied road goods trailers and semi trailers and | |||||||||||
| (c ) unaccompanied caravans and other road, agricultural and industrial trailers | |||||||||||
| Table 4: Details of lift-on/lift-off traffic handled by port, Quarter 2 2020 | |||||||||
| Port | Loaded units | Empty units | Total units | ||||||
| Number | TEU's1 | Tonnes '000 | Number | TEU's1 | Number | TEU's1 | |||
| Received | |||||||||
| Cork | 12,376 | 21,482 | 239 | 5,272 | 10,291 | 17,648 | 31,772 | ||
| Dublin | 42,310 | 75,063 | 7412 | 5,980 | 11,356 | 48,290 | 86,419 | ||
| Waterford | 1,823 | 3,415 | 41 | 1,247 | 2,766 | 3,070 | 6,181 | ||
| Total | 56,509 | 99,959 | 1,021 | 12,499 | 24,413 | 69,008 | 124,371 | ||
| Forwarded | |||||||||
| Cork | 14,280 | 27,136 | 276 | 4,105 | 5,863 | 18,385 | 32,998 | ||
| Dublin | 29,477 | 54,987 | 6042 | 18,221 | 31,319 | 47,698 | 86,305 | ||
| Waterford | 2,295 | 5,050 | 45 | 685 | 1,094 | 2,980 | 6,144 | ||
| Total | 46,052 | 87,172 | 925 | 23,011 | 38,275 | 69,063 | 125,447 | ||
| Total | |||||||||
| Cork | 26,656 | 48,617 | 515 | 9,377 | 16,153 | 36,033 | 64,770 | ||
| Dublin | 71,787 | 130,049 | 1,3452 | 24,201 | 42,675 | 95,988 | 172,724 | ||
| Waterford | 4,118 | 8,465 | 86 | 1,932 | 3,860 | 6,050 | 12,325 | ||
| Total | 102,561 | 187,131 | 1,946 | 35,510 | 62,688 | 138,071 | 249,819 | ||
| 1 TEU Twenty-foot equivalent unit = 1360 cubic feet | |||||||||
| 2 Data is provisional | |||||||||
| Table 5: Total tonnage of goods handled classified by port and region of trade, Quarter 2 2020 | ||||||
| ‘000 | ||||||
| Region of trade | ||||||
| Port | Great Britain & Northern Ireland | Other EU | Non-EU1 | Other ports2 | Coastal trade | Total |
| Bantry Bay | - | 132 | - | 345 | - | 477 |
| Cork | 120 | 908 | 169 | 761 | 118 | 2,076 |
| Drogheda | 102 | 176 | 7 | 5 | 1 | 291 |
| Dublin3 | 3,529 | 1,697 | 57 | 16 | 166 | 5,465 |
| Rosslare | 100 | 28 | - | - | - | 128 |
| Shannon Foynes | 248 | 941 | 84 | 761 | 121 | 2,155 |
| Waterford | 22 | 291 | 79 | 59 | - | 451 |
| Total | 4,121 | 4,174 | 395 | 1,947 | 406 | 11,043 |
| 1 Trade with ports in European countries that are not members of the E.U. | ||||||
| 2 Trade with ports in Non-European countries | ||||||
| 3 Data is provisional | ||||||
| Table 6: Passengers1 disembarking/embarking classified by port and route, Quarter 2 2020 | ||||||||||
| ‘000 | ||||||||||
| Port | Country | Total | ||||||||
| Great Britain | France | Other2 | ||||||||
| Fishguard | Holyhead | Liverpool | Pembroke | Cherbourg | Roscoff | Santander | ||||
| Disembarking | ||||||||||
| Cork | - | - | - | - | - | - | - | - | - | |
| Dublin | - | 39 | 0 | - | 1 | - | - | 0 | 40 | |
| Rosslare | 1 | - | - | - | 0 | - | - | - | 2 | |
| Total | 1 | 39 | 0 | - | 1 | - | - | 0 | 42 | |
| Embarking | ||||||||||
| Cork | - | - | - | - | - | - | - | - | - | |
| Dublin | - | 44 | 0 | - | 1 | - | - | - | 45 | |
| Rosslare | 1 | - | - | - | 1 | - | - | 0 | 2 | |
| Total | 1 | 44 | 0 | - | 2 | - | - | 0 | 47 | |
| All Passengers | ||||||||||
| Cork | - | - | - | - | - | - | - | - | - | |
| Dublin | - | 83 | 1 | - | 2 | - | - | - | 85 | |
| Rosslare | 2 | - | - | - | 1 | - | - | 0 | 3 | |
| Total | 2 | 83 | 1 | - | 3 | - | - | 0 | 88 | |
| 1 Excluding cruise passengers on excursion | ||||||||||
| 2 Including other British and French ports | ||||||||||
This release contains the results of a quarterly analysis of activity at the main Irish ports. The data is compiled from returns made by Scheduled Harbour Authorities, State Companies and a number of other harbours.
Data is received on a quarterly basis from the following ports, Bantry, Cork, Drogheda, Dublin, Rosslare, Shannon and Waterford.
Annual data is supplied by the smaller ports as follows, Arklow, Castletownbere, Dundalk, Dun Laoghaire, Galway, Greenore, Killybegs, Kilrush, Kinsale, New Ross, Sligo, Tralee, Wicklow and Youghal.
This is a full breakdown of all ports.
Scheduled harbour authorities
Arklow harbour commissioners
Bantry Bay harbour commissioners
Kilrush town council
Kinsale harbour commissioners
Sligo harbour commissioners
Tralee and Fenit pier and harbour commissioners
Youghal town council
State Companies
Drogheda port company
Dublin port company
Dundalk port company
Dun Laoghaire harbour company
Galway harbour company
New Ross port company
Port of Cork company
Port of Waterford company
Shannon Foynes port company
Wicklow port company
Other harbours
Castletownbere fishery harbour centre
Greenore port
Killybegs fishery harbour centre
Rosslare Europort
As the figures have been rounded independently there may be slight discrepancies between the sum of the constituent items and the totals shown. A ‘0’ indicates a value that has been rounded to zero, whereas a ‘-’ indicates no activity.
Definitions
Category of Goods:
Liquid bulk - A type of bulk cargo that consists of liquid items, such as petroleum, water, or liquid natural gas.
Dry bulk - Any material, other than a liquid or gas, that is transported in a loose form without any packaging.
Lift-on lift-off - Containerised cargo typically lifted on and off vessels by specially designed cranes and derricks (usually abbreviated as LoLo).
Roll-on roll-off - Wheeled cargo units either driven or pulled aboard vessels via vessel ramps (usually abbreviated as RoRo).
Break bulk & other goods – General cargo that must be loaded individually onto vessels, and not in intermodal containers or in bulk as with oil or grain.
Tonnage of Goods:
This includes the weight of immediate packaging material but excludes, in the case of containerised traffic, the weight of containers. The tonnage of goods for roll-on/roll-off traffic may be based on estimated coefficients for certain vehicle categories. The export of live cattle on the hoof is excluded from the tonnage of goods in this release.
Region of Trade:
Coastal - Trade between Irish ports excluding Northern Ireland.
Great Britain & Northern Ireland - Includes Isle of Man and other British crown dependencies.
Other EU - Trade with ports in European countries that are members of the E.U. excluding Ireland and Great Britain. Outermost regions of Member States (e.g. the Canary Islands) are included.
Non EU - Trade with ports in European countries that are not members of the E.U.
Other Ports - Trade with ports in Non European countries.
Gross Tonnage of Vessels:
The measure of the overall size of a ship determined in accordance with the provisions of the International Convention on Tonnage Measurement of Ships, 1969.
Vessel types:
Only the activity of trading vessels, car ferries and other passenger vessels is covered in the series. Only vessels of at least 100 gross tonnes are included. The following vessels are excluded:
– Fish-catching vessels
– Fish-processing vessels
– Vessels for drilling and exploration (exception: Killybegs)
– Tugs
– Pusher craft
– Research and survey vessels
– Dredgers
– Naval vessels
– Vessels used solely for non-commercial purposes
– Vessels entering the ports for shelter
Vessel types are classified according to the International Classification of Ship Types (ICST-COM). Cruise liners are included where passengers embark or disembark in port.
The ship categories included under each vessel type are outlined below:
Liquid bulk vessels:
Oil tanker
Chemical tanker
Liquid gas tanker
Tanker barge
Other tanker
Dry bulk vessels:
Bulk/oil carrier
Bulk carrier
Container vessels:
Full container
Specialised vessels:
Barge carrier
Chemical carrier
Irradiated fuel carrier
Livestock carrier
Vehicle carrier
Other specialised carrier
General cargo vessels:
Reefer
Ro-ro passenger
Ro-ro container
Other ro-ro container
Combination carrier general cargo/passenger
Combination carrier general cargo/container
Single decker
Multi-decker
Passenger vessels:
Cruise liners
Other passenger only vessels
 Hide Background Notes
Scan the QR code below to view this release online or go to
http://www.cso.ie/en/releasesandpublications/er/spt/statisticsofporttrafficquarter22020/
 Show Table 1: Number of arrivals and gross tonnage of vessels, Quarter 2 2018-2020
 Hide Table 1: Number of arrivals and gross tonnage of vessels, Quarter 2 2018-2020