
| Category of goods | 2012 | 2013 | change |
| '000 tonnes | |||
| Liquid bulk | 13,417 | 11,541 | -14.0% |
| Dry bulk | 15,042 | 15,948 | 6.0% |
| Lift-on/lift-off | 6,716 | 6,204 | -7.6% |
| Roll-on/roll-off | 11,605 | 12,145 | 4.7% |
| Break bulk & other goods | 870 | 883 | 1.5% |
| Total | 47,649 | 46,722 | -1.9% |
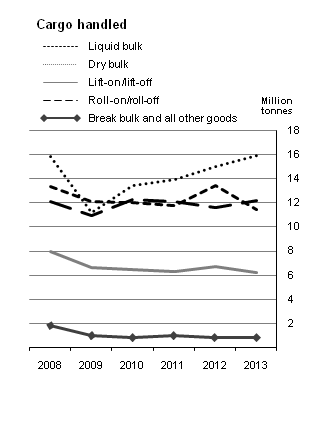
Irish ports handled 46.7 million tonnes of goods in 2013, a fall of 927,000 tonnes (-1.9%) compared to 2012. Goods forwarded accounted for this decrease, falling by 6.9% to 15.3 million tonnes in 2013. Goods received increased marginally to 31.4 million tonnes over the same period. See Table 5.
Liquid bulk and lift-on/lift-off traffic fell by 14.0% and 7.6% respectively in 2013 while dry bulk traffic recorded the largest increase at 6.0%. See Table 5 and graph.
The annual analysis also shows that:
| Table 1 Number of arrivals and gross tonnage of vessels, 2008 - 2013 | |||||||||||||||||
| Port | 2008 | 2009 | 2010 | 2011 | 2012 | 2013 | |||||||||||
| Number | Gross | Number | Gross | Number | Gross | Number | Gross | Number | Gross | Number | Gross | ||||||
| tonnage | tonnage | tonnage | tonnage | tonnage | tonnage | ||||||||||||
| '000 | '000 | '000 | '000 | '000 | '000 | ||||||||||||
| Arklow Port | - | - | - | - | - | - | - | - | - | - | 9 | 13 | |||||
| Bantry Bay | 62 | 899 | 32 | 803 | 48 | 1,015 | 30 | 1,122 | 37 | 2,264 | 11 | 650 | |||||
| Castletownbere | 14 | 32 | 7 | 12 | 13 | 21 | 17 | 26 | 17 | 27 | 15 | 25 | |||||
| Cork1 | 1,667 | 16,799 | 1,322 | 15,302 | 1,448 | 18,445 | 1,274 | 16,728 | 1,252 | 15,540 | 1,280 | 16,766 | |||||
| Drogheda | 332 | 859 | 233 | 601 | 209 | 510 | 184 | 447 | 274 | 717 | 314 | 808 | |||||
| Dublin | 7,460 | 133,483 | 7,247 | 140,105 | 7,434 | 148,652 | 6,767 | 137,448 | 6,624 | 140,394 | 6,651 | 142,372 | |||||
| Dundalk | 109 | 196 | 107 | 196 | 64 | 124 | 51 | 99 | 31 | 67 | 34 | 71 | |||||
| Dun Laoghaire | 578 | 11,351 | 317 | 6,225 | 389 | 3,618 | 182 | 3,465 | 172 | 3,378 | 208 | 4,085 | |||||
| Galway | 252 | 832 | 208 | 669 | 187 | 630 | 158 | 549 | 142 | 461 | 144 | 459 | |||||
| Greenore | 185 | 755 | 106 | 451 | 126 | 519 | 86 | 408 | 103 | 343 | 93 | 423 | |||||
| Killybegs2 | 278 | 1,023 | 126 | 685 | 104 | 366 | 90 | 326 | 58 | 379 | 64 | 421 | |||||
| Kilrush | - | - | - | - | - | - | - | - | 1 | 2 | 1 | 2 | |||||
| Kinsale | 48 | 106 | 51 | 111 | 53 | 120 | 37 | 89 | 41 | 94 | 4 | 8 | |||||
| New Ross | 236 | 593 | 193 | 470 | 174 | 349 | 131 | 159 | 102 | 118 | 122 | 302 | |||||
| Rosslare | 2,017 | 47,013 | 1,990 | 46,469 | 1,778 | 46,560 | 1,791 | 51,260 | 1,712 | 51,104 | 1,683 | 33,116 | |||||
| Shannon Foynes Port | 565 | 11,063 | 589 | 5,560 | 694 | 6,949 | 680 | 9,130 | 734 | 8,018 | 706 | 7,922 | |||||
| Sligo | 22 | 43 | 25 | 51 | 23 | 50 | 20 | 42 | 14 | 30 | 16 | 32 | |||||
| Tralee Fenit | 20 | 109 | 13 | 110 | 9 | 81 | 15 | 148 | 19 | 169 | 17 | 162 | |||||
| Waterford | 757 | 3,694 | 573 | 3,224 | 455 | 2,108 | 426 | 2,174 | 370 | 1,728 | 425 | 1,947 | |||||
| Wicklow | 66 | 138 | 58 | 121 | 53 | 117 | 56 | 133 | 42 | 98 | 70 | 174 | |||||
| Youghal | 61 | 42 | 26 | 18 | 50 | 41 | 64 | 41 | 65 | 52 | 73 | 62 | |||||
| Total | 14,729 | 229,031 | 13,223 | 221,183 | 13,311 | 230,276 | 12,059 | 223,795 | 11,810 | 224,983 | 11,940 | 209,821 | |||||
| 1 Includes offshore support vessels from 2008-2009 | |||||||||||||||||
| 2 Includes offshore support vessels from 2008-2011 | |||||||||||||||||
| Table 2 Number of arrivals and gross tonnage of vessels classified by quarter, 2013 | ||||||||||||||
| Port | Quarter 1 | Quarter 2 | Quarter 3 | Quarter 4 | Total | |||||||||
| Number | Gross | Number | Gross | Number | Gross | Number | Gross | Number | Gross | |||||
| tonnage | tonnage | tonnage | tonnage | tonnage | ||||||||||
| '000 | '000 | '000 | '000 | '000 | ||||||||||
| Arklow Port | 9 | 13 | - | - | - | - | - | - | 9 | 13 | ||||
| Bantry Bay | 4 | 178 | 5 | 309 | 1 | 81 | 1 | 81 | 11 | 650 | ||||
| Castletownbere | 5 | 8 | 4 | 6 | 2 | 3 | 4 | 8 | 15 | 25 | ||||
| Cork | 282 | 3,093 | 362 | 4,931 | 346 | 5,627 | 290 | 3,115 | 1,280 | 16,766 | ||||
| Drogheda | 77 | 207 | 73 | 180 | 70 | 180 | 94 | 241 | 314 | 808 | ||||
| Dublin | 1,530 | 32,998 | 1,729 | 34,998 | 1,760 | 38,459 | 1,632 | 35,917 | 6,651 | 142,372 | ||||
| Dundalk | 11 | 23 | 8 | 16 | 6 | 14 | 9 | 18 | 34 | 71 | ||||
| Dun Laoghaire | 42 | 825 | 88 | 1,728 | 72 | 1,414 | 6 | 118 | 208 | 4,085 | ||||
| Galway | 34 | 107 | 34 | 109 | 35 | 112 | 41 | 131 | 144 | 459 | ||||
| Greenore | 21 | 144 | 29 | 103 | 15 | 60 | 28 | 116 | 93 | 423 | ||||
| Killybegs | 12 | 62 | 15 | 134 | 33 | 212 | 4 | 13 | 64 | 421 | ||||
| Kilrush | 1 | 2 | - | - | - | - | - | - | 1 | 2 | ||||
| Kinsale | 3 | 7 | 1 | 0 | - | - | - | - | 4 | 8 | ||||
| New Ross | 39 | 96 | 34 | 80 | 23 | 59 | 26 | 68 | 122 | 302 | ||||
| Rosslare | 396 | 7,599 | 437 | 8,709 | 449 | 8,984 | 401 | 7,824 | 1,683 | 33,116 | ||||
| Shannon Foynes Port | 186 | 2,127 | 181 | 1,866 | 178 | 2,041 | 161 | 1,888 | 706 | 7,922 | ||||
| Sligo | 3 | 6 | 1 | 3 | 5 | 9 | 7 | 14 | 16 | 32 | ||||
| Tralee Fenit | 3 | 23 | 4 | 55 | 5 | 41 | 5 | 43 | 17 | 162 | ||||
| Waterford | 121 | 503 | 118 | 542 | 93 | 459 | 93 | 443 | 425 | 1,947 | ||||
| Wicklow | 16 | 38 | 21 | 52 | 14 | 36 | 19 | 48 | 70 | 174 | ||||
| Youghal | 20 | 17 | 16 | 15 | 19 | 15 | 18 | 15 | 73 | 62 | ||||
| Total | 2,815 | 48,077 | 3,160 | 53,837 | 3,126 | 57,808 | 2,839 | 50,100 | 11,940 | 209,821 | ||||
| Table 3 Number of arrivals and gross tonnage of vessels classified by type of vessel, 2013 | ||||||||||||||||||||
| Port | Vessel type | Total | ||||||||||||||||||
| Liquid bulk | Dry bulk | Container | Specialised | General | Passenger | |||||||||||||||
| Number | Gross | Number | Gross | Number | Gross | Number | Gross | Number | Gross | Number | Gross | Number | Gross | |||||||
| tonnage | tonnage | tonnage | tonnage | tonnage | tonnage | tonnage | ||||||||||||||
| '000 | '000 | '000 | '000 | '000 | '000 | '000 | ||||||||||||||
| Arklow Port | 9 | 13 | - | - | - | - | - | - | - | - | - | - | 9 | 13 | ||||||
| Bantry Bay | 11 | 650 | - | - | - | - | - | - | - | - | - | - | 11 | 650 | ||||||
| Castletownbere | - | - | 15 | 25 | - | - | - | - | - | - | - | - | 15 | 25 | ||||||
| Cork | 329 | 4,111 | 352 | 2,102 | 296 | 3,180 | 41 | 1,984 | 168 | 484 | 94 | 4,906 | 1,280 | 16,766 | ||||||
| Drogheda | 22 | 55 | 34 | 62 | - | - | - | - | 258 | 691 | - | - | 314 | 808 | ||||||
| Dublin | 424 | 3,085 | 90 | 1,044 | 865 | 6,204 | 44 | 1,233 | 5,119 | 126,656 | 109 | 4,150 | 6,651 | 142,372 | ||||||
| Dundalk | - | - | - | - | - | - | - | - | 34 | 71 | - | - | 34 | 71 | ||||||
| Dun Laoghaire | - | - | - | - | - | - | - | - | 208 | 4,085 | - | - | 208 | 4,085 | ||||||
| Galway | 108 | 368 | 36 | 91 | - | - | - | - | - | - | - | - | 144 | 459 | ||||||
| Greenore | - | - | 57 | 339 | - | - | - | - | 36 | 85 | - | - | 93 | 423 | ||||||
| Killybegs | 1 | 4 | - | - | - | - | 2 | 7 | 55 | 266 | 6 | 144 | 64 | 421 | ||||||
| Kilrush | 1 | 2 | - | - | - | - | - | - | - | - | - | - | 1 | 2 | ||||||
| Kinsale | - | - | 4 | 8 | - | - | - | - | - | - | - | - | 4 | 8 | ||||||
| New Ross | 3 | 11 | - | - | - | - | - | - | 119 | 291 | - | - | 122 | 302 | ||||||
| Rosslare | - | - | - | - | - | - | - | - | 1,683 | 33,116 | - | - | 1,683 | 33,116 | ||||||
| Shannon Foynes Port | 119 | 1,020 | 167 | 4,810 | - | - | 5 | 7 | 411 | 1,999 | 4 | 86 | 706 | 7,922 | ||||||
| Sligo | - | - | 16 | 32 | - | - | - | - | - | - | - | - | 16 | 32 | ||||||
| Tralee Fenit | - | - | - | - | - | - | - | - | 17 | 162 | - | - | 17 | 162 | ||||||
| Waterford | - | - | 2 | 8 | 101 | 793 | 7 | 47 | 303 | 948 | 12 | 151 | 425 | 1,947 | ||||||
| Wicklow | - | - | - | - | - | - | - | - | 70 | 174 | - | - | 70 | 174 | ||||||
| Youghal | - | - | - | - | - | - | - | - | 73 | 62 | - | - | 73 | 62 | ||||||
| Total | 1,027 | 9,318 | 773 | 8,519 | 1,262 | 10,176 | 99 | 3,279 | 8,554 | 169,090 | 225 | 9,438 | 11,940 | 209,821 | ||||||
| Table 4 Number of arrivals and gross tonnage of vessels classified by vessel size class, 2013 | ||||||||||||||||||||
| Port | Vessel size class (tonnes) | Total | ||||||||||||||||||
| 100-4,999 | 5,000-7,999 | 8,000-19,999 | 20,000-39,999 | 40,000-79,999 | >=80,000 | |||||||||||||||
| Number | Gross | Number | Gross | Number | Gross | Number | Gross | Number | Gross | Number | Gross | Number | Gross | |||||||
| tonnage | tonnage | tonnage | tonnage | tonnage | tonnage | tonnage | ||||||||||||||
| '000 | '000 | '000 | '000 | '000 | '000 | '000 | ||||||||||||||
| Arklow Port | 4 | 6 | 5 | 7 | - | - | - | - | - | - | - | - | 9 | 13 | ||||||
| Bantry Bay | - | - | - | - | - | - | 1 | 29 | 8 | 459 | 2 | 162 | 11 | 650 | ||||||
| Castletownbere | 15 | 25 | - | - | - | - | - | - | - | - | - | - | 15 | 25 | ||||||
| Cork | 699 | 2,095 | 125 | 891 | 190 | 1,920 | 127 | 3,483 | 120 | 6,294 | 19 | 2,083 | 1,280 | 16,766 | ||||||
| Drogheda | 314 | 808 | - | - | - | - | - | - | - | - | - | - | 314 | 808 | ||||||
| Dublin | 785 | 2,550 | 1,338 | 9,073 | 1,844 | 27,813 | 1,177 | 29,772 | 1,488 | 71,294 | 19 | 1,869 | 6,651 | 142,372 | ||||||
| Dundalk | 34 | 71 | - | - | - | - | - | - | - | - | - | - | 34 | 71 | ||||||
| Dun Laoghaire | - | - | - | - | 208 | 4,085 | - | - | - | - | - | - | 208 | 4,085 | ||||||
| Galway | 144 | 459 | - | - | - | - | - | - | - | - | - | - | 144 | 459 | ||||||
| Greenore | 78 | 201 | 6 | 38 | 3 | 53 | 6 | 133 | - | - | - | - | 93 | 423 | ||||||
| Killybegs | 40 | 111 | 6 | 37 | 12 | 126 | 5 | 110 | 1 | 37 | - | - | 64 | 421 | ||||||
| Kilrush | 1 | 2 | - | - | - | - | - | - | - | - | - | - | 1 | 2 | ||||||
| Kinsale | 4 | 8 | - | - | - | - | - | - | - | - | - | - | 4 | 8 | ||||||
| New Ross | 122 | 302 | - | - | - | - | - | - | - | - | - | - | 122 | 302 | ||||||
| Rosslare | - | - | - | - | 713 | 7,812 | 970 | 25,304 | - | - | - | - | 1,683 | 33,116 | ||||||
| Shannon Foynes Port | 342 | 1,072 | 118 | 732 | 139 | 1,495 | 52 | 1,762 | 46 | 2,038 | 9 | 824 | 706 | 7,922 | ||||||
| Sligo | 16 | 32 | - | - | - | - | - | - | - | - | - | - | 16 | 32 | ||||||
| Tralee Fenit | 3 | 11 | 5 | 34 | 9 | 117 | - | - | - | - | - | - | 17 | 162 | ||||||
| Waterford | 293 | 823 | 119 | 912 | 10 | 124 | 3 | 89 | - | - | - | - | 425 | 1,947 | ||||||
| Wicklow | 70 | 174 | - | - | - | - | - | - | - | - | - | - | 70 | 174 | ||||||
| Youghal | 73 | 62 | - | - | - | - | - | - | - | - | - | - | 73 | 62 | ||||||
| Total | 3,037 | 8,812 | 1,722 | 11,724 | 3,128 | 43,545 | 2,341 | 60,681 | 1,663 | 80,122 | 49 | 4,938 | 11,940 | 209,821 | ||||||
| Table 5 Tonnage of goods handled classified by category of traffic, 2005 - 2013 | |||||||||
| ‘000 | |||||||||
| Category of traffic | 2005 | 2006 | 2007 | 2008 | 2009 | 2010 | 2011 | 2012 | 2013 |
| Goods received | |||||||||
| Liquid bulk | 11,977 | 11,692 | 11,517 | 10,937 | 9,906 | 9,551 | 9,212 | 9,794 | 9,043 |
| Dry bulk | 11,911 | 12,465 | 12,367 | 11,990 | 8,789 | 10,364 | 10,354 | 11,246 | 12,012 |
| Lift-on/lift-off traffic | 4,770 | 5,379 | 5,716 | 4,912 | 3,767 | 3,656 | 3,318 | 3,491 | 3,305 |
| Roll-on/roll-off traffic | 7,260 | 7,079 | 7,369 | 7,015 | 6,052 | 6,728 | 6,527 | 6,234 | 6,522 |
| Break bulk and all other goods | 1,736 | 1,940 | 1,938 | 1,196 | 484 | 413 | 427 | 427 | 521 |
| Total | 37,654 | 38,555 | 38,907 | 36,049 | 28,998 | 30,712 | 29,838 | 31,191 | 31,403 |
| Goods forwarded | |||||||||
| Liquid bulk | 2,781 | 2,609 | 2,831 | 2,379 | 2,195 | 2,468 | 2,592 | 3,623 | 2,499 |
| Dry bulk | 3,679 | 3,750 | 3,455 | 3,915 | 2,396 | 3,071 | 3,578 | 3,796 | 3,936 |
| Lift-on/lift-off traffic | 3,032 | 3,093 | 3,160 | 3,033 | 2,892 | 2,800 | 2,993 | 3,225 | 2,900 |
| Roll-on/roll-off traffic | 4,557 | 4,836 | 5,178 | 5,065 | 4,876 | 5,529 | 5,540 | 5,371 | 5,623 |
| Break bulk and all other goods | 443 | 475 | 609 | 640 | 480 | 491 | 538 | 443 | 361 |
| Total | 14,492 | 14,763 | 15,232 | 15,031 | 12,839 | 14,359 | 15,240 | 16,458 | 15,319 |
| Total goods handled | |||||||||
| Liquid bulk | 14,759 | 14,301 | 14,348 | 13,315 | 12,100 | 12,019 | 11,804 | 13,417 | 11,541 |
| Dry bulk | 15,589 | 16,215 | 15,822 | 15,905 | 11,185 | 13,435 | 13,932 | 15,042 | 15,948 |
| Lift-on/lift-off traffic | 7,803 | 8,472 | 8,876 | 7,945 | 6,659 | 6,457 | 6,311 | 6,716 | 6,204 |
| Roll-on/roll-off traffic | 11,816 | 11,915 | 12,547 | 12,080 | 10,928 | 12,256 | 12,066 | 11,605 | 12,145 |
| Break bulk and all other goods | 2,179 | 2,415 | 2,548 | 1,836 | 964 | 904 | 965 | 870 | 883 |
| Total | 52,146 | 53,318 | 54,139 | 51,081 | 41,836 | 45,071 | 45,078 | 47,649 | 46,722 |
| Table 6A Tonnage of goods received classified by category of traffic and quarter, 2013 | |||||
| ‘000 | |||||
| Category of traffic | Quarter 1 | Quarter 2 | Quarter 3 | Quarter 4 | Total |
| Liquid bulk | |||||
| Liquefied gas | 180 | 123 | 14 | 24 | 341 |
| Crude oil | 722 | 1,059 | 894 | 760 | 3,435 |
| Oil products | 1,121 | 1,141 | 1,108 | 1,215 | 4,586 |
| Other liquid bulk goods | 183 | 163 | 209 | 127 | 681 |
| Total | 2,206 | 2,486 | 2,225 | 2,125 | 9,043 |
| Dry bulk | |||||
| Ores | 1,067 | 1,094 | 1,193 | 977 | 4,332 |
| Coal | 728 | 553 | 463 | 533 | 2,277 |
| Agricultural products | 1,034 | 1,028 | 658 | 1,054 | 3,773 |
| Other dry bulk goods | 463 | 423 | 368 | 377 | 1,630 |
| Total | 3,292 | 3,098 | 2,681 | 2,941 | 12,012 |
| Lift-on/lift-off traffic | |||||
| 20 ft containers | 164 | 178 | 181 | 158 | 681 |
| 40 ft containers | 548 | 578 | 577 | 554 | 2,257 |
| Other containers | 88 | 97 | 93 | 89 | 367 |
| Total | 801 | 853 | 851 | 801 | 3,305 |
| Roll-on/roll-off traffic | |||||
| Road goods vehicles | 621 | 684 | 698 | 673 | 2,676 |
| Trade vehicles | 37 | 24 | 13 | 29 | 103 |
| Unaccompanied trailers | 867 | 938 | 960 | 978 | 3,743 |
| Total | 1,526 | 1,646 | 1,671 | 1,680 | 6,522 |
| Break Bulk and other goods | |||||
| Forestry products | 46 | 65 | 63 | 55 | 228 |
| Iron and steel products | 39 | 49 | 38 | 58 | 184 |
| Other general cargo | 25 | 26 | 28 | 30 | 109 |
| Total | 110 | 140 | 128 | 143 | 521 |
| Total | 7,935 | 8,223 | 7,556 | 7,689 | 31,403 |
| Table 6B Tonnage of goods forwarded classified by category of traffic and quarter, 2013 | |||||
| ‘000 | |||||
| Category of traffic | Quarter 1 | Quarter 2 | Quarter 3 | Quarter 4 | Total |
| Liquid bulk | |||||
| Liquefied gas | 1 | 125 | 14 | 4 | 143 |
| Crude oil | 3 | 204 | 225 | 87 | 519 |
| Oil products | 467 | 458 | 426 | 485 | 1,836 |
| Other liquid bulk goods | 0 | 0 | - | 0 | 0 |
| Total | 471 | 787 | 665 | 576 | 2,499 |
| Dry bulk | |||||
| Ores | 195 | 170 | 176 | 188 | 728 |
| Agricultural products | 5 | 16 | 9 | 18 | 48 |
| Other dry bulk goods | 752 | 785 | 838 | 786 | 3,160 |
| Total | 952 | 971 | 1,022 | 991 | 3,936 |
| Lift-on/lift-off traffic | |||||
| 20 ft containers | 83 | 88 | 81 | 73 | 325 |
| 40 ft containers | 527 | 546 | 554 | 560 | 2,187 |
| Other containers | 89 | 105 | 98 | 96 | 388 |
| Total | 698 | 739 | 733 | 730 | 2,900 |
| Roll-on/roll-off traffic | |||||
| Road goods vehicles | 616 | 669 | 676 | 659 | 2,622 |
| Trade vehicles | 1 | 2 | 2 | 1 | 6 |
| Unaccompanied trailers | 699 | 775 | 760 | 762 | 2,995 |
| Total | 1,316 | 1,446 | 1,438 | 1,423 | 5,623 |
| Break bulk and other goods | |||||
| Forestry products | 17 | 14 | 23 | 16 | 70 |
| Iron and steel products | 37 | 39 | 40 | 40 | 155 |
| Other general cargo | 56 | 31 | 27 | 21 | 136 |
| Total | 111 | 84 | 90 | 77 | 361 |
| Total | 3,548 | 4,026 | 3,948 | 3,797 | 15,319 |
| Table 6C Total tonnage of goods handled classified by category of traffic and quarter, 2013 | |||||
| ‘000 | |||||
| Category of traffic | Quarter 1 | Quarter 2 | Quarter 3 | Quarter 4 | Total |
| Liquid bulk | |||||
| Liquefied gas | 181 | 248 | 28 | 28 | 484 |
| Crude oil | 726 | 1,262 | 1,120 | 847 | 3,954 |
| Oil products | 1,588 | 1,600 | 1,534 | 1,700 | 6,422 |
| Other liquid bulk goods | 183 | 163 | 209 | 127 | 681 |
| Total | 2,677 | 3,273 | 2,890 | 2,701 | 11,541 |
| Dry bulk | |||||
| Ores | 1,262 | 1,264 | 1,369 | 1,165 | 5,060 |
| Coal | 728 | 553 | 463 | 533 | 2,277 |
| Agricultural products | 1,039 | 1,044 | 667 | 1,072 | 3,821 |
| Other dry bulk goods | 1,215 | 1,208 | 1,205 | 1,163 | 4,790 |
| Total | 4,244 | 4,069 | 3,703 | 3,932 | 15,948 |
| Lift-on/Lift-off traffic | |||||
| 20 ft containers | 247 | 266 | 262 | 231 | 1,005 |
| 40 ft containers | 1,076 | 1,123 | 1,131 | 1,114 | 4,444 |
| Other containers | 176 | 202 | 191 | 185 | 755 |
| Total | 1,499 | 1,591 | 1,584 | 1,530 | 6,204 |
| Roll-on/roll-off traffic | |||||
| Road goods vehicles | 1,237 | 1,354 | 1,374 | 1,332 | 5,298 |
| Trade vehicles | 38 | 25 | 15 | 30 | 109 |
| Unaccompanied trailers | 1,567 | 1,712 | 1,720 | 1,740 | 6,739 |
| Total | 2,842 | 3,091 | 3,109 | 3,103 | 12,145 |
| Break bulk and other goods | |||||
| Forestry products | 63 | 79 | 86 | 70 | 298 |
| Iron and steel products | 76 | 88 | 77 | 98 | 339 |
| Other general cargo | 81 | 57 | 55 | 52 | 245 |
| Total | 221 | 224 | 218 | 220 | 883 |
| Total | 11,483 | 12,248 | 11,504 | 11,486 | 46,722 |
 Show Table 7A: Tonnage of goods received classified by category of traffic and region of trade, 2013
| Table 7A Tonnage of goods received classified by category of traffic and region of trade, 2013 | ||||||
| ‘000 | ||||||
| Category of traffic | Region of trade | Total | ||||
| Great Britain & | Other EU | Non-EU1 | Other ports2 | Coastal trade | ||
| Northern | ||||||
| Ireland | ||||||
| Liquid bulk | ||||||
| Liquefied gas | 283 | 50 | - | 5 | 3 | 341 |
| Crude oil | 235 | 734 | 1,362 | 823 | 281 | 3,435 |
| Oil products | 3,281 | 253 | 130 | 46 | 876 | 4,586 |
| Other liquid bulk goods | 109 | 325 | 56 | 174 | 18 | 681 |
| Total | 3,907 | 1,361 | 1,548 | 1,048 | 1,179 | 9,043 |
| Dry bulk | ||||||
| Ores | - | 1,209 | - | 3,123 | - | 4,332 |
| Coal | 30 | 382 | 219 | 1,643 | 2 | 2,277 |
| Agricultural products | 137 | 1,928 | 342 | 1,333 | 34 | 3,773 |
| Other dry bulk goods | 172 | 1,074 | 224 | 133 | 27 | 1,630 |
| Total | 338 | 4,593 | 785 | 6,232 | 63 | 12,012 |
| Lift-on/lift-off traffic | ||||||
| 20 ft containers | 29 | 635 | 3 | 3 | 11 | 681 |
| 40 ft containers | 164 | 2,006 | 7 | 72 | 8 | 2,257 |
| Other containers | 1 | 293 | - | - | 73 | 367 |
| Total | 195 | 2,934 | 10 | 75 | 91 | 3,305 |
| Roll-on/roll-off traffic | ||||||
| Road goods vehicles | 2,489 | 116 | 0 | 71 | - | 2,676 |
| Trade vehicles | 28 | 72 | 2 | 0 | - | 103 |
| Unaccompanied trailers | 2,923 | 786 | - | 35 | - | 3,743 |
| Total | 5,440 | 973 | 2 | 107 | - | 6,522 |
| Break bulk and other goods | ||||||
| Forestry products | 49 | 128 | 28 | 10 | 12 | 228 |
| Iron and steel products | 32 | 137 | 5 | 4 | 6 | 184 |
| Other general cargo | 2 | 68 | 35 | 4 | 0 | 109 |
| Total | 83 | 333 | 69 | 18 | 18 | 521 |
| Total | 9,963 | 10,195 | 2,414 | 7,479 | 1,352 | 31,403 |
| 1 Trade with ports in European countries that are not members of the E.U. | ||||||
| 2 Trade with ports in Non-European countries | ||||||
| Table 7B Tonnage of goods forwarded classified by category of traffic and region of trade, 2013 | ||||||
| ‘000 | ||||||
| Category of traffic | Region of trade | Total | ||||
| Great Britain & | Other EU | Non-EU1 | Other ports2 | Coastal trade | ||
| Northern | ||||||
| Ireland | ||||||
| Liquid bulk | ||||||
| Liquefied gas | 16 | 9 | - | 116 | 2 | 143 |
| Crude oil | 145 | 13 | - | 147 | 214 | 519 |
| Oil products | 816 | 26 | 49 | 55 | 890 | 1,836 |
| Other liquid bulk goods | - | - | - | - | 0 | 0 |
| Total | 976 | 49 | 49 | 318 | 1,106 | 2,499 |
| Dry bulk | ||||||
| Ores | 6 | 577 | 130 | 14 | - | 728 |
| Agricultural products | 30 | 14 | - | 5 | - | 48 |
| Other dry bulk goods | 820 | 1,848 | 120 | 172 | 200 | 3,160 |
| Total | 856 | 2,438 | 250 | 191 | 200 | 3,936 |
| Lift-on/lift-off traffic | ||||||
| 20 ft containers | 26 | 282 | 0 | 9 | 6 | 325 |
| 40 ft containers | 276 | 1,847 | 2 | 15 | 47 | 2,187 |
| Other containers | 0 | 334 | 0 | 0 | 54 | 388 |
| Total | 302 | 2,464 | 2 | 24 | 107 | 2,900 |
| Roll-on/roll-off traffic | ||||||
| Road goods vehicles | 2,402 | 155 | - | 65 | - | 2,622 |
| Trade vehicles | 1 | 1 | - | 4 | - | 6 |
| Unaccompanied trailers | 2,469 | 491 | 0 | 35 | - | 2,995 |
| Total | 4,872 | 647 | 0 | 104 | - | 5,623 |
| Break bulk and other goods | ||||||
| Forestry products | 6 | 32 | 22 | 2 | 9 | 70 |
| Iron and steel products | 35 | 78 | 3 | 18 | 21 | 155 |
| Other general cargo | 18 | 41 | 27 | 31 | 19 | 136 |
| Total | 58 | 152 | 52 | 51 | 49 | 361 |
| Total | 7,064 | 5,750 | 354 | 688 | 1,463 | 15,319 |
| 1 Trade with ports in European countries that are not members of the E.U. | ||||||
| 2 Trade with ports in Non-European countries | ||||||
| Table 7C Total tonnage of goods handled classified by category of traffic and region of trade, 2013 | ||||||
| ‘000 | ||||||
| Category of traffic | Region of trade | Total | ||||
| Great Britain & | Other EU | Non-EU1 | Other ports2 | Coastal trade | ||
| Northern | ||||||
| Ireland | ||||||
| Liquid bulk | ||||||
| Liquefied gas | 298 | 59 | - | 121 | 5 | 484 |
| Crude oil | 379 | 748 | 1,362 | 970 | 496 | 3,954 |
| Oil products | 4,097 | 279 | 179 | 101 | 1,766 | 6,422 |
| Other liquid bulk goods | 109 | 325 | 56 | 174 | 18 | 681 |
| Total | 4,883 | 1,410 | 1,597 | 1,365 | 2,285 | 11,541 |
| Dry bulk | ||||||
| Ores | 6 | 1,787 | 130 | 3,137 | - | 5,060 |
| Coal | 30 | 382 | 219 | 1,643 | 2 | 2,277 |
| Agricultural products | 166 | 1,941 | 342 | 1,338 | 34 | 3,821 |
| Other dry bulk goods | 992 | 2,922 | 344 | 305 | 227 | 4,790 |
| Total | 1,194 | 7,031 | 1,036 | 6,423 | 264 | 15,948 |
| Lift-on/lift-off traffic | ||||||
| 20 ft containers | 55 | 918 | 3 | 13 | 17 | 1,005 |
| 40 ft containers | 440 | 3,853 | 9 | 86 | 55 | 4,444 |
| Other containers | 2 | 627 | 0 | 0 | 126 | 755 |
| Total | 497 | 5,398 | 13 | 99 | 198 | 6,204 |
| Roll-on/roll-off traffic | ||||||
| Road goods vehicles | 4,891 | 270 | 0 | 137 | - | 5,298 |
| Trade vehicles | 29 | 73 | 2 | 4 | - | 109 |
| Unaccompanied trailers | 5,392 | 1,277 | 0 | 70 | - | 6,739 |
| Total | 10,312 | 1,620 | 2 | 211 | - | 12,145 |
| Break bulk and other goods | ||||||
| Forestry products | 55 | 161 | 50 | 12 | 20 | 298 |
| Iron and steel products | 67 | 216 | 8 | 22 | 27 | 339 |
| Other general cargo | 20 | 109 | 62 | 35 | 19 | 245 |
| Total | 142 | 485 | 121 | 69 | 67 | 883 |
| Total | 17,028 | 15,944 | 2,769 | 8,167 | 2,814 | 46,722 |
| 1 Trade with ports in European countries that are not members of the E.U. | ||||||
| 2 Trade with ports in Non-European countries | ||||||
| Table 8 Details of roll-on/roll-off traffic handled by port, 2013 | ||||||||||
| Port | Passenger cars, | Passenger | Trade vehicles1 | Freight vehicles/trailers2 | ||||||
| motorcycles and | ||||||||||
| accompanying | buses | |||||||||
| trailers/caravans | ||||||||||
| Number | Number | Number | Tonnes '000 | Loaded | Empty | |||||
| Number | Tonnes '000 | Number | ||||||||
| Received | ||||||||||
| Cork | 11,487 | 44 | 26,616 | 33 | 348 | 4 | 78 | |||
| Dublin | 218,675 | 4,517 | 58,285 | 58 | 387,501 | 5,605 | 17,953 | |||
| Dun Laoghaire | 22,168 | 236 | - | - | 1,239 | 2 | 89 | |||
| Rosslare | 129,610 | 1,743 | 9,401 | 11 | 54,570 | 809 | 1,494 | |||
| Total | 381,940 | 6,540 | 94,302 | 103 | 443,658 | 6,419 | 19,614 | |||
| Forwarded | ||||||||||
| Cork | 11,556 | 48 | 232 | 0 | 683 | 13 | 42 | |||
| Dublin | 200,257 | 4,864 | 5,484 | 6 | 372,891 | 4,483 | 82,992 | |||
| Dun Laoghaire | 29,871 | 423 | - | - | 1,190 | 1 | 423 | |||
| Rosslare | 128,616 | 1,810 | 86 | 0 | 64,359 | 1,120 | 825 | |||
| Total | 370,300 | 7,145 | 5,802 | 6 | 439,123 | 5,617 | 84,282 | |||
| Total | ||||||||||
| Cork | 23,043 | 92 | 26,848 | 34 | 1,031 | 17 | 120 | |||
| Dublin | 418,932 | 9,381 | 63,769 | 64 | 760,392 | 10,088 | 100,945 | |||
| Dun Laoghaire | 52,039 | 659 | - | - | 2,429 | 3 | 512 | |||
| Rosslare | 258,226 | 3,553 | 9,487 | 11 | 118,929 | 1,928 | 2,319 | |||
| Total | 752,240 | 13,685 | 100,104 | 109 | 882,781 | 12,036 | 103,896 | |||
| 1 Vehicles imported or exported | ||||||||||
| 2 Includes data on (a) road goods vehicles and accompanying trailers (b)( unaccompanied road goods trailers and semi trailers and | ||||||||||
| (c) unaccompanied caravans and other road, agricultural and industrial trailers | ||||||||||
| Table 9 Details of lift-on/lift-off traffic handled by port, 2013 | |||||||||
| Port | Loaded units | Empty units | Total units | ||||||
| Number | TEU's1 | Tonnes '000 | Number | TEU's1 | Number | TEU's1 | |||
| Received | |||||||||
| Cork | 41,085 | 69,655 | 890 | 7,405 | 14,773 | 48,490 | 84,428 | ||
| Dublin | 137,955 | 241,220 | 2,297 | 10,613 | 20,364 | 148,568 | 261,584 | ||
| Waterford | 5,581 | 10,882 | 118 | 3,841 | 8,580 | 9,422 | 19,462 | ||
| Total | 184,621 | 321,757 | 3,305 | 21,859 | 43,716 | 206,480 | 365,473 | ||
| Forwarded | |||||||||
| Cork | 39,212 | 72,312 | 853 | 10,536 | 13,669 | 49,748 | 85,981 | ||
| Dublin | 91,896 | 170,175 | 1,878 | 52,368 | 84,019 | 144,264 | 254,193 | ||
| Waterford | 8,348 | 18,234 | 168 | 1,568 | 2,139 | 9,916 | 20,372 | ||
| Total | 139,456 | 260,720 | 2,900 | 64,472 | 99,826 | 203,928 | 360,546 | ||
| Total | |||||||||
| Cork | 80,297 | 141,967 | 1,743 | 17,941 | 28,442 | 98,238 | 170,408 | ||
| Dublin | 229,851 | 411,394 | 4,175 | 62,981 | 104,383 | 292,832 | 515,777 | ||
| Waterford | 13,929 | 29,116 | 286 | 5,409 | 10,718 | 19,338 | 39,834 | ||
| Total | 324,077 | 582,476 | 6,204 | 86,331 | 143,542 | 410,408 | 726,019 | ||
| 1 TEU Twenty-foot equivalent unit = 1360 cubic feet | |||||||||
| Table 10A Tonnage of goods received and forwarded classified by port and quarter, 2013 | |||||
| ‘000 | |||||
| Port | Quarter 1 | Quarter 2 | Quarter 3 | Quarter 4 | Total |
| Goods received | |||||
| Arklow Port | - | 7 | 3 | 3 | 13 |
| Bantry Bay | 154 | 378 | 145 | 127 | 804 |
| Castletownbere | 10 | 8 | 4 | 11 | 33 |
| Cork | 1,420 | 1,566 | 1,395 | 1,340 | 5,721 |
| Drogheda | 139 | 108 | 51 | 110 | 408 |
| Dublin | 2,963 | 3,232 | 3,234 | 3,284 | 12,713 |
| Dundalk | 24 | 18 | 15 | 21 | 79 |
| Dun Laoghaire | 2 | 0 | 1 | 0 | 2 |
| Galway | 98 | 111 | 106 | 114 | 429 |
| Greenore | 104 | 102 | 61 | 117 | 383 |
| Killybegs | - | - | 0 | 3 | 3 |
| Kilrush | - | - | - | - | - |
| Kinsale | 9 | - | - | - | 9 |
| New Ross | 111 | 91 | 67 | 74 | 343 |
| Rosslare | 192 | 215 | 205 | 208 | 820 |
| Shannon Foynes Port | 2,339 | 2,051 | 2,017 | 1,949 | 8,356 |
| Sligo | 7 | 2 | 11 | 13 | 32 |
| Tralee Fenit | - | - | - | - | - |
| Waterford | 335 | 303 | 211 | 283 | 1,132 |
| Wicklow | 4 | 6 | 3 | 8 | 21 |
| Youghal | 25 | 27 | 26 | 25 | 103 |
| Total | 7,935 | 8,223 | 7,556 | 7,689 | 31,403 |
| Goods forwarded | |||||
| Arklow Port | - | - | - | - | - |
| Bantry Bay | - | 315 | 225 | 124 | 665 |
| Castletownbere | 0 | - | - | 0 | 0 |
| Cork | 807 | 816 | 820 | 819 | 3,262 |
| Drogheda | 127 | 136 | 171 | 201 | 636 |
| Dublin | 1,702 | 1,841 | 1,819 | 1,790 | 7,153 |
| Dundalk | 2 | 2 | 9 | 6 | 19 |
| Dun Laoghaire | 1 | 0 | 0 | 0 | 1 |
| Galway | 25 | 21 | 19 | 27 | 92 |
| Greenore | - | 0 | 0 | 0 | 0 |
| Killybegs | 40 | 17 | 7 | 1 | 65 |
| Kilrush | - | - | 2 | - | 2 |
| Kinsale | - | - | - | - | - |
| New Ross | - | - | - | - | - |
| Rosslare | 267 | 284 | 285 | 284 | 1,120 |
| Shannon Foynes Port | 492 | 488 | 503 | 451 | 1,934 |
| Sligo | 2 | - | - | - | 2 |
| Tralee Fenit | 3 | 8 | 8 | 7 | 26 |
| Waterford | 47 | 61 | 50 | 58 | 216 |
| Wicklow | 29 | 37 | 26 | 28 | 121 |
| Youghal | 4 | - | 1 | - | 5 |
| Total | 3,548 | 4,026 | 3,948 | 3,797 | 15,319 |
| Table 10B Total tonnage of goods handled classified by port and quarter, 2013 | |||||
| ‘000 | |||||
| Port | Quarter 1 | Quarter 2 | Quarter 3 | Quarter 4 | Total |
| Total goods handled | |||||
| Arklow Port | - | 7 | 3 | 3 | 13 |
| Bantry Bay | 154 | 693 | 371 | 251 | 1,469 |
| Castletownbere | 10 | 8 | 4 | 11 | 33 |
| Cork | 2,227 | 2,381 | 2,215 | 2,159 | 8,983 |
| Drogheda | 267 | 244 | 223 | 311 | 1,044 |
| Dublin | 4,665 | 5,073 | 5,053 | 5,074 | 19,865 |
| Dundalk | 25 | 20 | 24 | 27 | 97 |
| Dun Laoghaire | 2 | 1 | 1 | 0 | 4 |
| Galway | 123 | 132 | 125 | 141 | 521 |
| Greenore | 104 | 102 | 61 | 117 | 383 |
| Killybegs | 40 | 17 | 7 | 4 | 68 |
| Kilrush | - | - | 2 | - | 2 |
| Kinsale | 9 | - | - | - | 9 |
| New Ross | 111 | 91 | 67 | 74 | 343 |
| Rosslare | 459 | 498 | 490 | 492 | 1,940 |
| Shannon Foynes Port | 2,830 | 2,539 | 2,520 | 2,400 | 10,290 |
| Sligo | 9 | 2 | 11 | 13 | 34 |
| Tralee Fenit | 3 | 8 | 8 | 7 | 26 |
| Waterford | 382 | 364 | 261 | 341 | 1,348 |
| Wicklow | 34 | 43 | 29 | 36 | 142 |
| Youghal | 29 | 27 | 28 | 25 | 108 |
| Total | 11,483 | 12,248 | 11,504 | 11,486 | 46,722 |
Show Table 11A: Tonnage of goods received and forwarded classified by port and region of trade, 2013
| Table 11A Tonnage of goods received and forwarded classified by port and region of trade, 2013 | ||||||
| ‘000 | ||||||
| Port | Region of trade | Total | ||||
| Great Britain & | Other EU | Non-EU1 | Other ports2 | Coastal trade | ||
| Northern | ||||||
| Ireland | ||||||
| Goods received | ||||||
| Arklow Port | 13 | - | - | - | - | 13 |
| Bantry Bay | 217 | 343 | - | 244 | - | 804 |
| Castletownbere | - | - | 33 | - | - | 33 |
| Cork | 503 | 2,023 | 1,536 | 1,315 | 345 | 5,721 |
| Drogheda | 50 | 291 | 20 | 36 | 11 | 408 |
| Dublin | 7,655 | 3,693 | 209 | 706 | 450 | 12,713 |
| Dundalk | 3 | 69 | - | - | 7 | 79 |
| Dun Laoghaire | 2 | - | - | - | - | 2 |
| Galway | 5 | 35 | - | - | 389 | 429 |
| Greenore | 20 | 199 | 59 | 104 | - | 383 |
| Killybegs | 0 | - | - | - | 3 | 3 |
| Kilrush | - | - | - | - | - | - |
| Kinsale | - | 2 | 6 | - | - | 9 |
| New Ross | 19 | 249 | 47 | 11 | 16 | 343 |
| Rosslare | 623 | 197 | - | - | - | 820 |
| Shannon Foynes Port | 693 | 2,219 | 357 | 5,037 | 50 | 8,356 |
| Sligo | 32 | - | - | - | - | 32 |
| Tralee Fenit | - | - | - | - | - | - |
| Waterford | 119 | 787 | 119 | 25 | 81 | 1,132 |
| Wicklow | 2 | 18 | - | - | - | 21 |
| Youghal | 7 | 68 | 27 | - | - | 103 |
| Total | 9,963 | 10,195 | 2,414 | 7,479 | 1,352 | 31,403 |
| Goods forwarded | ||||||
| Arklow Port | - | - | - | - | - | - |
| Bantry Bay | 145 | - | - | 263 | 257 | 665 |
| Castletownbere | - | 0 | 0 | - | - | 0 |
| Cork | 919 | 1,316 | 93 | 81 | 853 | 3,262 |
| Drogheda | 255 | 378 | 1 | 3 | - | 636 |
| Dublin | 4,336 | 2,490 | 105 | 162 | 59 | 7,153 |
| Dundalk | - | 19 | - | - | - | 19 |
| Dun Laoghaire | 1 | - | - | - | - | 1 |
| Galway | 43 | 49 | - | - | - | 92 |
| Greenore | 0 | 0 | - | - | - | 0 |
| Killybegs | - | 13 | 27 | 24 | 1 | 65 |
| Kilrush | - | 2 | - | - | - | 2 |
| Kinsale | - | - | - | - | - | - |
| New Ross | - | - | - | - | - | - |
| Rosslare | 876 | 244 | - | - | - | 1,120 |
| Shannon Foynes Port | 435 | 1,023 | 119 | 135 | 221 | 1,934 |
| Sligo | - | 2 | - | - | - | 2 |
| Tralee Fenit | 7 | - | 3 | 16 | - | 26 |
| Waterford | 18 | 119 | 4 | 5 | 71 | 216 |
| Wicklow | 28 | 92 | - | - | - | 121 |
| Youghal | - | 2 | 3 | - | - | 5 |
| Total | 7,064 | 5,750 | 354 | 688 | 1,463 | 15,319 |
| 1 Trade with ports in European countries that are not members of the E.U. | ||||||
| 2 Trade with ports in Non-European countries | ||||||
| Table 11B Total tonnage of goods handled classified by port and region of trade, 2013 | ||||||
| ‘000 | ||||||
| Port | Region of trade | Total | ||||
| Great Britain & | Other EU | Non-EU1 | Other ports2 | Coastal trade | ||
| Northern | ||||||
| Ireland | ||||||
| Total goods handled | ||||||
| Arklow Port | 13 | - | - | - | - | 13 |
| Bantry Bay | 362 | 343 | - | 507 | 257 | 1,469 |
| Castletownbere | - | 0 | 33 | - | - | 33 |
| Cork | 1,422 | 3,339 | 1,628 | 1,396 | 1,198 | 8,983 |
| Drogheda | 305 | 669 | 21 | 39 | 11 | 1,044 |
| Dublin | 11,991 | 6,183 | 314 | 868 | 509 | 19,865 |
| Dundalk | 3 | 88 | - | - | 7 | 97 |
| Dun Laoghaire | 4 | - | - | - | - | 4 |
| Galway | 49 | 84 | - | - | 389 | 521 |
| Greenore | 20 | 199 | 59 | 104 | - | 383 |
| Killybegs | 0 | 13 | 27 | 24 | 4 | 68 |
| Kilrush | - | 2 | - | - | - | 2 |
| Kinsale | - | 2 | 6 | - | - | 9 |
| New Ross | 19 | 249 | 47 | 11 | 16 | 343 |
| Rosslare | 1,499 | 441 | - | - | - | 1,940 |
| Shannon Foynes Port | 1,128 | 3,242 | 476 | 5,172 | 271 | 10,290 |
| Sligo | 32 | 2 | - | - | - | 34 |
| Tralee Fenit | 7 | - | 3 | 16 | - | 26 |
| Waterford | 137 | 906 | 123 | 30 | 152 | 1,348 |
| Wicklow | 31 | 111 | - | - | - | 142 |
| Youghal | 7 | 71 | 30 | - | - | 108 |
| Total | 17,028 | 15,944 | 2,769 | 8,167 | 2,814 | 46,722 |
| 1 Trade with ports in European countries that are not members of the E.U. | ||||||
| 2 Trade with ports in Non-European countries | ||||||
| Table 12A Tonnage of goods received and forwarded classified by port and category of traffic, 2013 | ||||||
| ‘000 | ||||||
| Port | Category of traffic | Total | ||||
| Liquid bulk | Dry bulk | Lift-on/lift-off | Roll-on/roll-off | Break bulk & | ||
| other goods | ||||||
| Goods received | ||||||
| Arklow Port | - | - | - | - | 13 | 13 |
| Bantry Bay | 804 | - | - | - | - | 804 |
| Castletownbere | - | - | - | - | 33 | 33 |
| Cork | 3,213 | 1,534 | 890 | 37 | 47 | 5,721 |
| Drogheda | 25 | 289 | - | - | 94 | 408 |
| Dublin | 3,502 | 1,222 | 2,297 | 5,663 | 29 | 12,713 |
| Dundalk | - | 74 | - | - | 4 | 79 |
| Dun Laoghaire | - | - | - | 2 | 1 | 2 |
| Galway | 409 | 4 | - | - | 16 | 429 |
| Greenore | - | 287 | - | - | 97 | 383 |
| Killybegs | 1 | - | - | - | 2 | 3 |
| Kilrush | - | - | - | - | - | - |
| Kinsale | - | 9 | - | - | - | 9 |
| New Ross | 8 | 334 | - | - | 2 | 343 |
| Rosslare | - | - | - | 820 | - | 820 |
| Shannon Foynes Port | 1,081 | 7,247 | - | - | 28 | 8,356 |
| Sligo | - | 27 | - | - | 5 | 32 |
| Tralee Fenit | - | - | - | - | - | - |
| Waterford | - | 984 | 118 | - | 30 | 1,132 |
| Wicklow | - | 2 | - | - | 19 | 21 |
| Youghal | - | - | - | - | 103 | 103 |
| Total | 9,043 | 12,012 | 3,305 | 6,522 | 521 | 31,403 |
| Goods forwarded | ||||||
| Arklow Port | - | - | - | - | - | - |
| Bantry Bay | 665 | - | - | - | - | 665 |
| Castletownbere | - | - | - | - | 0 | 0 |
| Cork | 1,834 | 445 | 853 | 14 | 116 | 3,262 |
| Drogheda | - | 630 | - | - | 6 | 636 |
| Dublin | - | 777 | 1,878 | 4,489 | 9 | 7,153 |
| Dundalk | - | 19 | - | - | - | 19 |
| Dun Laoghaire | - | - | - | 1 | - | 1 |
| Galway | - | 58 | - | - | 34 | 92 |
| Greenore | - | - | - | - | 0 | 0 |
| Killybegs | - | 1 | - | - | 64 | 65 |
| Kilrush | - | - | - | - | 2 | 2 |
| Kinsale | - | - | - | - | - | - |
| New Ross | - | - | - | - | - | - |
| Rosslare | - | - | - | 1,120 | - | 1,120 |
| Shannon Foynes Port | - | 1,858 | - | - | 76 | 1,934 |
| Sligo | - | 2 | - | - | - | 2 |
| Tralee Fenit | - | - | - | - | 26 | 26 |
| Waterford | - | 25 | 168 | - | 23 | 216 |
| Wicklow | - | 121 | - | - | - | 121 |
| Youghal | - | - | - | - | 5 | 5 |
| Total | 2,499 | 3,936 | 2,900 | 5,623 | 361 | 15,319 |
| Table 12B Total tonnage of goods handled classified by port and category of traffic, 2013 | ||||||
| ‘000 | ||||||
| Port | Category of traffic | Total | ||||
| Liquid bulk | Dry bulk | Lift-on/lift-off | Roll-on/roll-off | Break bulk & | ||
| other goods | ||||||
| Total goods handled | ||||||
| Arklow Port | - | - | - | - | 13 | 13 |
| Bantry Bay | 1,469 | - | - | - | - | 1,469 |
| Castletownbere | - | - | - | - | 33 | 33 |
| Cork | 5,047 | 1,979 | 1,743 | 51 | 163 | 8,983 |
| Drogheda | 25 | 919 | - | - | 100 | 1,044 |
| Dublin | 3,502 | 1,999 | 4,175 | 10,152 | 39 | 19,865 |
| Dundalk | - | 93 | - | - | 4 | 97 |
| Dun Laoghaire | - | - | - | 3 | 1 | 4 |
| Galway | 409 | 62 | - | - | 50 | 521 |
| Greenore | - | 287 | - | - | 97 | 383 |
| Killybegs | 1 | 1 | - | - | 66 | 68 |
| Kilrush | - | - | - | - | 2 | 2 |
| Kinsale | - | 9 | - | - | - | 9 |
| New Ross | 8 | 334 | - | - | 2 | 343 |
| Rosslare | - | - | - | 1,940 | - | 1,940 |
| Shannon Foynes Port | 1,081 | 9,105 | - | - | 104 | 10,290 |
| Sligo | - | 29 | - | - | 5 | 34 |
| Tralee Fenit | - | - | - | - | 26 | 26 |
| Waterford | - | 1,010 | 286 | - | 52 | 1,348 |
| Wicklow | - | 123 | - | - | 19 | 142 |
| Youghal | - | - | - | - | 108 | 108 |
| Total | 11,541 | 15,948 | 6,204 | 12,145 | 883 | 46,722 |
| Table 13A Tonnage of goods received classified by port and detailed region of trade for key ports, 2013 | |||||||||
| ‘000 | |||||||||
| Detailed region of trade | Port | Total | |||||||
| Bantry | Cork | Drogheda | Dublin | Galway | Rosslare | Shannon | Waterford | ||
| Bay | Foynes | ||||||||
| Great Britain & Northern Ireland | |||||||||
| Falmouth | 63 | 0 | - | - | - | - | - | - | 63 |
| Fishguard | - | - | - | - | - | 623 | - | - | 623 |
| Heysham | - | - | - | 229 | - | - | - | - | 229 |
| Holyhead | - | - | - | 2,393 | - | - | - | - | 2,393 |
| Immingham | 154 | 54 | - | - | - | - | - | - | 208 |
| Liverpool | - | 3 | 2 | 2,326 | - | - | - | 13 | 2,343 |
| Manchester | - | 22 | 2 | 11 | - | - | 80 | 1 | 116 |
| Milford Haven (inc. Pembroke) | - | 106 | 17 | 2,551 | - | - | 566 | - | 3,241 |
| Teeside | - | 127 | 2 | 11 | - | - | 16 | 24 | 181 |
| Other ports | - | 190 | 26 | 134 | 5 | - | 31 | 81 | 467 |
| Total | 217 | 503 | 50 | 7,655 | 5 | 623 | 693 | 119 | 9,864 |
| Other EU | |||||||||
| Belgium - Antwerp | 39 | 229 | 30 | 349 | 13 | - | 42 | 8 | 709 |
| Belgium - Zeebrugge | - | 0 | - | 384 | - | - | - | - | 385 |
| France - Cherbourg | - | - | - | - | - | 193 | - | - | 193 |
| France - Rouen | - | 29 | 3 | 100 | - | - | 32 | 61 | 225 |
| Netherlands - Amsterdam | - | 22 | 12 | 41 | - | - | 48 | 3 | 125 |
| Netherlands - Rotterdam | - | 716 | 16 | 1,952 | - | - | 177 | 62 | 2,923 |
| Spain - Bilbao | - | 10 | - | 189 | - | - | - | 2 | 201 |
| Spain - Las Palmas | 223 | - | - | - | - | - | 1,172 | - | 1,395 |
| Spain - Sa. Cruz de Tenerife | - | - | - | - | - | - | 109 | - | 109 |
| Other ports | 81 | 1,018 | 231 | 677 | 22 | 5 | 638 | 651 | 3,323 |
| Total | 343 | 2,023 | 291 | 3,693 | 35 | 197 | 2,219 | 787 | 9,588 |
| Non-EU | |||||||||
| Norway | - | 1,405 | 10 | 108 | - | - | 56 | 50 | 1,629 |
| Russia | - | 73 | 9 | 63 | - | - | 285 | 53 | 482 |
| Other countries | - | 58 | 1 | 38 | - | - | 16 | 16 | 131 |
| Total | - | 1,536 | 20 | 209 | - | - | 357 | 119 | 2,241 |
| Other ports | |||||||||
| Argentina | - | 251 | - | 197 | - | - | - | - | 447 |
| Brazil | - | - | - | 18 | - | - | 885 | - | 903 |
| Columbia | - | - | - | - | - | - | 1,446 | - | 1,446 |
| Guinea | - | - | - | - | - | - | 2,227 | - | 2,227 |
| Libya | - | 254 | - | - | - | - | - | - | 254 |
| Nigeria | 127 | 86 | - | - | - | - | - | - | 213 |
| U.S.A. | - | 277 | 9 | 276 | - | - | 190 | 9 | 760 |
| Other countries | 117 | 449 | 27 | 215 | - | - | 288 | 16 | 1,113 |
| Total | 244 | 1,315 | 36 | 706 | - | - | 5,037 | 25 | 7,363 |
| Coastal trade | |||||||||
| Cork | - | - | 2 | 450 | 389 | - | 25 | - | 866 |
| Other ports | - | 345 | 9 | - | - | - | 25 | 81 | 460 |
| Total | - | 345 | 11 | 450 | 389 | - | 50 | 81 | 1,326 |
| Total | 804 | 5,721 | 408 | 12,713 | 429 | 820 | 8,356 | 1,132 | 30,383 |
| 1 The activity of all other ports not listed above amounts to a total of 432,000 tonnes | |||||||||
| Table 13B Tonnage of goods forwarded classified by port and detailed region of trade for key ports, 2013 | |||||||||
| ‘000 | |||||||||
| Detailed region of trade | Port | Total | |||||||
| Bantry | Cork | Drogheda | Dublin | Galway | Rosslare | Shannon | Waterford | ||
| Bay | Foynes | ||||||||
| Great Britain & Northern Ireland | |||||||||
| Belfast | - | 32 | - | 61 | - | - | 35 | - | 128 |
| Blythe | - | - | - | - | - | - | 27 | - | 27 |
| Fishguard | - | - | - | - | - | 876 | - | - | 876 |
| Heysham | - | - | - | 200 | - | - | - | - | 200 |
| Holyhead | - | - | - | 1,951 | - | - | - | - | 1,951 |
| Immingham | - | 423 | - | - | - | - | 13 | - | 436 |
| Liverpool | - | - | - | 1,968 | - | - | 9 | 8 | 1,986 |
| Milford Haven (inc. Pembroke) | - | 394 | - | - | - | - | - | - | 394 |
| Swansea | - | - | 99 | 14 | - | - | - | - | 113 |
| Other ports | 145 | 71 | 156 | 142 | 43 | - | 351 | 10 | 918 |
| Total | 145 | 919 | 255 | 4,336 | 43 | 876 | 435 | 18 | 7,028 |
| - | |||||||||
| Other EU | - | ||||||||
| Belgium - Antwerp | - | 287 | 16 | 308 | - | - | 89 | 2 | 701 |
| Belgium - Zeebrugge | - | - | - | 218 | - | - | - | - | 218 |
| Finland - Kokkola | - | 134 | - | 136 | - | - | 11 | - | 280 |
| France - Cherbourg | - | - | - | - | - | 239 | - | - | 239 |
| France - Dunkerque | - | - | - | - | - | - | 159 | - | 159 |
| France - le Harve | - | 29 | - | 76 | - | - | 7 | - | 112 |
| Netherlands - Amsterdam | - | 38 | - | 17 | - | - | 57 | - | 111 |
| Netherlands - Moerdijk | - | 44 | 49 | 40 | - | - | 28 | - | 161 |
| Netherlands - Rotterdam | - | 548 | 48 | 1,325 | - | - | 149 | 106 | 2,177 |
| Spain - Bilbao | - | - | - | 59 | 11 | - | 47 | - | 117 |
| Other ports | - | 236 | 265 | 311 | 38 | 5 | 477 | 10 | 1,343 |
| Total | - | 1,316 | 378 | 2,490 | 49 | 244 | 1,023 | 119 | 5,618 |
| Non-EU | |||||||||
| Norway | - | 90 | 1 | 105 | - | - | 74 | 4 | 273 |
| Other countries | - | 3 | - | 0 | - | - | 45 | - | 48 |
| Total | - | 93 | 1 | 105 | - | - | 119 | 4 | 321 |
| Other ports | |||||||||
| Morocco | - | 0 | - | - | - | - | 119 | - | 119 |
| U.S.A. | - | 56 | - | - | - | - | - | - | 56 |
| Other countries | 263 | 25 | 3 | 162 | - | - | 16 | 5 | 473 |
| Total | 263 | 81 | 3 | 162 | - | - | 135 | 5 | 648 |
| Coastal trade | |||||||||
| Cork | 257 | - | - | 40 | - | - | 33 | 61 | 391 |
| Dublin | - | 456 | - | - | - | - | 60 | 1 | 518 |
| Galway | - | 387 | - | - | - | - | 7 | - | 394 |
| Other ports | - | 10 | - | 19 | - | - | 121 | 9 | 159 |
| Total | 257 | 853 | - | 59 | - | - | 221 | 71 | 1,461 |
| Total | 665 | 3,262 | 636 | 7,153 | 92 | 1,120 | 1,934 | 216 | 15,077 |
| 1 The activity of all other ports not listed above amounts to a total of 20,000 tonnes | |||||||||
Coverage
This release contains the results of an annual analysis of activity at Irish ports in 2013. The data is compiled from returns made by Scheduled Harbour Authorities, State Companies and a number of other harbours as outlined below:
Scheduled harbour authorities
Arklow harbour commissioners
Bantry Bay harbour commissioners
Kilrush town council
Kinsale harbour commissioners
Sligo harbour commissioners
Tralee and Fenit pier and harbour commissioners
Youghal town council
State Companies
Drogheda port company
Dublin port company
Dundalk port company
Dun Laoghaire harbour company
Galway harbour company
New Ross port company
Port of Cork company
Port of Waterford company
Shannon Foynes port company
Wicklow port company
Other harbours
Castletownbere fishery harbour centre
Greenore port
Killybegs fishery harbour centre
Rosslare Europort
As the figures (detailed in tables 1-15) have been rounded independently there may be slight discrepancies between the sum of the constituent items and the totals shown. A ‘0’ indicates a value that has been rounded to zero, whereas a ‘-’ indicates no activity.
Definitions
Tonnage of Goods:
This includes the weight of immediate packaging material but excludes, in the case of containerised traffic, the weight of containers. The tonnage of goods for roll-on/roll-off traffic may be based on estimated coefficients for certain vehicle categories.
Region of Trade:
Coastal - Trade between Irish ports excluding Northern Ireland.
Great Britain & Northern Ireland - Includes Isle of Man and other British crown dependencies.
Other EU - Trade with ports in European countries that are members of the E.U. excluding Ireland and Great Britain. Outermost regions of Member States (e.g. the Canary Islands) are included.
Non EU - Trade with ports in European countries that are not members of the E.U.
Other Ports - Trade with ports in Non European countries.
Gross Tonnage of Vessels:
The measure of the overall size of a ship determined in accordance with the provisions of the International Convention on Tonnage Measurement of Ships, 1969.
Vessel types:
Only the activity of trading vessels, car ferries and other passenger vessels is covered in the series. Only vessels of at least 100 gross tonnes are included. The following vessels are excluded:
– Fish-catching vessels
– Fish-processing vessels
– Vessels for drilling and exploration (exception: Killybegs)
– Tugs
– Pusher craft
– Research and survey vessels
– Dredgers
– Naval vessels
– Vessels used solely for non-commercial purposes
– Vessels entering the ports for shelter
Vessel types are classified according to the International Classification of Ship Types (ICST-COM). Cruise liners are included where passengers embark or disembark in port.
The ship categories included under each vessel type are outlined below:
Liquid bulk vessels:
Oil tanker
Chemical tanker
Liquid gas tanker
Tanker barge
Other tanker
Dry bulk vessels:
Bulk/oil carrier
Bulk carrer
Container vessels:
Full container
Specialised vessels:
Barge carrier
Chemical carrier
Irradiated fuel carrier
Livestock carrier
Vehicle carrier
Other specialised carrier
General cargo vessels:
Reefer
Ro-ro passenger
Ro-ro container
Other ro-ro container
Combination carrier general cargo/passenger
Combination carrier general cargo/container
Single decker
Multi-decker
Passenger vessels:
Cruise liners
Other passenger only vessels
 Hide Background Notes
Scan the QR code below to view this release online or go to
http://www.cso.ie/en/releasesandpublications/er/spt/statisticsofporttraffic2013/
 Hide Table 1: Number of arrivals and gross tonnage of vessels, 2008 - 2013