| Monthly Services Index | |||
| (Base Year 2010 = 100) | |||
| Value Index | Monthly % change | Annual % change | |
| February 2012 | 106.3 | 2.8 | 5.0 |
| January 2013 | 106.4 | -1.1 | 2.8 |
| February 2013 | 105.3 | -1.1 | -1.0 |
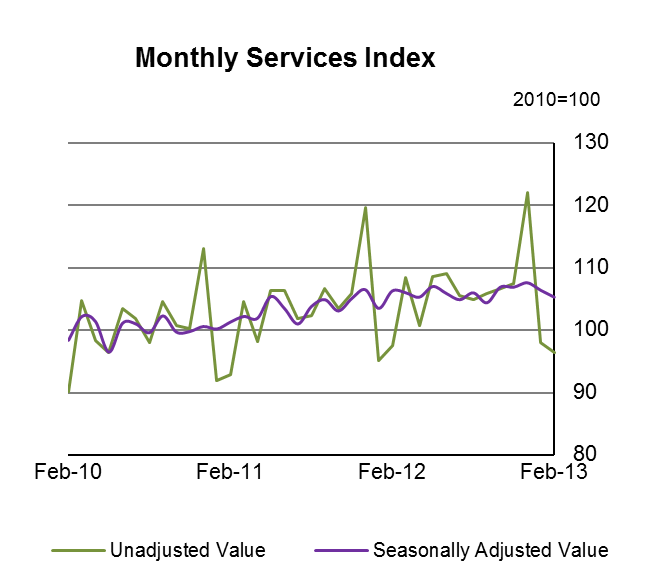
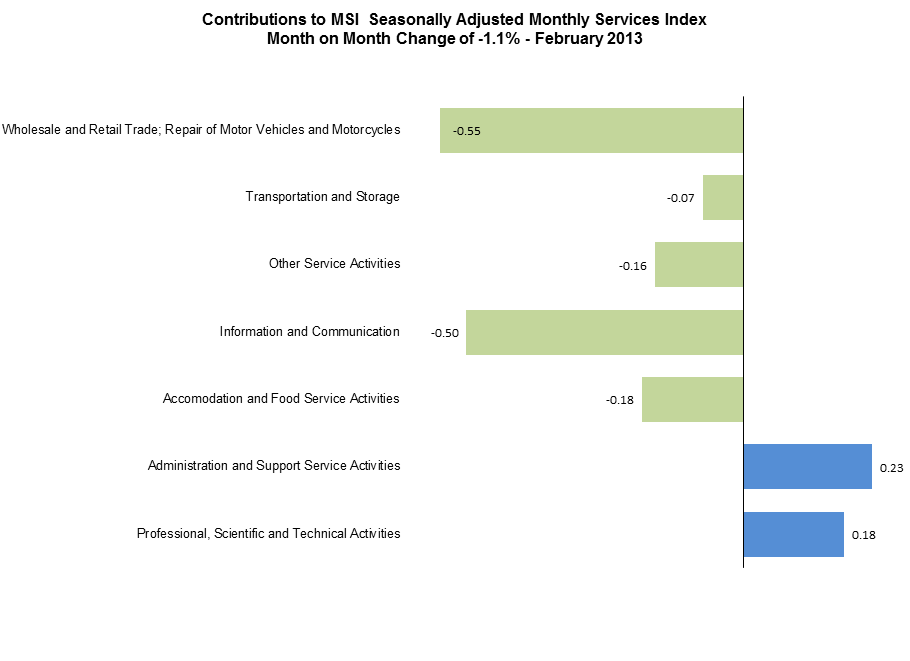
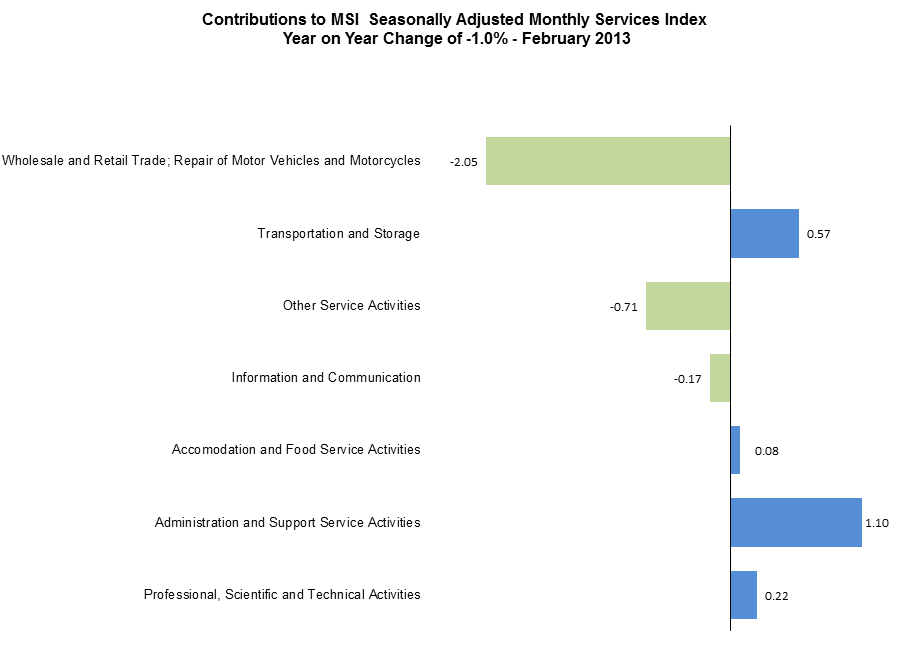
The seasonally adjusted monthly services value index decreased by 1.1% in February 2013 when compared with January 2013 and there was an annual decrease of 1.0%.
Administrative and Support Service Activities (+3.0%), Professional, Scientific and Technical Activities (+1.7%) and Transportation and Storage(+0.7%) showed month on month increases when compared with January 2013. Other Service Activities (-3.3%), Accommodation and Food Service Activities (-2.9%), Information and Communication (-1.9%) and Wholesale and Retail Trade (-1.6%) showed decreases when compared with the preceding month.
Administrative and Support Service Activities (+15.8%), Transportation and Storage (+5.6%), Professional, Scientific and Technical Activities (+2.0%) and Accommodation and Food Service Activities (+1.3%) showed annual increases when compared with February 2012. Other Service Activities (-13.2%), Wholesale and Retail Trade (-5.9%) and Information and Communication (-0.7%) showed decreases when compared with February 2012.
| Table 1 Seasonally adjusted indices for the non-financial traded services sector1 | ||||
| Base Year: 2010=100 | ||||
| Total Non-Financial Traded Services | ||||
| NACE 45-63, 68-96 | ||||
| Period | Index | Monthly % change | Annual % change | |
| 2009 | 102.4 | |||
| 2010 | 99.9 | -2.4 | ||
| 2011 | 103.2 | 3.3 | ||
| 2012 | 105.9 | 2.6 | ||
| 2011 | 4th quarter | 104.9 | 1.6 | 4.9 |
| 2012 | 1st quarter | 105.3 | 0.4 | 4.0 |
| 2nd quarter | 106.1 | 0.7 | 2.4 | |
| 3rd quarter | 105.1 | -0.9 | 1.8 | |
| 4th quarter | 107.1 | 1.9 | 2.2 | |
| 2011 | August | 103.8 | 2.8 | 4.2 |
| September | 104.9 | 1.1 | 2.6 | |
| October | 103.1 | -1.7 | 3.4 | |
| November | 105.1 | 1.9 | 5.3 | |
| December | 106.5 | 1.3 | 5.9 | |
| 2012 | January | 103.5 | -2.8 | 3.2 |
| February | 106.3 | 2.8 | 5.0 | |
| March | 106.0 | -0.3 | 3.8 | |
| April | 105.3 | -0.6 | 3.4 | |
| May | 107.0 | 1.6 | 1.4 | |
| June | 105.9 | -1.0 | 2.3 | |
| July | 104.9 | -0.9 | 3.9 | |
| August | 106.0 | 1.0 | 2.1 | |
| September | 104.4 | -1.5 | -0.5 | |
| October | 106.9 | 2.4 | 3.6 | |
| November | 106.9 | 0.0 | 1.8 | |
| December | 107.6 | 0.7 | 1.1 | |
| 2013 | January | 106.4 | -1.1 | 2.8 |
| February2 | 105.3 | -1.1 | -1.0 | |
| 1 Based on Seasonal Patterns up to February 2013 | ||||
| 2 Provisional Value Indices based on early returns from respondents | ||||
| Table 2(a) Seasonally adjusted indices by sector1 | |||||||||
| Base Year: 2010=100 | |||||||||
| Wholesale and Retail Trade; Repair of Motor Vehicles and Motorcycles2 | Wholesale Trade4 | ||||||||
| NACE 45 - 47 | NACE 46 | ||||||||
| Period | Index | Monthly % change | Annual % change | Index | Monthly % change | Annual % change | |||
| 2009 | 95.5 | 90.3 | |||||||
| 2010 | 100.0 | 4.6 | 99.9 | 10.6 | |||||
| 2011 | 107.2 | 7.3 | 114.2 | 14.3 | |||||
| 2012 | 109.6 | 2.3 | 118.9 | 4.2 | |||||
| 2011 | 4th quarter | 110.4 | 2.3 | 7.8 | 120.1 | 3.7 | 13.6 | ||
| 2012 | 1st quarter | 110.9 | 0.5 | 5.6 | 122.2 | 1.8 | 10.9 | ||
| 2nd quarter | 110.1 | -0.8 | 4.3 | 120.8 | -1.2 | 9.2 | |||
| 3rd quarter | 108.6 | -1.3 | 0.7 | 116.6 | -3.5 | 0.7 | |||
| 4th quarter | 109.0 | 0.4 | -1.3 | 116.2 | -0.3 | -3.2 | |||
| 2011 | August | 108.8 | 4.0 | 9.3 | 117.4 | 6.5 | 20.4 | ||
| September | 110.3 | 1.4 | 7.4 | 119.9 | 2.2 | 15.4 | |||
| October | 110.4 | 0.1 | 9.1 | 120.4 | 0.4 | 18.0 | |||
| November | 110.5 | 0.1 | 7.1 | 119.8 | -0.6 | 12.1 | |||
| December | 110.2 | -0.3 | 7.2 | 120.2 | 0.3 | 10.9 | |||
| 2012 | January | 108.5 | -1.6 | 5.6 | 120.8 | 0.5 | 11.6 | ||
| February | 112.0 | 3.2 | 4.4 | 123.3 | 2.0 | 9.7 | |||
| March | 112.2 | 0.2 | 6.7 | 122.6 | -0.6 | 11.5 | |||
| April | 110.0 | -1.9 | 5.8 | 120.3 | -1.9 | 10.8 | |||
| May | 111.3 | 1.1 | 4.3 | 122.6 | 2.0 | 8.2 | |||
| June | 108.9 | -2.2 | 2.9 | 119.4 | -2.6 | 8.8 | |||
| July | 108.9 | 0.0 | 4.2 | 119.0 | -0.4 | 7.9 | |||
| August | 109.2 | 0.3 | 0.4 | 117.7 | -1.1 | 0.3 | |||
| September | 107.7 | -1.4 | -2.4 | 113.1 | -3.9 | -5.7 | |||
| October | 110.3 | 2.4 | -0.1 | 116.9 | 3.4 | -2.9 | |||
| November | 109.3 | -0.9 | -1.1 | 117.3 | 0.3 | -2.0 | |||
| December | 107.4 | -1.8 | -2.6 | 114.4 | -2.5 | -4.8 | |||
| 2013 | January | 107.2 | -0.2 | -1.2 | 118.6 | 3.7 | -1.8 | ||
| February3 | 105.4 | -1.6 | -5.9 | 110.1 | -7.2 | -10.7 | |||
| 1 Based on Seasonal Patterns up to February 2013 | |||||||||
| 2 Retail sales and Motor figures are published in detail in the Retail Sales Index | |||||||||
| 3 Provisional Value Indices based on early returns from respondents | |||||||||
| 4 Wholesale Trade is a sub-component of Wholesale and Retail Trade; Repair of Motor Vehicles and Motorcycles | |||||||||
| Table 2(b) Seasonally adjusted indices by sector1 | |||||||||||||
| Base Year: 2010=100 | |||||||||||||
| Accommodation and Food Service Activities | Accommodation | Food and Beverage Service Activities2 | |||||||||||
| NACE 55-56 | NACE 55 | NACE 561, 562 | |||||||||||
| Period | Index | Monthly % change | Annual % change | Index | Monthly % change | Annual % change | Index | Monthly % change | Annual % change | ||||
| 2009 | 111.8 | 113.2 | 108.4 | ||||||||||
| 2010 | 100.1 | -10.5 | 100.2 | -11.5 | 100.0 | -7.8 | |||||||
| 2011 | 101.3 | 1.2 | 105.2 | 5.0 | 102.8 | 2.8 | |||||||
| 2012 | 103.6 | 2.2 | 107.3 | 2.0 | 109.9 | 6.9 | |||||||
| 2011 | 4th quarter | 101.4 | -0.3 | 3.5 | 100.7 | -7.0 | 1.0 | 109.6 | 7.7 | 11.9 | |||
| 2012 | 1st quarter | 101.0 | -0.4 | 1.3 | 101.3 | 0.6 | -3.2 | 108.5 | -1.0 | 11.2 | |||
| 2nd quarter | 103.7 | 2.7 | 1.5 | 108.2 | 6.8 | 1.2 | 109.8 | 1.2 | 7.6 | ||||
| 3rd quarter | 105.0 | 1.2 | 3.2 | 109.8 | 1.4 | 1.4 | 111.1 | 1.2 | 9.2 | ||||
| 4th quarter | 104.5 | -0.4 | 3.0 | 109.9 | 0.1 | 9.1 | 110.0 | -1.0 | 0.4 | ||||
| 2011 | August | 99.7 | -4.8 | 0.8 | 105.2 | -7.8 | 8.8 | 100.5 | -0.8 | -0.9 | |||
| September | 100.8 | 1.1 | 1.1 | 105.5 | 0.3 | 6.4 | 103.6 | 3.1 | 1.3 | ||||
| October | 101.0 | 0.2 | -0.9 | 100.9 | -4.4 | -2.6 | 107.0 | 3.3 | 7.1 | ||||
| November | 101.6 | 0.6 | 5.0 | 101.8 | 0.9 | 5.3 | 108.1 | 1.0 | 10.1 | ||||
| December | 101.7 | 0.0 | 6.8 | 99.4 | -2.3 | 0.7 | 113.9 | 5.4 | 18.9 | ||||
| 2012 | January | 101.2 | -0.5 | 2.2 | 98.3 | -1.1 | -6.1 | 108.0 | -5.1 | 15.5 | |||
| February | 99.1 | -2.1 | -0.9 | 98.3 | 0.0 | -7.0 | 108.7 | 0.6 | 10.9 | ||||
| March | 102.6 | 3.5 | 2.6 | 107.4 | 9.3 | 3.7 | 108.8 | 0.1 | 7.6 | ||||
| April | 101.3 | -1.3 | -3.8 | 103.4 | -3.8 | -5.1 | 105.1 | -3.4 | 0.3 | ||||
| May | 103.3 | 1.9 | 2.7 | 109.6 | 6.0 | 3.5 | 110.0 | 4.7 | 9.1 | ||||
| June | 106.6 | 3.2 | 5.8 | 111.6 | 1.8 | 5.2 | 114.2 | 3.8 | 13.7 | ||||
| July | 102.0 | -4.4 | -2.7 | 106.1 | -4.9 | -7.0 | 108.8 | -4.7 | 7.4 | ||||
| August | 106.0 | 4.0 | 6.3 | 111.8 | 5.3 | 6.2 | 111.8 | 2.8 | 11.3 | ||||
| September | 107.0 | 1.0 | 6.2 | 111.3 | -0.4 | 5.5 | 112.7 | 0.8 | 8.8 | ||||
| October | 103.7 | -3.1 | 2.7 | 108.2 | -2.8 | 7.2 | 110.0 | -2.4 | 2.8 | ||||
| November | 105.3 | 1.5 | 3.6 | 109.9 | 1.5 | 7.9 | 110.7 | 0.6 | 2.5 | ||||
| December | 104.6 | -0.7 | 2.8 | 111.7 | 1.6 | 12.3 | 109.4 | -1.2 | -3.9 | ||||
| 2013 | January | 103.5 | -1.0 | 2.3 | 106.4 | -4.7 | 8.3 | 111.0 | 1.5 | 2.7 | |||
| February3 | 100.5 | -2.9 | 1.3 | 105.1 | -1.2 | 7.0 | 107.5 | -3.2 | -1.1 | ||||
| 1 Based on Seasonal Patterns up to February 2013 | |||||||||||||
| 2 NACE 563 relates to Bars, and is published separately in the Retail Sales Index | |||||||||||||
| 3 Provisional Value Indices based on early returns from respondents | |||||||||||||
| Table 2(c) Seasonally adjusted indices by sector1 | |||||||||
| Base Year: 2010=100 | |||||||||
| Professional, Scientific and Technical Activities | Administrative and Support Service Activities2 | ||||||||
| NACE 64-75 | NACE 77-82 | ||||||||
| Period | Index | Monthly % change | Annual % change | Index | Monthly % change | Annual % change | |||
| 2009 | 119.1 | 97.3 | |||||||
| 2010 | 100.1 | -15.9 | 99.9 | 2.7 | |||||
| 2011 | 101.1 | 1.0 | 92.7 | -7.2 | |||||
| 2012 | 90.3 | -10.7 | 99.4 | 7.2 | |||||
| 2011 | 4th quarter | 99.1 | -1.0 | 1.4 | 93.0 | 1.9 | -3.6 | ||
| 2012 | 1st quarter | 90.8 | -8.3 | -9.4 | 91.6 | -1.5 | -3.7 | ||
| 2nd quarter | 92.7 | 2.0 | -11.8 | 100.1 | 9.3 | 9.1 | |||
| 3rd quarter | 87.0 | -6.2 | -13.1 | 102.7 | 2.6 | 12.6 | |||
| 4th quarter | 90.9 | 4.5 | -8.3 | 103.5 | 0.8 | 11.3 | |||
| 2011 | August | 98.0 | -3.7 | -5.5 | 89.7 | 3.0 | -9.1 | ||
| September | 100.6 | 2.6 | -7.4 | 96.7 | 7.8 | -1.6 | |||
| October | 94.5 | -6.0 | -4.6 | 89.5 | -7.5 | -5.7 | |||
| November | 97.4 | 3.0 | -2.3 | 91.6 | 2.4 | -3.2 | |||
| December | 105.4 | 8.2 | 11.4 | 97.8 | 6.8 | -2.1 | |||
| 2012 | January | 90.1 | -14.4 | -13.7 | 83.8 | -14.3 | -11.7 | ||
| February | 89.2 | -1.0 | -9.8 | 93.4 | 11.4 | -0.4 | |||
| March | 93.2 | 4.4 | -4.5 | 97.5 | 4.4 | 1.0 | |||
| April | 92.0 | -1.3 | -7.2 | 98.3 | 0.9 | 5.1 | |||
| May | 93.9 | 2.1 | -18.0 | 102.7 | 4.4 | 12.4 | |||
| June | 92.2 | -1.8 | -9.3 | 99.3 | -3.3 | 10.1 | |||
| July | 88.4 | -4.1 | -13.1 | 107.1 | 7.9 | 22.9 | |||
| August | 85.8 | -3.0 | -12.5 | 102.4 | -4.4 | 14.1 | |||
| September | 86.6 | 1.0 | -13.9 | 98.5 | -3.8 | 1.9 | |||
| October | 91.0 | 5.0 | -3.7 | 105.1 | 6.7 | 17.5 | |||
| November | 91.9 | 1.0 | -5.6 | 103.2 | -1.8 | 12.6 | |||
| December | 89.7 | -2.4 | -14.9 | 102.0 | -1.1 | 4.3 | |||
| 2013 | January | 89.5 | -0.2 | -0.7 | 105.0 | 2.9 | 25.2 | ||
| February3 | 91.0 | 1.7 | 2.0 | 108.1 | 3.0 | 15.8 | |||
| 1 Based on Seasonal Patterns up to February 2013 | |||||||||
| 2 NACE 7735 is excluded | |||||||||
| 3 Provisional Value Indices based on early returns from respondents | |||||||||
| Table 2(d) Seasonally adjusted indices by sector1 | |||||||||||||
| Base Year: 2010=100 | |||||||||||||
| Transportation and Storage | Information and Communication | Other Service Activities | |||||||||||
| NACE 49-53 | NACE 58-63 | NACE 68, 92-93, 95-96 | |||||||||||
| Period | Index | Monthly % change | Annual % change | Index | Monthly % change | Annual % change | Index | Monthly % change | Annual % change | ||||
| 2009 | 112.1 | 93.5 | 121.1 | ||||||||||
| 2010 | 100.2 | -10.6 | 99.6 | 6.5 | 99.9 | -17.5 | |||||||
| 2011 | 103.8 | 3.6 | 103.2 | 3.7 | 100.6 | 0.7 | |||||||
| 2012 | 109.3 | 5.3 | 112.6 | 9.0 | 96.9 | -3.7 | |||||||
| 2011 | 4th quarter | 101.5 | -2.8 | 2.6 | 107.3 | 4.2 | 5.1 | 102.4 | 2.0 | 12.4 | |||
| 2012 | 1st quarter | 103.7 | 2.1 | -1.3 | 112.5 | 4.8 | 14.2 | 102.3 | 0.0 | 7.1 | |||
| 2nd quarter | 110.2 | 6.3 | 5.7 | 111.1 | -1.2 | 6.7 | 95.1 | -7.0 | -8.5 | ||||
| 3rd quarter | 112.8 | 2.4 | 8.0 | 110.4 | -0.6 | 7.1 | 93.5 | -1.7 | -6.8 | ||||
| 4th quarter | 110.7 | -1.9 | 9.0 | 116.4 | 5.4 | 8.4 | 96.4 | 3.1 | -5.9 | ||||
| 2011 | August | 103.5 | -1.3 | 3.5 | 107.1 | 10.6 | 9.5 | 98.7 | -5.3 | -0.6 | |||
| September | 104.8 | 1.3 | 8.2 | 105.2 | -1.8 | 0.7 | 98.3 | -0.4 | 4.0 | ||||
| October | 102.5 | -2.2 | 3.1 | 103.9 | -1.2 | 4.6 | 99.4 | 1.1 | 0.2 | ||||
| November | 99.5 | -2.9 | -1.7 | 110.6 | 6.4 | 11.2 | 100.6 | 1.2 | 14.0 | ||||
| December | 102.5 | 3.0 | 6.6 | 107.6 | -2.7 | -0.1 | 107.2 | 6.6 | 24.8 | ||||
| 2012 | January | 102.4 | -0.1 | -1.8 | 112.5 | 4.6 | 16.3 | 99.1 | -7.6 | 7.8 | |||
| February | 103.4 | 1.0 | -2.9 | 115.3 | 2.4 | 19.7 | 107.2 | 8.2 | 13.3 | ||||
| March | 105.2 | 1.8 | 0.9 | 109.7 | -4.8 | 7.1 | 100.8 | -6.0 | 0.7 | ||||
| April | 111.7 | 6.2 | 7.9 | 108.8 | -0.8 | 8.2 | 95.7 | -5.0 | -9.2 | ||||
| May | 108.2 | -3.1 | 3.2 | 112.8 | 3.6 | 7.0 | 94.6 | -1.2 | -8.6 | ||||
| June | 110.5 | 2.1 | 6.1 | 111.6 | -1.0 | 5.0 | 95.0 | 0.4 | -7.7 | ||||
| July | 112.5 | 1.8 | 7.2 | 108.2 | -3.1 | 11.7 | 91.9 | -3.3 | -11.7 | ||||
| August | 112.9 | 0.4 | 9.1 | 113.5 | 5.0 | 6.0 | 94.3 | 2.6 | -4.4 | ||||
| September | 112.9 | 0.0 | 7.8 | 109.4 | -3.6 | 4.0 | 94.3 | 0.0 | -4.1 | ||||
| October | 110.2 | -2.4 | 7.5 | 113.2 | 3.5 | 8.9 | 96.5 | 2.3 | -2.9 | ||||
| November | 109.9 | -0.3 | 10.5 | 114.3 | 0.9 | 3.4 | 97.8 | 1.4 | -2.7 | ||||
| December | 111.9 | 1.8 | 9.1 | 121.7 | 6.5 | 13.1 | 94.9 | -3.0 | -11.5 | ||||
| 2013 | January | 110.0 | -1.7 | 7.4 | 116.7 | -4.1 | 3.7 | 96.2 | 1.4 | -2.9 | |||
| February2 | 109.2 | -0.7 | 5.6 | 114.5 | -1.9 | -0.7 | 93.0 | -3.3 | -13.2 | ||||
| 1 Based on Seasonal Patterns up to February 2013 | |||||||||||||
| 2 Provisional Value Indices based on early returns from respondents | |||||||||||||
The monthly services value index (MSI) monitors trends in output at current prices of enterprises in the non-financial traded services sector. This is the first step in the development of a Services Production Index that measures gross value added changes at constant prices, i.e. a volume index.
The sample size is approximately 2,100 enterprises. The sample comprises a census of all enterprises with an annual turnover value of more than €20m or enterprises with more than 100 persons engaged. The remainder of the target population is stratified using 2-digit Statistical Classification of Economic Activities in the European Community, i.e. NACE Rev. 2 classifications. Each of these 2-digit NACE sectors are further subdivided into strata based on turnover. A simple random sample is then drawn from each stratum. Retail and Motor Trade figures are taken from the separate Retail Sales Index sample of approximately 1,400 enterprises.
The response rates for the provisional results are typically 49% in terms of the enterprises surveyed which represents 70% of the value of total turnover. The corresponding figures for the final results are 59% and 88% respectively. These response rates are based on averages for the 6 month period ending March 2012.
The business activity classifications used in this statistical release are based on the Statistical Classification of Economic Activities in the European Community i.e. NACE Rev. 2. For further information on the NACE Rev. 2 classification of services activity, visit the CSO website:
http://www.cso.ie/px/u/NACECoder/NACEItems/searchnace.asp
The index system is structured on the non-financial traded services sector covered in the 2010 Annual Services Inquiry (ASI). This non-financial traded services sector is further broken down as follows:
To compile the MSI, each of the above published NACE sectors is separated into three distinct cells based on the constituent enterprises’ reported gross value added (GVA) for 2010. Using data taken from the 2010 ASI, GVA baseweights are then calculated for each of these cells and the baseweights are updated each month using a matched sample approach.
An enterprise’s monthly GVA value is calculated as follows; respondents report their monthly turnover figures which are transformed into estimated GVA figures by applying a firm specific factor based on an individual respondent’s 2010 ASI return. The factor is calculated for each firm by simply dividing their estimated GVA by reported turnover. If an enterprise was not on the ASI sample then the relevant cell mean GVA/turnover ratio, calculated from the 2010 ASI, is applied. The reason for this change in methodology is to reduce the disproportionate impact that some enterprises (which report large turnover figures but have a relatively small GVA) can have on the overall series.
Seasonal adjustment for each of the sectors is conducted using a direct seasonal adjustment approach. However, the overall MSI is estimated using the indirect approach, i.e. the MSI is derived by adding the weighted seasonally adjusted sub-components. The main reason for adopting the indirect approach for the MSI is to attribute the monthly and annual changes in the MSI to each of its sub-components. Seasonal adjustment models are developed for each series based on unadjusted data spanning from January 2009 to the current period. These models are reviewed on an annual basis; however seasonal factors are updated each month.
The seasonal adjustment of the MSI is conducted using the X-13ARIMA-SEATS software produced, distributed and maintained by the U.S. Census Bureau. The ARIMA option in X-13ARIMA-SEATS is used to forecast and backcast the series in order to have sufficient data to run the seasonal adjustment, as currently we have less than five years of data. Due to the lack of a sufficiently long series the series are not adjusted for Easter and Trading effects. The seasonal estimates do, however, take into account other factors that may impact on the quality of the seasonal adjustment, i.e. outliers, temporary changes and level shifts.
For additional information on the use of X-13ARIMA-SEATS see (Findley, D.F., B.C. Monsell, W.R. Bell, M.C. Otto, and B. Chen (1998), “New Capabilities and Methods of the X-12-Arima Seasonal Adjustment Program”, Journal of Business & Economic Statistics, 16, pp. 127-177.) and http://www.census.gov/srd/www/x13as/.
The main reasons for differences in the new rebased and updated MSI series in comparison with the MSI (base year 2009 =100) are as follows:
 Hide Background Notes
Scan the QR code below to view this release online or go to
http://www.cso.ie/en/releasesandpublications/er/si/monthlyservicesindexfebruary2013/
 Show Table 1 Seasonally adjusted indices for the non-financial traded services sector
  Hide Table 1 Seasonally adjusted indices for the non-financial traded services sector