
No link available
| Current Health Expenditure in Ireland, 2013 and 2014 | ||
| 2013 | 2014 | |
| Current Health Expenditure (€ bn) | 18.8 | 19.1 |
| Current Health Expenditure % GDP | 10.5 | 10.1 |
| Current Health Expenditure % GNI | 12.3 | 11.7 |
Ireland’s current health expenditure was €19.1 billion in 2014. This represented 10.1% of gross domestic product (GDP) or 11.7% of gross national income (GNI).
|
This release provides the first estimates of Irish health care expenditure for 2014 and revised estimates for 2013, according to the System of Health Accounts standard. See Background Notes for further details. Please note that the rounding of percentages to the nearest interger results in some subtotals not summing to 100%. |
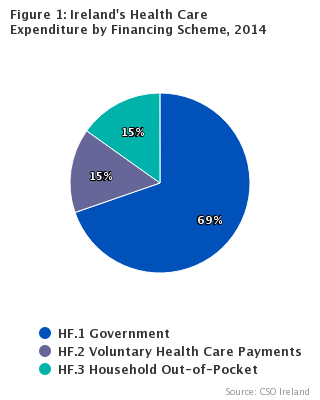
Financing of Health Care Services in Ireland
The majority of health expenditure in 2014 (€13,265 million or 69%) was financed by government (HF.1).
The remainder was mainly funded by household out-of-pocket payments (15%) and health insurance (13%).
| Table 1: Current Health Care Expenditure by Financing Scheme, 2013 and 2014 | |||||||
| 2013 | 2014 | ||||||
| ICHA-HF Code | €m | % | €m | % | |||
| HF.1 | Govt Financing Schemes and Compulsory Contributory Health Care Financing Schemes | 13,096 | 70 | 13,265 | 69 | ||
| HF.1.1 | Government Schemes | 13,040 | 70 | 13,212 | 69 | ||
| HF.1.2 | Compulsory Contributory Health Insurance Schemes | 56 | 0 | 53 | 0 | ||
| HF.2 | Voluntary Health Care Payment Schemes | 2,858 | 15 | 2,927 | 15 | ||
| HF.2.1 | Voluntary Health Insurance Schemes | 2,376 | 13 | 2,429 | 13 | ||
| HF.2.x | Other Voluntary Care Payment Schemes | 482 | 3 | 498 | 3 | ||
| HF.3 | Household Out-of-Pocket Payments | 2,822 | 15 | 2,956 | 15 | ||
| HF.1-HF.3 | Total Current Health Care Expenditure | 18,776 | 100 | 19,148 | 100 | ||
Health Care Providers in Ireland
Just over one-third of health expenditure happened in hospitals (HP.1) in 2014, with a further 19% in long-term residential facilities (HP.2) such as nursing homes and residential disability services (see Table 2). Ambulatory health care providers (HP.3), predominantly GPs and dentists, accounted for 20% of expenditure.
Retailers of Medical Goods (mainly pharmacies) accounted for a further €2,716 million or 14% of all health care expenditure in 2014.
| Table 2: Current Health Care Expenditure by Provider, 2013 and 2014 | |||||
| 2013 | 2014 | ||||
| ICHA-HP Code | €m | % | €m | % | |
| HP.1 | Hospitals | 6,596 | 35 | 6,648 | 35 |
| HP.2 | Long-Term Residential Facilities | 3,536 | 19 | 3,640 | 19 |
| HP.3 | Ambulatory Health Care Providers | 3,767 | 20 | 3,842 | 20 |
| HP.4 | Ancillary Health Care Providers | 249 | 1 | 278 | 1 |
| HP.5 | Retailers of Medical Goods | 2,753 | 15 | 2,716 | 14 |
| HP.6 | Providers of Preventative Care | 230 | 1 | 228 | 1 |
| HP.7 | Providers of Health Care Administration and Financing | 564 | 3 | 670 | 3 |
| HP.8 | Rest of the Economy | 1,041 | 6 | 1,087 | 6 |
| HP.9 | Rest of the World | 27 | 0 | 28 | 0 |
| HP.0 | Providers N.E.C. | 12 | 0 | 11 | 0 |
| HP.1 to HP.0 | Total Current Health Care Expenditure | 18,776 | 100 | 19,148 | 100 |
| Current Health Care Expenditure by Provider, 2014 | |
| Hospitals | 6.64777290241591 |
| Long-Term Residential Facilities | 3.64008732119756 |
| Ambulatory Health Care Providers | 3.84184978415254 |
| Ancillary Health Care Providers | 0.278422067240694 |
| Retailers of Medical Goods | 2.71636785702557 |
| Other Providers | 2.0237379562651 |
| Current Health Care Expenditure by Provider, 2014 | |
| Hospitals | 6.49038004832299 |
| Long-Term Residential Facilities | 3.59359991658288 |
| Ambulatory Health Care Provider | 3.63427176249534 |
| Ancillary Health Care Provider | 0.233457874781588 |
| Retailer of Medical Goods | 2.75983958544838 |
| Other Providers | 1.67524481752315 |
Health Care Services in Ireland
The functional classification, i.e. the type of health services provided, is the key classification for defining the boundary of health care (see Table 3).
The majority of health expenditure related to curative and rehabilitative care (€10,291 million) and nearly half of this was for inpatient care (€4,553 million). The next largest category was long-term care which amounted to 22% of expenditure, again with inpatient services the largest component of this (€2,708 million).
Pharmaceuticals and other medical non-durables (HC.5.1) made up the next largest category (14%). Administration of the health care system (public and private) amounted to €674 million in 2014, 4% of current health expenditure.
The profile of health expenditure in Ireland by source of funding, by provider and by function was unchanged between 2013 and 2014.
| Table 3: Current Health Care Expenditure by Health Care Function, 2013 and 2014 | |||||||||
| 2013 | 2014 | ||||||||
| ICHA-HC Code | €m | % | €m | % | |||||
| HC.1+HC.2 | Curative and Rehabilitative Care | 10,144 | 54 | 10,291 | 54 | ||||
| HC.1.1+HC.2.1 | Inpatient Curative & Rehabilitative Care | 4,416 | 24 | 4,553 | 24 | ||||
| HC.1.2+HC.2.2 | Day Curative and Rehabilitative Care | 1,254 | 7 | 1,285 | 7 | ||||
| HC.1.3+HC.2.3 | Outpatient Curative & Rehabilitative Care | 3,821 | 20 | 3,774 | 20 | ||||
| HC.1.4+HC.2.4 | Home-Based Curative & Rehabilitative Care | 653 | 3 | 679 | 4 | ||||
| HC.3 | Long-Term Care (Health) | 4,100 | 22 | 4,263 | 22 | ||||
| HC.3.1 | Inpatient Long-Term Care (Health) | 2,593 | 14 | 2,708 | 14 | ||||
| HC.3.2 | Day Long-Term Care (Health) | 166 | 1 | 169 | 1 | ||||
| HC.3.4 | Home-Based Long-Term Care (Health) | 1,340 | 7 | 1,386 | 7 | ||||
| HC.4 | Ancillary Services | 560 | 3 | 548 | 3 | ||||
| HC.4.1 | Laboratory Services | 199 | 1 | 194 | 1 | ||||
| HC.4.2 | Imaging Services | 50 | 0 | 38 | 0 | ||||
| HC.4.3 | Patient Transportation | 179 | 1 | 189 | 1 | ||||
| Ancillary Services N.E.C | 132 | 1 | 126 | 1 | |||||
| HC.5 | Medical Goods (Non-Specified by Function) | 2,872 | 15 | 2,838 | 15 | ||||
| HC.5.1 | Pharmaceuticals and Other Medical Non-Durables | 2,798 | 15 | 2,764 | 14 | ||||
| HC.5.2 | Therapeutic Appliances and Other Medical Goods | 74 | 0 | 74 | 0 | ||||
| HC.6 | Preventive Care | 525 | 3 | 525 | 3 | ||||
| HC.6.1 | Information, Education and Counceling Programmes | 67 | 0 | 66 | 0 | ||||
| HC.6.2 | Immunisation Programmes | 44 | 0 | 43 | 0 | ||||
| HC.6.3 | Early Disease Detection Programmes | 60 | 0 | 60 | 0 | ||||
| HC.6.4 | Healthy Condition Monitoring Programmes | 193 | 1 | 195 | 1 | ||||
| HC.6.5 | Epidemiological Surveillance, Disease Control Programmes | 82 | 0 | 76 | 0 | ||||
| HC.6.6 | Preparing for Disaster and Emergency Response Programmes | 2 | 0 | 2 | 0 | ||||
| Preventative Care N.E.C | 77 | 0 | 84 | 0 | |||||
| HC.7 | Governance and Health System Administration and Financing | 569 | 3 | 674 | 4 | ||||
| HC.7.1 | Govt Health Administration Agencies | 174 | 1 | 182 | 1 | ||||
| HC.7.2 | Administration of Health Financing | 395 | 2 | 492 | 3 | ||||
| HC.9 | Health Care Services N.E.C | 7 | 0 | 9 | 0 | ||||
| HC.1 to HC.9 | Total Current Health Care Expenditure | 18,776 | 100 | 19,148 | 100 | ||||
| Current Health Care Expenditure By Function, 2014 | |
| Curative and Rehabilitative Care | 10.3 |
| Long-Term Care (Health) | 4.3 |
| Ancillary Services | 0.5 |
| Medical Goods (Non-Specified by Function) | 2.8 |
| Other Health Care Functions | 1.2 |
Who is providing which services?
Tables 4A and 4B present a breakdown of health care expenditure by function (HC) and provider (HP) for 2013 and 2014.
Services provided by hospitals accounted for over one-third of health care expenditure in Ireland in 2014 (€6,648 million). Nearly two-thirds of this was on inpatient services.
Long-term residential facilities and ambulatory health care providers each accounted for one-fifth of expenditure. Long-term facilities, which include nursing homes and residential facilities for people with a disability, predominantly provided long-term care inpatient services (€2,610 million).
Ambulatory health care providers (GPs, dentists and other services such as home care providers and health care centres) mainly delivered outpatient services. In 2014, €3,842 million was spent on health care in these settings with 70% of this spent on outpatient curative and rehabilitative care.
Expenditure on pharmaceuticals (€2,636 million) accounted for almost 14% of health care expenditure with the vast majority being provided by pharmacies (which are included in retail sellers of medical goods, HP.5).
Other Sectors (HP.8, HP.9 and HP.0) also provided health care services amounting to €1,126 million in 2014. Two-thirds of this expenditure (€730 million) was for the provision of long-term health care services in the home (HC.3.4) by persons in receipt of transfer payments (e.g. Carers’ Allowance and Domiciliary Care Allowance).
| Table 4A: Current Health Care Expenditure by Health Care Function and Health Care Provider, 2013 | €million | |||||||||||||
| ICHA Code | HP.1 - Hospitals | HP.2 - Long-Term Residential Facilities | HP.3 - Ambulatory Health Care Providers | HP.4 - Ancillary Health Care Providers | HP.5 - Retailers of Medical Goods | HP.6 - Providers of Preventative Care | HP.7 - Providers of Health Care Administration and Financing | HP.8 - Rest of the Economy | HP.9 - Rest of the World | HP.0 - Providers N.E.C. | HP.1 to HP.0 - Total | |||
| HC.1+HC.2 | Curative and Rehabilitative Care | 6,214 | 587 | 3,282 | 7 | 3 | 19 | 25 | 8 | 10,144 | ||||
| HC.1.1+HC.2.1 | Inpatient Curative & Rehabilitative Care | 3,940 | 454 | 22 | 0 | 4,416 | ||||||||
| HC.1.2+HC.2.2 | Day Curative and Rehabilitative Care | 1,130 | 1 | 123 | 0 | 0 | 1,254 | |||||||
| HC.1.3+HC.2.3 | Outpatient Curative & Rehabilitative Care | 1,112 | 3 | 2,669 | 7 | 19 | 2 | 8 | 3,821 | |||||
| HC.1.4+HC.2.4 | Home-Based Curative & Rehabilitative Care | 32 | 128 | 490 | 3 | 0 | 653 | |||||||
| HC.3 | Long-Term Care (Health) | 76 | 2,949 | 392 | 682 | 4,100 | ||||||||
| HC.3.1 | Inpatient Long-Term Care (Health) | 76 | 2,517 | 2,593 | ||||||||||
| HC.3.2 | Day Long-Term Care (Health) | 2 | 164 | 166 | ||||||||||
| HC.3.4 | Home-Based Long-Term Care (Health) | 430 | 228 | 682 | 1,340 | |||||||||
| HC.4 | Ancillary Services | 303 | 4 | 249 | 2 | 1 | 560 | |||||||
| HC.4.1 | Laboratory Services | 137 | 61 | 199 | ||||||||||
| HC.4.2 | Imaging Services | 50 | 50 | |||||||||||
| HC.4.3 | Patient Transportation | 19 | 160 | 179 | ||||||||||
| Ancillary Services N.E.C | 97 | 0 | 4 | 27 | 2 | 1 | 132 | |||||||
| HC.5 | Medical Goods (Non-Specified by Function) | 2 | 2,746 | 124 | 2,872 | |||||||||
| HC.5.1 | Pharmaceuticals and Other Medical Non-Durables | 2 | 2,672 | 123 | 2,798 | |||||||||
| HC.5.2 | Therapeutic Appliances and Other Medical Goods | 73 | 1 | 74 | ||||||||||
| HC.6 | Preventative Care | 86 | 223 | 216 | 0 | 525 | ||||||||
| HC.6.1 | Information, Education and Counceling Programmes | 11 | 33 | 23 | 67 | |||||||||
| HC.6.2 | Immunisation Programmes | 8 | 36 | 44 | ||||||||||
| HC.6.3 | Early Disease Detection Programmes | 60 | 60 | |||||||||||
| HC.6.4 | Healthy Condition Monitoring Programmes | 193 | 193 | |||||||||||
| HC.6.5 | Epidemiological Surveillance, Disease Control Programmes | 82 | 82 | |||||||||||
| HC.6.6 | Preparing for Disaster and Emergency Response Programmes | 2 | 2 | |||||||||||
| Preventative Care N.E.C | 67 | 10 | 0 | 77 | ||||||||||
| HC.7 | Governance and Health System Administration and Financing | 4 | 564 | 569 | ||||||||||
| HC.7.1 | Govt Health Administration Agencies | 4 | 170 | 174 | ||||||||||
| HC.7.2 | Administration of Health Financing | 395 | 395 | |||||||||||
| HC.9 | Health Care Services N.E.C | 3 | 0 | 1 | 0 | 0 | 3 | 7 | ||||||
| HC.1 to HC.9 | Total Current Health Care Expenditure | 6,596 | 3,536 | 3,767 | 249 | 2,753 | 230 | 564 | 1,041 | 27 | 12 | 18,776 | ||
| Table 4B: Current Health Care Expenditure by Health Care Function and Health Care Provider, 2014 | €million | |||||||||||||
| ICHA Code | HP.1 - Hospitals | HP.2 - Long-Term Residential Facilities | HP.3 - Ambulatory Health Care Providers | HP.4 - Ancillary Health Care Providers | HP.5 - Retailers of Medical Goods | HP.6 - Providers of Preventative Care | HP.7 - Providers of Health Care Administration and Financing | HP.8 - Rest of the Economy | HP.9 - Rest of the World | HP.0 - Providers N.E.C. | HP.1 to HP.0 - Total | |||
| HC.1+HC.2 | Curative and Rehabilitative Care | 6,281 | 604 | 3,345 | 7 | 3 | 1 | 19 | 25 | 6 | 10,290 | |||
| HC.1.1+HC.2.1 | Inpatient Curative & Rehabilitative Care | 4,057 | 475 | 1 | 1 | 18 | 0 | 4,553 | ||||||
| HC.1.2+HC.2.2 | Day Curative and Rehabilitative Care | 1,157 | 1 | 125 | 2 | 0 | 1,285 | |||||||
| HC.1.3+HC.2.3 | Outpatient Curative & Rehabilitative Care | 1,034 | 3 | 2,701 | 7 | 19 | 5 | 6 | 3,774 | |||||
| HC.1.4+HC.2.4 | Home-Based Curative & Rehabilitative Care | 33 | 125 | 517 | 3 | 0 | 0 | 679 | ||||||
| HC.3 | Long-Term Care (Health) | 97 | 3,036 | 400 | 730 | 0 | 4,263 | |||||||
| HC.3.1 | Inpatient Long-Term Care (Health) | 97 | 2,610 | 0 | 0 | 2,708 | ||||||||
| HC.3.2 | Day Long-Term Care (Health) | 2 | 168 | 169 | ||||||||||
| HC.3.4 | Home-Based Long-Term Care (Health) | 424 | 232 | 730 | 1,386 | |||||||||
| HC.4 | Ancillary Services | 262 | 4 | 278 | 3 | 1 | 548 | |||||||
| HC.4.1 | Laboratory Services | 114 | 0 | 80 | 0 | 194 | ||||||||
| HC.4.2 | Imaging Services | 38 | 0 | 0 | 38 | |||||||||
| HC.4.3 | Patient Transportation | 19 | 170 | 189 | ||||||||||
| Ancillary Services N.E.C | 90 | 0 | 4 | 28 | 2 | 1 | 126 | |||||||
| Medical Goods (Non-Specified by Function) | 4 | 1 | 2,709 | 124 | 2,838 | |||||||||
| HC.5.1 | Pharmaceuticals and Other Medical Non-Durables | 4 | 1 | 2,636 | 123 | 2,764 | ||||||||
| HC.5.2 | Therapeutic Appliances and Other Medical Goods | 73 | 1 | 74 | ||||||||||
| HC.6 | Preventative Care | 91 | 220 | 214 | 525 | |||||||||
| HC.6.1 | Information, Education and Counceling Programmes | 11 | 36 | 20 | 66 | |||||||||
| HC.6.2 | Immunisation Programmes | 8 | 35 | 43 | ||||||||||
| HC.6.3 | Early Disease Detection Programmes | 60 | 60 | |||||||||||
| HC.6.4 | Healthy Condition Monitoring Programmes | 195 | 195 | |||||||||||
| HC.6.5 | Epidemiological Surveillance, Disease Control Programmes | 76 | 76 | |||||||||||
| HC.6.6 | Preparing for Disaster and Emergency Response Programmes | 2 | 2 | |||||||||||
| Preventative Care N.E.C | 73 | 11 | 0 | 84 | ||||||||||
| HC.7 | Governance and Health System Administration and Financing | 5 | 669 | 674 | ||||||||||
| HC.7.1 | Govt Health Administration Agencies | 5 | 177 | 182 | ||||||||||
| HC.7.2 | Administration of Health Financing | 492 | 492 | |||||||||||
| HC.9 | Health Care Services N.E.C | 4 | 0 | 1 | 0 | 0 | 4 | 9 | ||||||
| HC.1 to HC.9 | Total Current Health Care Expenditure | 6,648 | 3,640 | 3,842 | 278 | 2,716 | 228 | 670 | 1,087 | 28 | 11 | 19,148 | ||
How are health care services being funded?
Tables 5A and 5B present a breakdown of health care expenditure by function (HC) and financing scheme (HF) for 2013 and 2014.
Of the €10,291 million spent on curative and rehabilitative services in 2014, just over two-thirds (€7,017 million) was funded by government and 17% (€1,804 million) was funded from voluntary health insurance payments.
Government financed just under 80% (€3,351 million) of long-term care services in 2014. Almost all of the remainder (21% or €912 million) was financed by out-of-pocket payments by households (€815 million).
Over 30% (€885 million) of pharmaceutical expenditure was funded by out-of-pocket payments with the remainder funded by government. Preventive care (HC.6) such as immunisation and health promotion activities was funded by government (60%) and voluntary payments other than health insurance (40%). Tax refunds for health expenditure amounted to €146 million in 2014. As there is no information on what services were received, the expenditure is classified to health services not elsewhere classified.
| Table 5A: Current Health Care Expenditure by Health Care Function and Health Care Financing Scheme, 2013 | €millions | |||||||||||
| ICHA Code | HF.1 - Govt and Compulsory | HF.1.1 - Government Financing Schemes | HF.1.2 - Compulsory Contributory Schemes | HF.2 - Voluntary Health Care Payment Schemes | HF.2.1 - Voluntary Health Insurance Schemes | HF.2.x - Other Voluntary Health Care Payment Schemes | HF.3 - Household Out-of-Pocket Payments | HF.1 to HF.3 - Total | ||||
| HC.1+HC.2 | Curative and Rehabilitative Care | 6,892 | 6,873 | 20 | 2,011 | 1,846 | 165 | 1,241 | 10,144 | |||
| HC.1.1+HC.2.1 | Inpatient Curative & Rehabilitative Care | 2,983 | 2,983 | 1,335 | 1,279 | 56 | 98 | 4,416 | ||||
| HC.1.2+HC.2.2 | Day Curative and Rehabilitative Care | 767 | 767 | 474 | 455 | 18 | 14 | 1,254 | ||||
| HC.1.3+HC.2.3 | Outpatient Curative & Rehabilitative Care | 2,586 | 2,566 | 20 | 173 | 102 | 71 | 1,062 | 3,821 | |||
| HC.1.4+HC.2.4 | Home-Based Curative & Rehabilitative Care | 556 | 556 | 29 | 10 | 19 | 67 | 653 | ||||
| HC.3 | Long-Term Care (Health) | 3,257 | 3,234 | 23 | 91 | 91 | 752 | 4,100 | ||||
| HC.3.1 | Inpatient Long-Term Care (Health) | 1,798 | 1,798 | 68 | 68 | 728 | 2,593 | |||||
| HC.3.2 | Day Long-Term Care (Health) | 162 | 162 | 3 | 3 | 2 | 166 | |||||
| HC.3.4 | Home-Based Long-Term Care (Health) | 1,297 | 1,274 | 23 | 21 | 21 | 22 | 1,340 | ||||
| HC.4 | Ancillary Services | 368 | 368 | 130 | 130 | 62 | 560 | |||||
| HC.4.1 | Laboratory Services | 152 | 152 | 46 | 199 | |||||||
| HC.4.2 | Imaging Services | 50 | 50 | 50 | ||||||||
| HC.4.3 | Patient Transportation | 165 | 165 | 0 | 14 | 179 | ||||||
| Ancillary Services N.E.C | 130 | 130 | 2 | 132 | ||||||||
| HC.5 | Medical Goods (Non-Specified by Function) | 1,969 | 1,955 | 14 | * | * | * | 903 | 2,872 | |||
| HC.5.1 | Pharmaceuticals and Other Medical Non-Durables | 1,922 | 1,922 | * | * | * | 876 | 2,798 | ||||
| HC.5.2 | Therapeutic Appliances and Other Medical Goods | 46 | 33 | 14 | * | * | 28 | 74 | ||||
| HC.6 | Preventative Care | 318 | 318 | 207 | 2 | 205 | 525 | |||||
| HC.6.1 | Information, Education and Counceling Programmes | 67 | 67 | 1 | 1 | 0 | 67 | |||||
| HC.6.2 | Immunisation Programmes | 44 | 44 | 44 | ||||||||
| HC.6.3 | Early Disease Detection Programmes | 59 | 59 | 1 | 1 | 60 | ||||||
| HC.6.4 | Healthy Condition Monitoring Programmes | 3 | 3 | 189 | 189 | 193 | ||||||
| HC.6.5 | Epidemiological Surveillance, Disease Control Programmes | 76 | 76 | 5 | 5 | 82 | ||||||
| HC.6.6 | Preparing for Disaster and Emergency Response Programmes | 2 | 2 | 0 | 2 | |||||||
| Preventative Care N.E.C | 66 | 66 | 11 | 2 | 9 | 77 | ||||||
| HC.7 | Governance and Health System Administration and Financing | 156 | 156 | 413 | 395 | 18 | 569 | |||||
| HC.7.1 | Govt Health Administration Agencies | 156 | 156 | 18 | 18 | 174 | ||||||
| HC.7.2 | Administration of Health Financing | 395 | 395 | 395 | ||||||||
| HC.9 | Health Care Services N.E.C | 137 | 137 | 6 | 4 | 2 | -136 | 7 | ||||
| HC.1 to HC.9 | Total Current Health Care Expenditure | 13,096 | 13,040 | 56 | 2,858 | 2,376 | 482 | 2,822 | 18,776 | |||
| * Confidential | ||||||||||||
| Table 5B: Current Health Care Expenditure by Health Care Function and Health Care Financing Scheme, 2014 | €million | ||||||||||
| ICHA Code | HF.1 - Govt and Compulsory | HF.1.1 - Government Financing Schemes | HF.1.2 - Compulsory Contributory Schemes | HF.2 - Voluntary Health Care Payment Schemes | HF.2.1 - Voluntary Health Insurance Schemes | HF.2.x - Other Voluntary Health Care Payment Schemes | HF.3 - Household Out-of-Pocket Payments | HF.1 to HF.3 - Total | |||
| HC.1+HC.2 | Curative and Rehabilitative Care | 7,017 | 7,001 | 16 | 1,972 | 1,804 | 168 | 1,302 | 10,291 | ||
| HC.1.1+HC.2.1 | Inpatient Curative & Rehabilitative Care | 3,132 | 3,132 | 1,330 | 1,266 | 63 | 91 | 4,553 | |||
| HC.1.2+HC.2.2 | Day Curative and Rehabilitative Care | 814 | 814 | 449 | 430 | 20 | 22 | 1,285 | |||
| HC.1.3+HC.2.3 | Outpatient Curative & Rehabilitative Care | 2,485 | 2,469 | 16 | 163 | 97 | 66 | 1,127 | 3,774 | ||
| HC.1.4+HC.2.4 | Home-Based Curative & Rehabilitative Care | 586 | 586 | 30 | 11 | 19 | 62 | 679 | |||
| HC.3 | Long-Term Care (Health) | 3,351 | 3,327 | 24 | 97 | 97 | 815 | 4,263 | |||
| HC.3.1 | Inpatient Long-Term Care (Health) | 1,840 | 1,840 | 74 | 74 | 793 | 2,708 | ||||
| HC.3.2 | Day Long-Term Care (Health) | 160 | 160 | 3 | 3 | 6 | 169 | ||||
| HC.3.4 | Home-Based Long-Term Care (Health) | 1,351 | 1,327 | 24 | 20 | 20 | 16 | 1,386 | |||
| HC.4 | Ancillary Services | 349 | 349 | 126 | 124 | 2 | 72 | 548 | |||
| HC.4.1 | Laboratory Services | 137 | 137 | 1 | 1 | 56 | 194 | ||||
| HC.4.2 | Imaging Services | 37 | 37 | 0 | 1 | 38 | |||||
| HC.4.3 | Patient Transportation | 175 | 175 | 1 | 1 | 14 | 189 | ||||
| Ancillary Services N.E.C | 124 | 124 | 2 | 126 | |||||||
| HC.5 | Medical Goods (Non-Specified by Function) | 1,925 | 1,913 | 13 | * | * | * | 913 | 2,838 | ||
| HC.5.1 | Pharmaceuticals and Other Medical Non-Durables | 1,880 | 1,880 | * | * | * | 885 | 2,764 | |||
| HC.5.2 | Therapeutic Appliances and Other Medical Goods | 46 | 33 | 13 | * | * | 28 | 74 | |||
| HC.6 | Preventative Care | 315 | 315 | 211 | 2 | 208 | 525 | ||||
| HC.6.1 | Information, Education and Counceling Programmes | 65 | 65 | 1 | 1 | 66 | |||||
| HC.6.2 | Immunisation Programmes | 43 | 43 | 0 | 43 | ||||||
| HC.6.3 | Early Disease Detection Programmes | 59 | 59 | 1 | 1 | 60 | |||||
| HC.6.4 | Healthy Condition Monitoring Programmes | 3 | 3 | 191 | 191 | 195 | |||||
| HC.6.5 | Epidemiological Surveillance, Disease Control Programmes | 72 | 72 | 5 | 5 | 76 | |||||
| HC.6.6 | Preparing for Disaster and Emergency Response Programmes | 1 | 1 | 0 | 2 | ||||||
| Preventative Care N.E.C | 71 | 71 | 13 | 2 | 10 | 84 | |||||
| HC.7 | Governance and Health System Administration and Financing | 161 | 161 | 513 | 492 | 21 | 674 | ||||
| HC.7.1 | Govt Health Administration Agencies | 161 | 161 | 21 | 21 | 182 | |||||
| HC.7.2 | Administration of Health Financing | 492 | 492 | 492 | |||||||
| HC.9 | Health Care Services N.E.C | 147 | 147 | 8 | 7 | 2 | -146 | 9 | |||
| HC.1 to HC.9 | Total Current Health Care Expenditure | 13,265 | 13,212 | 53 | 2,927 | 2,429 | 498 | 2,956 | 19,148 | ||
| * Confidential | |||||||||||
How are health care providers being funded?
Tables 6A and 6B present a breakdown of health care expenditure by health care provider (HP) and financing scheme (HF) for 2013 and 2014.
Government was the majority funder of health care providers in Ireland in 2014 (69%). Three-quarters of expenditure in long-term care facilities were government funded as was 70% of hospital expenditure. Three-quarters of pharmaceutical expenditure was also funded by government.
Just under three-quarters of voluntary health insurance payments (€1,761 million) were spent on hospital services.
After tax refunds of €146 million were taken into account, out of pocket expenditure amounted to €2,956 million in 2014. Almost two-fifths of this (€1,145 million) was spent on ambulatory health care providers and over a quarter (€848 million) was on long-term care facilities. Over 20% of out-of-pocket payments (€636 million) was spent in pharmacies.
| Table 6A: Current Health Care Expenditure by Health Care Provider and Health Care Financing Scheme, 2013 | €million | ||||||||||
| ICHA Code | HF.1 - Govt and Compulsory | HF.1.1 - Government Financing Schemes | HF.1.2 - Compulsory Contributory Schemes | HF.2 - Voluntary Health Care Payment Schemes | HF.2.1 - Voluntary Health Insurance Schemes | HF.2.x - Other Voluntary Health Care Payment Schemes | HF.3 - Household Out-of-Pocket Payments | HF.1 to HF.3 - Total | |||
| HP.1 | Hospitals | 4,594 | 4,594 | 1,876 | 1,801 | 75 | 126 | 6,596 | |||
| HP.1.1 | General Hospitals | 3,863 | 3,863 | 1,653 | 1,590 | 63 | 104 | 5,620 | |||
| HP.1.2 | Mental Health Hospitals | 191 | 191 | 78 | 76 | 2 | 10 | 279 | |||
| HP.1.3 | Specialised Hospitals (other than Mental Health Hospitals) | 540 | 540 | 145 | 135 | 10 | 12 | 697 | |||
| HP.2 | Long-Term Residential Facilities | 2,619 | 2,619 | 121 | 23 | 99 | 796 | 3,536 | |||
| HP.3 | Ambulatory Health Care Providers | 2,511 | 2,491 | 20 | 183 | 101 | 82 | 1,073 | 3,767 | ||
| HP.3.1 | Medical Practices | 520 | 520 | 57 | 57 | 302 | 878 | ||||
| HP.3.2 | Dental Practices | 92 | 72 | 20 | 17 | 17 | 480 | 588 | |||
| HP.3.3 | Other Health Care Practitioners | 64 | 64 | 13 | 12 | 1 | 195 | 272 | |||
| HP.3.4 | Ambulatory Health Care Centres | 1,438 | 1,438 | 79 | 7 | 72 | 33 | 1,550 | |||
| HP.3.5 | Providers of Home Health Care Services | 397 | 397 | 18 | 10 | 8 | 63 | 477 | |||
| HP.4 | Ancillary Health Care Providers | 162 | 162 | 28 | 27 | 60 | 249 | ||||
| HP.4.1 | Providers of Patient Transportation and Emergency Rescue | 146 | 146 | 1 | 1 | 0 | 14 | 162 | |||
| HP.4.2 | Medical and Diagnostic Laboratories | 15 | 15 | 26 | 26 | 46 | 88 | ||||
| HP.5 | Retailers of Medical Goods | 1,968 | 1,955 | 14 | * | * | * | 785 | 2,753 | ||
| HP.5.1 | Pharmacies | 1,923 | 1,923 | * | * | * | 634 | 2,557 | |||
| HP.5.2 | Retail Sellers of Durable Medical Goods and Appliances | 46 | 32 | 14 | * | * | 151 | 196 | |||
| HP.6 | Providers of Preventive Care | 207 | 207 | 23 | 23 | 0 | 230 | ||||
| HP.7 | Providers of Health Care System Administration and Financing | 156 | 156 | 408 | 395 | 14 | 564 | ||||
| HP.7.1 | Govt Health Administration Agencies | 156 | 156 | 14 | 14 | 170 | |||||
| HP.7.3 | Private Health Insurance Administration Agencies | 395 | 395 | 395 | |||||||
| HP.8 | Rest of the Economy | 732 | 710 | 23 | 189 | 189 | 119 | 1,041 | |||
| HP.8.1 | Households as Providers of Home Health Care | 682 | 659 | 23 | 682 | ||||||
| HP.8.2 | All Other Industries as Secondary Providers of Health Care | 51 | 51 | 189 | 189 | 119 | 359 | ||||
| HP.9 | Rest of the World | 10 | 10 | 17 | 17 | 27 | |||||
| HP.0 | Providers N.E.C. | 136 | 136 | 12 | 12 | 1 | -136 | 12 | |||
| HP.1 to HP.0 | Total Current Health Care Expenditure | 13,096 | 13,040 | 56 | 2,858 | 2,376 | 482 | 2,822 | 18,776 | ||
| * Confidential | |||||||||||
| Table 6B: Current Health Care Expenditure by Health Care Provider and Health Care Financing Scheme, 2014 | €million | ||||||||||
| ICHA Code | HF.1 - Govt and Compulsory | HF.1.1 - Government Financing Schemes | HF.1.2 - Compulsory Contributory Schemes | HF.2 - Voluntary Health Care Payment Schemes | HF.2.1 - Voluntary Health Insurance Schemes | HF.2.x - Other Voluntary Health Care Payment Schemes | HF.3 - Household Out-of-Pocket Payments | HF.1 to HF.3 - Total | |||
| HP.1 | Hospitals | 4,667 | 4,667 | 1,853 | 1,761 | 92 | 128 | 6,648 | |||
| HP.1.1 | General Hospitals | 3,894 | 3,894 | 1,644 | 1,563 | 81 | 110 | 5,649 | |||
| HP.1.2 | Mental Health Hospitals | 203 | 203 | 80 | 77 | 3 | 6 | 289 | |||
| HP.1.3 | Specialised Hospitals (other than Mental Health Hospitals) | 570 | 570 | 129 | 121 | 8 | 12 | 710 | |||
| HP.2 | Long-Term Residential Facilities | 2,669 | 2,669 | 123 | 21 | 102 | 848 | 3,640 | |||
| HP.3 | Ambulatory Health Care Providers | 2,525 | 2,509 | 16 | 172 | 100 | 72 | 1,145 | 3,842 | ||
| HP.3.1 | Medical Practices | 492 | 492 | 55 | 55 | 336 | 883 | ||||
| HP.3.2 | Dental Practices | 88 | 72 | 16 | 17 | 17 | 500 | 605 | |||
| HP.3.3 | Other Health Care Practitioners | 66 | 66 | 11 | 11 | 1 | 211 | 288 | |||
| HP.3.4 | Ambulatory Health Care Centres | 1,469 | 1,469 | 70 | 7 | 62 | 38 | 1,577 | |||
| HP.3.5 | Providers of Home Health Care Services | 410 | 410 | 20 | 11 | 9 | 60 | 490 | |||
| HP.4 | Ancillary Health Care Providers | 182 | 182 | 28 | 28 | 68 | 278 | ||||
| HP.4.1 | Providers of Patient Transportation and Emergency Rescue | 156 | 156 | 1 | 1 | 0 | 14 | 171 | |||
| HP.4.2 | Medical and Diagnostic Laboratories | 26 | 26 | 27 | 27 | 54 | 107 | ||||
| HP.5 | Retailers of Medical Goods | 1,922 | 1,910 | 13 | * | * | * | 794 | 2,716 | ||
| HP.5.1 | Pharmacies | 1,877 | 1,877 | * | * | * | 636 | 2,514 | |||
| HP.5.2 | Retail Sellers of Durable Medical Goods and Appliances | 45 | 32 | 13 | * | * | 158 | 202 | |||
| HP.6 | Providers of Preventive Care | 203 | 203 | 25 | 25 | 228 | |||||
| HP.7 | Providers of Health Care System Administration and Financing | 162 | 162 | 508 | 492 | 16 | 670 | ||||
| HP.7.1 | Govt Health Administration Agencies | 162 | 162 | 16 | 16 | 177 | |||||
| HP.7.3 | Private Health Insurance Administration Agencies | 492 | 492 | 492 | |||||||
| HP.8 | Rest of the Economy | 777 | 753 | 24 | 191 | 191 | 119 | 1,087 | |||
| HP.8.1 | Households as Providers of Home Health Care | 730 | 706 | 24 | 730 | ||||||
| HP.8.2 | All Other Industries as Secondary Providers of Health Care | 48 | 48 | 191 | 191 | 119 | 357 | ||||
| HP.9 | Rest of the World | 12 | 12 | 16 | 16 | 0 | 28 | ||||
| HP.0 | Providers N.E.C. | 146 | 146 | 11 | 11 | -146 | 11 | ||||
| HP.1 to HP.0 | Total Current Health Care Expenditure | 13,265 | 13,212 | 53 | 2,927 | 2,429 | 498 | 2,956 | 19,148 | ||
| * Confidential | |||||||||||
Health expenditure over time
Health expenditure in Ireland expressed as a percentage of GDP exceeded the OECD average in 2008 and has remained consistently above the average ever since.
| Table 7: Revised Health Care Expenditure in Ireland, 2000 to 2014 | €million | |||||||||||||||||
| 2000 | 2001 | 2002 | 2003 | 2004 | 2005 | 2006 | 2007 | 2008 | 2009 | 2010 | 2011 | 2012 | 2013b | 2014 | ||||
| Total Health Care Expenditure (€m) | 6,922 | 8,532 | 9,896 | 10,950 | 12,200 | 13,681 | 14,438 | 16,263 | 17,898 | 18,509 | 18,199 | 17,924 | 18,207 | 19,690 | 20,042 | |||
| Capital Expenditure (€m)1 | 522 | 727 | 822 | 749 | 918 | 665 | 539 | 877 | 807 | 671 | 583 | 729 | 526 | 914 | 894 | |||
| Current Expenditure (€m) | 6,400 | 7,805 | 9,075 | 10,201 | 11,282 | 13,016 | 13,899 | 15,387 | 17,091 | 17,838 | 17,616 | 17,195 | 17,682 | 18,776 | 19,148 | |||
| Current Public Expenditure (€m) | 4,961 | 6,122 | 7,168 | 8,035 | 8,903 | 10,265 | 10,817 | 12,191 | 13,557 | 13,748 | 13,420 | 13,065 | 13,410 | 13,096 | 13,265 | |||
| Current Private Expenditure (€m) | 1,439 | 1,683 | 1,906 | 2,166 | 2,379 | 2,750 | 3,082 | 3,195 | 3,534 | 4,090 | 4,197 | 4,130 | 4,272 | 5,680 | 5,884 | |||
| Current Expenditure % GDP, Ireland | 5.9% | 6.4% | 6.7% | 7.0% | 7.2% | 7.7% | 7.5% | 7.8% | 9.1% | 10.5% | 10.6% | 9.9% | 10.1% | 10.5% | 10.1% | |||
| Current Expenditure % GNI, Ireland | 6.8% | 7.5% | 8.0% | 8.1% | 8.4% | 8.8% | 8.5% | 9.0% | 10.5% | 12.5% | 12.5% | 12.0% | 12.2% | 12.3% | 11.7% | |||
| Current Expenditure % GDP, OECD Average (adjusted)2 | 7.2% | 7.5% | 7.7% | 8.0% | 8.0% | 8.1% | 8.0% | 8.0% | 8.3% | 9.0% | 8.8% | 8.8% | 8.9% | 9.0% | N/A | |||
| b Break in series | ||||||||||||||||||
| 1 Sourced from CSO National Accounts data | ||||||||||||||||||
| 2 OECD Average recalculated with revised Irish data and latest GDP estimates | ||||||||||||||||||
| Total Health Care Expenditure | Capital Expenditure | Current Expenditure | |
| 2000 | 6.92175232686613 | 0.521585032507154 | 6.40016729435898 |
| 2001 | 8.53180886877449 | 0.727265464877989 | 7.8045434038965 |
| 2002 | 9.8962979284674 | 0.821661173997352 | 9.07463675447005 |
| 2003 | 10.9502528018978 | 0.748789008511227 | 10.2014637933866 |
| 2004 | 12.1998044899761 | 0.918258199367311 | 11.2815462906088 |
| 2005 | 13.6808559891815 | 0.665283652984776 | 13.0155723361967 |
| 2006 | 14.4378262796077 | 0.538652991834767 | 13.8991732876462 |
| 2007 | 16.2632611719353 | 0.876599739853958 | 15.3866611196776 |
| 2008 | 17.8979575442544 | 0.807171633577503 | 17.0907853163081 |
| 2009 | 18.5089388491149 | 0.670789731730698 | 17.8381484958183 |
| 2010 | 18.1989746319674 | 0.582628664268421 | 17.6163452836763 |
| 2011 | 17.9239470325301 | 0.72941345185203 | 17.194532936106 |
| 2012 | 18.2074987367394 | 0.525779200803428 | 17.681719535936 |
| 2013b | 19.6895086092827 | 0.913727997634946 | 18.7757806116477 |
| 2014 | 20.0422296960448 | 0.893991807747401 | 19.1482378882974 |
| Current Expenditure % GDP, Ireland | Current Expenditure % GNI, Ireland | Current Expenditure % GDP, OECD Average (adjusted) | |
| 2000 | 5.90639285193704 | 6.77653610990299 | 7.2498656357818 |
| 2001 | 6.40278227945534 | 7.4974479364207 | 7.50368637450284 |
| 2002 | 6.67517746345612 | 7.96230302226029 | 7.74853027001789 |
| 2003 | 6.99784867155068 | 8.11527106158494 | 8.00322882478372 |
| 2004 | 7.22361072803041 | 8.36947215054733 | 8.03553801340461 |
| 2005 | 7.65720995434511 | 8.81957251598955 | 8.11261412952721 |
| 2006 | 7.51619500421591 | 8.52924556952742 | 8.04537645047115 |
| 2007 | 7.80834751879056 | 8.98622346017086 | 8.02529920577434 |
| 2008 | 9.11280122652353 | 10.4684462307412 | 8.33150132963032 |
| 2009 | 10.5282051181703 | 12.5245908343467 | 8.99378406656827 |
| 2010 | 10.6022287858329 | 12.4941277358215 | 8.84852565383171 |
| 2011 | 9.88532421300792 | 12.0014049850325 | 8.82638870696625 |
| 2012 | 10.1127967834001 | 12.2194023136764 | 8.91070490271844 |
| 2013b | 10.4519275132338 | 12.2585320482145 | 9.03947231926132 |
| 2014 | 10.1288775685798 | 11.68166687305 |
Reconciliation of HSE Gross Expenditure to Government (HF.1) Funded Current Health Expenditure, 2013 and 2014
Table 8 presents a reconciliation of HSE gross expenditure for 2013 and 2014 (as reported in their Annual Financial Statement) to the HF.1 Government Financing Schemes total reported under the SHA methodology. The purpose of the table is to illustrate the components of Government funded health care expenditure under the SHA methodology and to relate these to national expenditure data.
| Table 8: Reconciliation of HSE Gross Expenditure to Government (HF.1) Funded Current Health Expenditure, 2013 and 2014 | €million | |||
| 2013 | 2014 | |||
| 1 | HSE AFS - Expenditure - Pay and Pensions | 4,871 | 4,795 | |
| 2 | HSE AFS - Expenditure - Non-Pay | 8,771 | 8,425 | |
| 3=1+2 | Total HSE Annual Financial Statement Gross Expenditure | 13,642 | 13,220 | |
| 4 | Exclude Non-Health Care Services | -1,317 | -699 | |
| 5 | Include Non-AFS Gross Expenditure (Mainly Related to Voluntary Agencies) | 538 | 608 | |
| 6=4+5 | Total Adjustments to AFS Gross Expenditure | -780 | -90 | |
| 7=3+6 | Gross Expenditure of HSE included in SHA Expenditure | 12,863 | 13,130 | |
| 8 | Non-Government Funding of HSE | -920 | -1,040 | |
| 9=7+8 | Total HSE HF.1 Funded Health Care Expenditure | 11,943 | 12,090 | |
| Additional Government Health Care Expenditure: | ||||
| 10 | DSP Transfer payments | 659 | 670 | |
| 11 | Treatment Benefits from Social Insurance Fund | 56 | 53 | |
| 12 | Department of Health | 82 | 86 | |
| 13 | Tax Relief on Medical Expenses | 136 | 146 | |
| 14 | Expenditure of Other Government Departments and Agencies | 220 | 220 | |
| 15=10+11+12+13+14 | Total Additional Government HF.1 Funded Expenditure | 1,153 | 1,175 | |
| 16=9+15 | Government (HF.1) Funded Current Health Care Expenditure | 13,096 | 13,265 | |
Introduction
This release is the official publication by CSO of health care expenditure estimates for Ireland according to the international standard of the System of Health Accounts, 2011. The release provides a detailed profile of Irish current health expenditure according to the classifications of the functions of health care (ICHA-HC), health care provision (ICHA-HP), and financing schemes (ICHA-HF). This level of detail is available only from reference year 2013.
International comparisons for this data can be found in the Eurostat data explorer http://ec.europa.eu/eurostat/data/database under the theme:
Population and Social Conditions\Health\Health Care\Health Care Expenditure
and in the OECD statistical database at http://stats.oecd.org/index.aspx?DataSetCode=SHA.
Data Revisions since Previous Publication
A number of revisions have been undertaken since the publication of preliminary 2013 data in December 2013. They are as follows:
Estimate of administration of health financing (HC.7.2) by private health insurance administration agencies (HP.7.3): Upon review and clarification of the guidance on this item, this expenditure is now based on total premiums earned plus premium supplements less claims incurred. In the preliminary data, the estimate was based solely on the administrative costs of the health insurance sector.
Revision of HSE data: The HSE have undertaken some revisions of their data based upon further review of the SHA standard and the services they provide. These have resulted in some changes to the functional classification of their data.
Capital Expenditure: Capital expenditure included in Table 7 is sourced from CSO National Accounts data sources which has been recently updated. The data now correctly includes an estimate of associated “transfer costs” which had been excluded in error in the preliminary publication.
Refund of Medical Expenses by Revenue: The latest estimate provided by Revenue have been included.
Changes in classification of some health care providers: Upon review of the classification of health care providers, some health care providers were reclassified from residential care facilities (HP.2) to ambulatory health care centres (HP.3.4). This mainly affected providers working with people with disabilities and people with addiction problems where a mixture of residential and day care services are provided. The classification is based on the predominance of the services provided.
Overview of the System of Health Accounts
What is the System of Health Accounts?
The System of Health Accounts (SHA) was devised by the Organisation for Economic Co-operation and Development (OECD) and has been adopted for joint reporting of health care expenditure by the OECD, Eurostat and the World Health Organisation. It is an extension of the core National Accounts and consists of a family of interrelated tables for reporting expenditure on health and its financing.
The SHA contains common concepts, definitions, classifications and accounting rules to enable comparability over time and across countries. It provides a basis for uniform reporting by countries with a wide range of different models of organising their national health systems. The SHA also draws a commonly defined boundary around what is health care and distinguishes it from related social care services. This is particularly important for international comparisons given the diversity in health and social care services provision and their funding across Europe and the rest of the world.
The provision of health care and its funding is a complex, multi-dimensional process. The set of core tables in the SHA addresses three basic questions:
1. Where does the money to finance the health system come from? (financing schemes);
2. Who does the money go to? (provider of health care services and goods);
3. What kind of (functionally defined) services are performed and what type of goods are purchased?
Consequently, the SHA is organised around a tri-axial system for the recording of health expenditure, by means of the International Classification for Health Accounts (ICHA), defining;
Summary details of the categories in each classification are given in the section International Classification of Health Accounts and linked documents. A detailed description of the classifications and their application is set out in the manual on the System of Health Accounts which is available at http://www.who.int/nha/sha_revision/en/.
National application of the SHA standard
A detailed review of data sources to allow coding to the SHA classifications has been undertaken over the past two years, and much progress has been made. However this work is ongoing and revisions, especially to the more detailed profile of the data are to be expected.
Specific known data issues at this point include:
All HSE hospital expenditure funded by HSE Mental Health Services has been allocated to HP.1.2 Mental Health Hospitals. This is currently under review and coding may be revised in the future.
Expenditure included under the SHA reporting standard should relate to Final Consumption Expenditure (FCE) only. The expenditure included in this publication includes some items that should not be included in FCE e.g. interest payments. This deviation is not material.
Coverage
Non-Profit Providers: There is ongoing work to improve the coverage of data on expenditure on health care. In particular, further development work on non-profit providers of health care and their non-government funding is ongoing. The funding of health care services from Non-Profit Institutions Serving Households Financing Schemes (HF.2.2) is under represented in the current data and will be revised in future data reporting.
Residents and Non-Residents: Health expenditure should relate only to residents of the Republic of Ireland. Most data sources do not capture information on residence and thus expenditure on non-residents may be included in the data (export of health care services). Expenditure by residents in other countries is also difficult to capture, particularly out-of-pocket expenditure. Some expenditure funded by the HSE and private health insurers has been captured. There is likely to be an underestimate of import of health care services in the Irish SHA data.
Health Care/Social Care Boundary: The project to implement the SHA reporting standard in Ireland reviewed the boundary of health care and social care with the HSE Service Providers. This resulted in a number of services and the associated expenditure, previously categorised as social care, being reclassified to health care. Given that health care and social care are often delivered in the same package of services, it has been hard to separate the two types of services and thus the predominant activity (generally health care) has been used to classify the activity and associated expenditure. This has resulted in the amount of health care being somewhat over-stated in some areas.
International Classification of Health Accounts
For information on mapping of Irish health care financing system to the ICHA-HF classification and data sources used, please see the methodological note Mapping of the Structure of Health Care Financing in Ireland to the Health Care Financing Schemes Classification (ICHA – HF) within the System of Health Accounts at http://www.who.int/health-accounts/methodology/sha2011.pdf.
ICHA – HF: Health Care Financing Schemes
Health care financing schemes are structural components of health care financing systems. They are the main types of financing arrangements through which people obtain health services. These include:
For information on mapping of Irish health care financing system to the ICHA-HF classification and data sources used, please see the methodological note Mapping of the Structure of Health Care Financing in Ireland to the Health Care Financing Schemes Classification (ICHA – HF) within the System of Health Accounts atl http://www.cso.ie/en/surveysandmethodology/nationalaccounts/.
ICHA – HP: Classification of Health Care Providers
The classification of health care providers (ICHA-HP) classifies all organisations that contribute to the provision of health care goods and services, by arranging country-specific provider units into common, internationally applicable categories. The “principal activity” undertaken is the basic criterion for classifying health care providers. These include:
For information on mapping of Irish health care providers to the ICHA-HP classification please see the methodological note Mapping of Health Care Providers in Ireland to the Provider Classification (ICHA – HP) within the System of Health Accounts a http://www.cso.ie/en/surveysandmethodology/nationalaccounts/.
ICHA – HC: Classification of Health Care Functions Explained
The functional classification under the SHA is the key classification for defining the boundary of health care. It groups health care services by purpose. The first five categories relate to goods and services consumed by individuals. These categories comprise
Two other categories relate to the collective consumption of health care, namely:
For information on mapping of Irish health care services to the ICHA-HC classification please and data sources used, see the following methodological note Mapping of Health Care Services in Ireland to the Functions Classification (ICHA – HC) within the System of Health Accounts at http://www.cso.ie/en/surveysandmethodology/nationalaccounts/.
 Hide Background Notes
Scan the QR code below to view this release online or go to
http://www.cso.ie/en/releasesandpublications/er/sha/systemofhealthaccounts2014/
 Show Table 1: Current Health Care Expenditure by Financing Scheme, 2014
 Hide Table 1: Current Health Care Expenditure by Financing Scheme, 2014