
This release has been compiled during the COVID-19 crisis. The results contained in this release reflect some of the economic impacts of the COVID-19 situation. For further information see Information note on the implications of COVID - 19 on the Retail Sales Index March 2022
| Seasonally Adjusted Retail Sales Index - All Businesses | ||
| (Base Year 2015 = 100) | ||
| Volume Index | Value Index | |
| February 2020 | 121.5 | 112.3 |
| March 2021 | 123.3 | 113.4 |
| February 2022 | 126.2 | 118.5 |
| March 2022 | 126.9 | 118.9 |
| % change | ||
| Monthly | 0.6% | 0.3% |
| Annual | 2.9% | 4.8% |
| February 2020 - March 2022 | 4.4% | 5.8% |
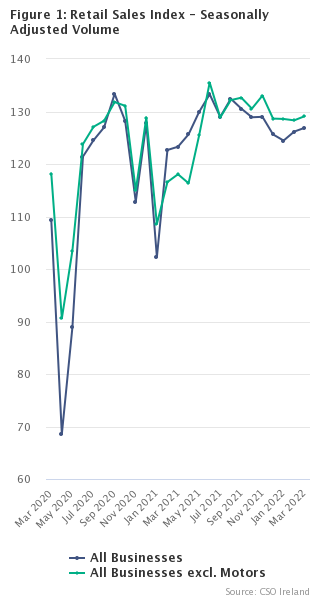
Retail sales increased by 0.6% in March 2022 when compared to February 2022 on a seasonally adjusted basis. On an annual basis, retail volumes were 2.9% higher than in March 2021.
In March 2022, monthly volume increases in sales were recorded in Pharmaceuticals, Medical & Cosmetic Articles (+9.9%), Department Stores (+7.4%), Non-Specialised Stores (incl. Supermarkets) (+2.0%) and Hardware, Paints & Glass (+1.5%). The largest monthly decreases in the volume of sales were in Bars (-19.6%), Electrical Goods (-15.8%) and Food, Beverages & Tobacco (Specialised Stores) (-10.3%). See Table 3 and Figure 2b.
Several sectors showed very large annual increases in the volume of sales, compared with March 2021 when a full lockdown of non-essential retail and services was in force. The volume of sales in Bars rose by 611% compared with March 2021. Bars were closed in March 2021 except where there were ancillary services. Despite the large recovery in March 2022 over the previous year, Bar sales remained 40.4% lower than their pre-COVID-19 level in February 2020. Other sectors showing large annual increases were Clothing & Footwear (+271%) and Department Stores (+81%). In these sectors, the annual increase reflects a recovery from a very low base in March 2021 when the country was in Level 5 lockdown.
Compared to a year ago, the three sectors which showed the largest reduction in volume were Hardware, Paints & Glass (-14.1%), Food, Beverages & Tobacco (Specialised Stores) (-13.4%) and Other Retail Sales (-12.1%). See Tables 3 & 3a and Figures 2a & 3a.
Compared to February 2020 (25 months earlier and pre-COVID-19), the volume of retail sales in March 2022 was 4.4% higher. The highest increases were seen in Clothing & Footwear (+45.4%), Pharmaceuticals, Medical & Cosmetic Articles (+20.6%), Hardware, Paints & Glass (+18.5%) and Furniture & Lighting (+10.4%). The largest decreases in the volume of sales in March 2022 when compared to February 2020 levels, were Bars (-40.4%), Books, Newspapers & Stationery (-15.6%), Fuel (-14.2%) and Motor Trades (-11.9%). See Table 3a and Figure 3a.
When Motor Trades are excluded, the volume of retail sales rose by 0.6% in March over the previous month and increased by 9.4% when compared to March 2021. See Table 2.
The proportion of retail sales transacted online (from Irish registered companies) was 5.0% in March 2022 compared to 4.5% in February 2022, 11.1% in March 2021 and 4.5% in March 2020. See Tables 6 & 7.
The value of retail sales was 0.3% higher in March 2022 than in February 2022. On an annual basis the value of retail sales was 4.8% higher than March 2021. Excluding Motor Trades, the value of retail sales increased by 2.2% in the month and increased by 16.8% on an annual basis. See Tables 1 & 2.
The impact of price change is reflected in the difference between value and volume. In Fuel for example, the value of sales rose by 35.0% in the year to March 2022 while the volume rose by just 1.9% over the same period, the difference due to higher prices compared to the previous year. See Table 3.
Unadjusted indices are available on CSO PxStat.
| Business Sectors | Annual change |
|---|---|
| All Businesses | 2.9 |
| All Businesses excl. Motor Trades | 9.4 |
| All Businesses excl. Motor Trades & Bars | 7.8 |
| Motors & Fuel | -7.6 |
| All Businesses excl. Motor Trades, Fuel & Bars | 5.8 |
| Food Businesses | -9.3 |
| Non-Food (excl. Motor trades, Fuel & Bars) | 24.6 |
| Household Equipment | -3.5 |
| Books, Newspapers, Stationery & Other Goods | -12.2 |
| X-axis label | Monthly change |
|---|---|
| All Businesses | 0.6 |
| All Businesses excl. Motor Trades | 0.6 |
| All Businesses excl. Motor Trades & Bars | 1.2 |
| Motors & Fuel | 0 |
| All Businesses excl. Motor Trades, Fuel & Bars | 1.4 |
| Food Businesses | 0.4 |
| Non-Food (excl. Motor trades, Fuel & Bars) | 4.8 |
| Household Equipment | 0.4 |
| Books, Newspapers, Stationery & Other Goods | -4 |
| X-axis label | March 2021 - March 2022 | February 2020 - March 2022 |
|---|---|---|
| All Businesses | 2.9 | 4.4 |
| All Businesses excl. Motor Trades | 9.4 | 7.6 |
| All Businesses excl. Motor Trades & Bars | 7.8 | 10.7 |
| Motors & Fuel | -7.6 | -4.6 |
| All Businesses excl. Motor Trades, Fuel & Bars | 5.8 | 10.2 |
| Food Businesses | -9.3 | 2 |
| Non-Food (excl. Motor trades, Fuel & Bars) | 24.6 | 26.2 |
| Household Equipment | -3.5 | 12.3 |
| Books, Newspapers, Stationery & Other Goods | -12.2 | 0.3 |
| Table 1 Seasonally Adjusted Indices of Total Retail Sales1 | |||||||||
| Base Year: 2015=100 | |||||||||
| Total Retail Sales for all Businesses Combined | |||||||||
| Period | Value of Sales | Volume of Sales | |||||||
| Index | % change on previous period | Annual % change | Index | % change on previous period | Annual % change | ||||
| 2018 | Year | 109.4 | 2.7 | 2.7 | 116.2 | 3.8 | 3.8 | ||
| 2019 | Year | 110.5 | 1.0 | 1.0 | 118.6 | 2.1 | 2.1 | ||
| 2020 | Year | 105.1 | -4.9 | -4.9 | 115.9 | -2.3 | -2.3 | ||
| 2021 | Year | 117.3 | 11.6 | 11.6 | 126.0 | 8.7 | 8.7 | ||
| 2020 | 1st quarter | 108.4 | -2.7 | -1.9 | 116.9 | -1.7 | -1.1 | ||
| 2nd quarter | 84.0 | -22.5 | -24.5 | 92.9 | -20.5 | -22.0 | |||
| 3rd quarter | 116.2 | 38.3 | 7.1 | 128.3 | 38.0 | 9.5 | |||
| 4th quarter | 110.6 | -4.8 | -0.7 | 122.9 | -4.2 | 3.3 | |||
| 2021 | 1st quarter | 105.9 | -4.3 | -2.3 | 116.1 | -5.6 | -0.7 | ||
| 2nd quarter | 120.3 | 13.6 | 43.3 | 129.6 | 11.7 | 39.5 | |||
| 3rd quarter | 125.5 | 4.3 | 8.0 | 130.6 | 0.8 | 1.8 | |||
| 4th quarter | 122.0 | -2.8 | 10.3 | 127.8 | -2.1 | 4.0 | |||
| 2022 | 1st quarter2 | 118.8 | -2.7 | 12.1 | 125.8 | -1.6 | 8.4 | ||
| 2020 | February | 112.3 | 0.2 | -0.4 | 121.5 | 1.4 | 1.2 | ||
| March | 100.7 | -10.3 | -10.5 | 109.3 | -10.1 | -9.5 | |||
| April | 61.9 | -38.5 | -44.9 | 68.5 | -37.3 | -43.3 | |||
| May | 80.3 | 29.7 | -27.6 | 88.9 | 29.7 | -25.0 | |||
| June | 109.8 | 36.8 | -0.6 | 121.4 | 36.6 | 2.6 | |||
| July | 112.2 | 2.2 | 6.6 | 124.5 | 2.6 | 8.3 | |||
| August | 115.2 | 2.7 | 5.9 | 127.0 | 2.0 | 8.3 | |||
| September | 121.1 | 5.1 | 8.8 | 133.4 | 5.0 | 11.8 | |||
| October | 115.4 | -4.7 | 3.5 | 128.2 | -3.9 | 7.4 | |||
| November | 101.1 | -12.4 | -8.6 | 112.8 | -12.0 | -4.6 | |||
| December | 115.4 | 14.2 | 3.0 | 127.8 | 13.2 | 7.1 | |||
| 2021 | January | 94.1 | -18.4 | -16.0 | 102.3 | -20.0 | -14.7 | ||
| February | 110.2 | 17.1 | -1.9 | 122.7 | 20.0 | 0.9 | |||
| March | 113.4 | 2.9 | 12.6 | 123.3 | 0.5 | 12.8 | |||
| April | 117.0 | 3.2 | 89.0 | 125.6 | 1.9 | 83.3 | |||
| May | 120.0 | 2.6 | 49.5 | 129.9 | 3.4 | 46.2 | |||
| June | 124.0 | 3.4 | 13.0 | 133.3 | 2.6 | 9.8 | |||
| July | 124.0 | 0.0 | 10.5 | 129.0 | -3.2 | 3.6 | |||
| August | 127.0 | 2.4 | 10.3 | 132.4 | 2.7 | 4.3 | |||
| September | 125.5 | -1.2 | 3.6 | 130.5 | -1.4 | -2.1 | |||
| October | 123.8 | -1.3 | 7.3 | 128.9 | -1.3 | 0.6 | |||
| November | 123.0 | -0.7 | 21.7 | 129.0 | 0.1 | 14.3 | |||
| December | 119.2 | -3.1 | 3.3 | 125.6 | -2.6 | -1.7 | |||
| 2022 | January | 118.9 | -0.2 | 26.3 | 124.5 | -0.9 | 21.7 | ||
| February | 118.5 | -0.3 | 7.5 | 126.2 | 1.4 | 2.9 | |||
| March2 | 118.9 | 0.3 | 4.8 | 126.9 | 0.6 | 2.9 | |||
| 1Based on Seasonal Patterns up to March 2022 | |||||||||
| 2Provisional value and volume of sales indices based on early returns from sample retailers | |||||||||
| Table 2 Seasonally Adjusted Indices of Total Retail Sales (Excluding Motor Trades)1 | |||||||||
| Base Year: 2015=100 | |||||||||
| Total Retail Sales for all Businesses Combined (Excl Motor Trades) | |||||||||
| Period | Value of Sales | Volume of Sales | |||||||
| Index | % change on previous period | Annual % change | Index | % change on previous period | Annual % change | ||||
| 2018 | Year | 107.2 | 2.4 | 2.4 | 114.6 | 3.7 | 3.7 | ||
| 2019 | Year | 109.7 | 2.3 | 2.3 | 119.6 | 4.4 | 4.4 | ||
| 2020 | Year | 105.9 | -3.5 | -3.5 | 120.3 | 0.6 | 0.6 | ||
| 2021 | Year | 112.5 | 6.2 | 6.2 | 126.2 | 4.9 | 4.9 | ||
| 2020 | 1st quarter | 108.8 | -0.6 | -0.4 | 119.6 | 0.0 | 1.1 | ||
| 2nd quarter | 93.7 | -13.9 | -15.2 | 106.0 | -11.4 | -11.7 | |||
| 3rd quarter | 112.4 | 20.0 | 2.7 | 129.0 | 21.8 | 7.4 | |||
| 4th quarter | 107.9 | -4.1 | -1.5 | 125.0 | -3.2 | 4.5 | |||
| 2021 | 1st quarter | 100.3 | -7.0 | -7.8 | 114.4 | -8.5 | -4.3 | ||
| 2nd quarter | 111.3 | 11.0 | 18.9 | 125.8 | 9.9 | 18.7 | |||
| 3rd quarter | 116.2 | 4.4 | 3.4 | 131.2 | 4.3 | 1.7 | |||
| 4th quarter | 118.8 | 2.2 | 10.1 | 130.7 | -0.4 | 4.6 | |||
| 2022 | 1st quarter2 | 119.6 | 0.7 | 19.3 | 128.7 | -1.6 | 12.5 | ||
| 2020 | March | 106.2 | -3.0 | -2.9 | 118.2 | -1.5 | -0.3 | ||
| April | 81.5 | -23.2 | -26.4 | 90.6 | -23.4 | -24.7 | |||
| May | 91.2 | 11.8 | -17.6 | 103.5 | 14.2 | -14.0 | |||
| June | 108.3 | 18.8 | -1.3 | 123.8 | 19.6 | 3.6 | |||
| July | 111.5 | 2.9 | 1.8 | 127.1 | 2.7 | 5.7 | |||
| August | 112.3 | 0.7 | 2.4 | 128.2 | 0.9 | 6.8 | |||
| September | 113.6 | 1.1 | 3.8 | 131.8 | 2.8 | 9.6 | |||
| October | 113.4 | -0.1 | 3.6 | 131.1 | -0.5 | 9.6 | |||
| November | 99.2 | -12.6 | -8.9 | 115.0 | -12.3 | -3.2 | |||
| December | 111.1 | 12.0 | 0.9 | 128.9 | 12.1 | 7.0 | |||
| 2021 | January | 95.2 | -14.3 | -14.0 | 108.6 | -15.7 | -10.0 | ||
| February | 101.6 | 6.7 | -7.2 | 116.6 | 7.4 | -2.8 | |||
| March | 104.1 | 2.5 | -2.0 | 118.0 | 1.3 | -0.1 | |||
| April | 102.8 | -1.2 | 26.1 | 116.3 | -1.4 | 28.4 | |||
| May | 110.3 | 7.2 | 21.0 | 125.4 | 7.8 | 21.2 | |||
| June | 120.9 | 9.6 | 11.6 | 135.5 | 8.0 | 9.5 | |||
| July | 114.2 | -5.6 | 2.4 | 128.9 | -4.9 | 1.4 | |||
| August | 116.5 | 2.1 | 3.8 | 132.2 | 2.6 | 3.1 | |||
| September | 118.0 | 1.3 | 3.9 | 132.6 | 0.3 | 0.6 | |||
| October | 118.4 | 0.3 | 4.4 | 130.5 | -1.6 | -0.4 | |||
| November | 121.0 | 2.1 | 22.0 | 133.0 | 1.9 | 15.7 | |||
| December | 117.0 | -3.3 | 5.4 | 128.7 | -3.3 | -0.2 | |||
| 2022 | January | 118.2 | 1.0 | 24.1 | 128.6 | -0.1 | 18.4 | ||
| February | 119.1 | 0.7 | 17.2 | 128.3 | -0.2 | 10.1 | |||
| March2 | 121.6 | 2.2 | 16.8 | 129.1 | 0.6 | 9.4 | |||
| 1Based on Seasonal Patterns up to March 2022 | |||||||||
| 2Provisional value and volume of sales indices based on early returns from sample retailers | |||||||||
| Table 3 Seasonally Adjusted1 Value and Volume Indices of Retail Sales for 13 Retail Businesses2 - Provisional Results March 2022 | |||||||
| Base Year: 2015=100 | |||||||
| March 2022 | |||||||
| Retail Business - NACE REV 2 | Value of Sales | Volume of Sales | |||||
| Index | Monthly % change | Annual % change | Index | Monthly % change | Annual % change | ||
| Motor Trades | 110.3 | -8.8 | 0.8 | 102.7 | -8.0 | -7.8 | |
| Non-Specialised Stores (incl. Supermarkets) | 124.2 | 2.6 | -3.1 | 125.0 | 2.0 | -8.3 | |
| Department Stores | 88.8 | 5.1 | 80.4 | 111.4 | 7.4 | 81.1 | |
| Food, Beverages & Tobacco | 103.3 | -10.1 | -10.9 | 112.3 | -10.3 | -13.4 | |
| Fuel | 122.3 | -0.2 | 35.0 | 88.6 | -9.4 | 1.9 | |
| Pharmaceuticals, Medical & Cosmetic Articles | 124.1 | 6.1 | 10.7 | 150.2 | 9.9 | 13.6 | |
| Clothing, Footwear & Textiles | 143.0 | -1.6 | 267.0 | 169.9 | -0.1 | 270.5 | |
| Furniture & Lighting | 158.8 | 0.6 | 35.1 | 192.9 | -0.4 | 29.1 | |
| Hardware, Paints & Glass | 150.5 | 2.1 | -12.6 | 159.9 | 1.5 | -14.1 | |
| Electrical Goods | 116.6 | -14.5 | -6.8 | 185.2 | -15.8 | -8.7 | |
| Books, Newspapers & Stationery | 92.1 | -3.5 | 28.0 | 84.6 | -2.8 | 20.6 | |
| Other Retail Sales | 127.1 | 4.9 | 20.1 | 111.7 | -3.4 | -12.1 | |
| Bars | 67.4 | -18.6 | 636.4 | 57.6 | -19.6 | 610.7 | |
| All Businesses | 118.9 | 0.3 | 4.8 | 126.9 | 0.6 | 2.9 | |
| Combined Groups | |||||||
| All Businesses excl. Motor Trades | 121.6 | 2.2 | 16.8 | 129.1 | 0.6 | 9.4 | |
| All Businesses excl. Motor Trades & Bars | 126.5 | 2.7 | 13.1 | 135.2 | 1.2 | 7.8 | |
| Motors & Fuel | 125.3 | 0.0 | 3.4 | 112.6 | 0.0 | -7.6 | |
| All Businesses excl. Motor Trades, Fuel & Bars | 126.4 | 3.6 | 12.0 | 137.5 | 1.4 | 5.8 | |
| Food Businesses | 120.5 | 1.2 | -4.8 | 122.0 | 0.4 | -9.3 | |
| Non-Food excl. Motor Trades, Fuel & Bars | 126.2 | 2.6 | 27.5 | 153.8 | 4.8 | 24.6 | |
| Household Equipment | 138.4 | 0.9 | 0.1 | 183.2 | 0.4 | -3.5 | |
| Books, Newspapers, Stationery & Other Goods | 122.3 | 2.3 | 19.8 | 108.9 | -4.0 | -12.2 | |
| 1Based on Seasonal Patterns up to March 2022, individual series are independently adjusted | |||||||
| 2See Background Notes for further detail | |||||||
| Table 3a Percentage changes for Retail Sales for 13 Retail Businesses1, February 2020 (pre-COVID-19) - March 20222 | |||||||
| Base Year: 2015=100 | |||||||
| Value of Sales | Volume of Sales | ||||||
| Retail Business - NACE REV 2 | February 2020 - March 2022 | March 2021 - March 2022 | February 2020 - March 2022 | March 2021 - March 2022 | |||
| (25 months) | (12 months) | (25 months) | (12 months) | ||||
| % | % | % | % | ||||
| Motor Trades | -2.9 | 0.8 | -11.9 | -7.8 | |||
| Non-Specialised Stores (incl. Supermarkets) | 6.4 | -3.1 | 3.1 | -8.3 | |||
| Department Stores | -3.5 | 80.4 | 2.7 | 81.1 | |||
| Food, Beverages & Tobacco | 6.8 | -10.9 | 5.5 | -13.4 | |||
| Fuel | 9.9 | 35.0 | -14.2 | 1.9 | |||
| Pharmaceuticals, Medical & Cosmetic Articles | 12.1 | 10.7 | 20.6 | 13.6 | |||
| Clothing, Footwear & Textiles | 35.7 | 267.0 | 45.4 | 270.5 | |||
| Furniture & Lighting | 13.0 | 35.1 | 10.4 | 29.1 | |||
| Hardware, Paints & Glass | 21.8 | -12.6 | 18.5 | -14.1 | |||
| Electrical Goods | -2.7 | -6.8 | -2.6 | -8.7 | |||
| Books, Newspapers & Stationery | -12.7 | 28.0 | -15.6 | 20.6 | |||
| Other Retail Sales | 31.1 | 20.1 | 5.0 | -12.1 | |||
| Bars | -35.7 | 636.4 | -40.4 | 610.7 | |||
| All Businesses | 5.8 | 4.8 | 4.4 | 2.9 | |||
| Combined Groups | |||||||
| All Businesses excl. Motor Trades | 11.1 | 16.8 | 7.6 | 9.4 | |||
| All Businesses excl. Motor Trades & Bars | 13.8 | 13.1 | 10.7 | 7.8 | |||
| Motors & Fuel | 6.8 | 3.4 | -4.6 | -7.6 | |||
| All Businesses excl. Motor Trades, Fuel & Bars | 13.0 | 12.0 | 10.2 | 5.8 | |||
| Food Businesses | 6.0 | -4.8 | 2.0 | -9.3 | |||
| Non-Food excl. Motor Trades, Fuel & Bars | 17.2 | 27.5 | 26.2 | 24.6 | |||
| Household Equipment | 14.6 | 0.1 | 12.3 | -3.5 | |||
| Books, Newspapers, Stationery & Other Goods | 23.6 | 19.8 | 0.3 | -12.2 | |||
| 1See Background Notes for further detail | |||||||
| 2Based on Seasonal Patterns up to March 2022, individual series are independently adjusted. March 2022 applies to provisional data only | |||||||
| Table 4 Seasonally Adjusted1 Value and Volume Indices of Retail Sales for 13 Retail Businesses2 - Final Results February 2022 | |||||||
| Base Year: 2015=100 | |||||||
| February 2022 | |||||||
| Retail Business - NACE REV 2 | Value of Sales | Volume of Sales | |||||
| Index | Monthly % change | Annual % change | Index | Monthly % change | Annual % change | ||
| Motor Trades | 120.8 | -0.6 | 1.4 | 111.6 | 0.0 | -6.8 | |
| Non-Specialised Stores (incl. Supermarkets) | 121.1 | -1.8 | -5.6 | 122.6 | -2.5 | -10.1 | |
| Department Stores | 84.5 | -5.3 | 90.2 | 103.7 | -5.3 | 87.4 | |
| Food, Beverages & Tobacco | 114.9 | 1.3 | -1.0 | 125.2 | 0.8 | -4.6 | |
| Fuel | 122.5 | 2.2 | 47.1 | 97.8 | -0.2 | 18.7 | |
| Pharmaceuticals, Medical & Cosmetic Articles | 117.0 | -1.4 | 4.9 | 136.7 | 1.6 | 5.0 | |
| Clothing, Footwear & Textiles | 145.4 | 0.0 | 290.8 | 170.0 | -0.1 | 284.9 | |
| Furniture & Lighting | 157.9 | -1.8 | 41.8 | 193.6 | -0.8 | 36.4 | |
| Hardware, Paints & Glass | 147.4 | 6.6 | -3.1 | 157.6 | 11.0 | -7.8 | |
| Electrical Goods | 136.3 | 1.8 | -12.0 | 219.8 | 4.4 | -14.1 | |
| Books, Newspapers & Stationery | 95.4 | -1.1 | 85.0 | 87.0 | -2.4 | 75.2 | |
| Other Retail Sales | 121.1 | 16.0 | 15.8 | 115.6 | 1.7 | -7.0 | |
| Bars | 82.8 | 22.8 | 798.7 | 71.7 | 23.2 | 776.3 | |
| All Businesses | 118.5 | -0.3 | 7.5 | 126.2 | 1.4 | 2.9 | |
| Combined Groups | |||||||
| All Businesses excl. Motor Trades | 119.1 | 0.7 | 17.2 | 128.3 | -0.2 | 10.1 | |
| All Businesses excl. Motor Trades & Bars | 123.2 | 0.9 | 12.8 | 133.6 | 0.8 | 7.4 | |
| Motors & Fuel | 125.3 | 2.0 | 2.8 | 112.6 | 2.0 | -6.4 | |
| All Businesses excl. Motor Trades, Fuel & Bars | 121.9 | 1.1 | 9.6 | 135.6 | 0.5 | 5.4 | |
| Food Businesses | 119.1 | -2.0 | -5.0 | 121.6 | -3.5 | -9.5 | |
| Non-Food (excl. Motor Trades, Fuel & Bars) | 123.0 | 1.9 | 30.7 | 146.8 | 1.3 | 29.7 | |
| Household Equipment | 137.1 | 0.5 | 0.1 | 182.6 | -0.5 | -4.6 | |
| Books, Newspapers, Stationery & Other Goods | 119.6 | 16.3 | 18.8 | 113.4 | 3.3 | -6.6 | |
| 1Based on Seasonal Patterns up to March 2022, individual series are independently adjusted | |||||||
| 2See Background Notes for further detail | |||||||
| Table 5 Seasonally Adjusted1 Value and Volume Indices of Retail Sales for 13 Retail Businesses2 - 3 Monthly Provisional Estimates | |||||||
| (Provisional Estimates) | Base Year: 2015=100 | ||||||
| January 2022 - March 2022 | |||||||
| Retail Business - NACE REV 2 | Value of Sales | Volume of Sales | |||||
| Index | % change on previous period | Annual % change | Index | % change on previous period | Annual % change | ||
| Motor Trades | 117.6 | -9.7 | 7.6 | 108.7 | -11.9 | -1.2 | |
| Non-Specialised Stores (incl. Supermarkets) | 122.9 | -3.3 | -3.5 | 124.5 | -5.5 | -8.3 | |
| Department Stores | 87.5 | 3.1 | 85.4 | 108.2 | 2.1 | 85.9 | |
| Food, Beverages & Tobacco | 110.5 | -4.3 | -4.7 | 120.6 | -6.5 | -7.7 | |
| Fuel | 121.6 | 1.8 | 44.9 | 94.8 | -4.0 | 14.8 | |
| Pharmaceuticals, Medical & Cosmetic Articles | 119.9 | -9.8 | 9.1 | 140.5 | -7.6 | 10.0 | |
| Clothing, Footwear & Textiles | 144.6 | 21.5 | 299.4 | 170.0 | 20.1 | 300.9 | |
| Furniture & Lighting | 159.1 | 3.6 | 49.2 | 193.9 | 1.3 | 43.4 | |
| Hardware, Paints & Glass | 145.4 | -1.3 | -2.7 | 153.2 | -1.8 | -6.8 | |
| Electrical Goods | 128.9 | -2.2 | -5.1 | 205.2 | -3.6 | -7.3 | |
| Books, Newspapers & Stationery | 94.6 | -3.9 | 66.8 | 86.9 | -7.0 | 58.0 | |
| Other Retail Sales | 117.5 | 12.7 | 14.2 | 113.7 | -1.1 | -8.2 | |
| Bars | 72.5 | -10.9 | 647.4 | 62.5 | -16.1 | 626.7 | |
| All Businesses | 118.8 | -2.7 | 12.1 | 125.8 | -1.6 | 8.4 | |
| Combined Groups | |||||||
| All Businesses excl. Motor Trades | 119.6 | 0.7 | 19.3 | 128.7 | -1.6 | 12.5 | |
| All Businesses excl. Motor Trades & Bars | 123.9 | 1.7 | 15.4 | 133.8 | -0.8 | 9.9 | |
| Motors & Fuel | 124.5 | -2.7 | 11.4 | 111.9 | -6.3 | 0.6 | |
| All Businesses excl. Motor Trades, Fuel & Bars | 123.0 | 0.9 | 12.9 | 136.0 | -1.0 | 8.1 | |
| Food Businesses | 120.4 | -4.4 | -4.1 | 123.2 | -6.1 | -8.3 | |
| Non-Food (excl. Motor Trades, Fuel & Bars) | 123.3 | 4.3 | 33.3 | 148.5 | 4.7 | 31.4 | |
| Household Equipment | 137.3 | -5.1 | 5.2 | 183.1 | -7.9 | 0.7 | |
| Books, Newspapers, Stationery & Other Goods | 114.9 | 11.1 | 19.7 | 110.7 | -0.4 | -5.0 | |
| 1Based on Seasonal Patterns up to March 2022, individual series are independently adjusted | |||||||
| 2See Background Notes for further detail | |||||||
| Table 6 Percentage of Turnover generated by Online Sales1 for Total Retail Sales | |||
| Total Retail Sales for all Businesses Combined | |||
| Period | % sales online | ||
| 2019 | Year | 3.3 | |
| 2020 | Year | 7.0 | |
| 2021 | Year | 7.5 | |
| 2019 | 1st quarter | 2.9 | |
| 2nd quarter | 3.1 | ||
| 3rd quarter | 3.3 | ||
| 4th quarter | 3.8 | ||
| 2020 | 1st quarter | 3.7 | |
| 2nd quarter | 11.7 | ||
| 3rd quarter | 4.5 | ||
| 4th quarter | 8.1 | ||
| 2021 | 1st quarter | 11.4 | |
| 2nd quarter | 6.9 | ||
| 3rd quarter | 5.0 | ||
| 4th quarter | 7.1 | ||
| 2022 | 1st quarter2 | 5.0 | |
| 2019 | January | 2.8 | |
| February | 3.0 | ||
| March | 3.0 | ||
| April | 3.0 | ||
| May | 2.9 | ||
| June | 3.4 | ||
| July | 3.4 | ||
| August | 3.2 | ||
| September | 3.2 | ||
| October | 3.4 | ||
| November | 4.0 | ||
| December | 4.1 | ||
| 2020 | January | 3.2 | |
| February | 3.5 | ||
| March | 4.5 | ||
| April | 15.3 | ||
| May | 13.2 | ||
| June | 6.7 | ||
| July | 4.6 | ||
| August | 4.5 | ||
| September | 4.5 | ||
| October | 6.0 | ||
| November | 12.4 | ||
| December | 5.8 | ||
| 2021 | January | 11.0 | |
| February | 11.8 | ||
| March | 11.1 | ||
| April | 10.1 | ||
| May | 5.6 | ||
| June | 4.9 | ||
| July | 4.8 | ||
| August | 4.8 | ||
| September | 4.6 | ||
| October | 5.5 | ||
| November | 6.0 | ||
| December | 9.7 | ||
| 2022 | January | 5.6 | |
| February | 4.5 | ||
| March2 | 5.0 | ||
| 1Only enterprises registered in Ireland are included | |||
| 2Provisional subject to revision | |||
| Table 7 Percentage of Turnover generated by Online Sales for 13 Retail Businesses1 - Provisional Results March 20222 | |||||
| March 2021 | February 2022 | March 2022 | |||
| Retail Business - NACE REV 2 | Sales Online | Sales Online | Sales Online | ||
| % | % | % | |||
| Motor Trades | 3.4 | 1.3 | 2.5 | ||
| Non-Specialised Stores (incl. Supermarkets) | 2.9 | 2.7 | 2.7 | ||
| Department Stores | 28.5 | 8.3 | 9.4 | ||
| Food, Beverages & Tobacco | 2.5 | 7.0 | 8.7 | ||
| Fuel | * | * | * | ||
| Pharmaceuticals, Medical & Cosmetic Articles | * | * | * | ||
| Clothing, Footwear & Textiles | 65.8 | 10.1 | 10.6 | ||
| Furniture & Lighting | * | * | * | ||
| Hardware, Paints & Glass | * | * | * | ||
| Electrical Goods | 21.4 | 8.6 | 10.4 | ||
| Books, Newspapers & Stationery | * | * | * | ||
| Other Retail Sales | 11.8 | 6.4 | 6.4 | ||
| Online or Mail Order | 91.1 | 68.4 | 62.8 | ||
| Bars | * | * | * | ||
| All Businesses | 11.1 | 4.5 | 5.0 | ||
| Combined Groups | |||||
| All Businesses excl. Motor Trades | 14.2 | 5.9 | 6.0 | ||
| All Businesses excl. Motor Trades, Fuel & Bars | 16.1 | 6.5 | 6.6 | ||
| Food Businesses | 2.8 | 3.2 | 3.4 | ||
| Non-Food (excl. Motor Trades, Fuel & Bars) | 26.9 | 9.2 | 9.2 | ||
| Household Equipment | 16.8 | 6.0 | 6.9 | ||
| Books, Newspapers, Stationery, Other Goods and Online | 22.5 | 14.4 | 14.1 | ||
| 1See Background Notes for further detail | |||||
| 2Provisional based on early returns from sample retailers | |||||
| *Confidential | |||||
An updated Retail Sales Index (RSI) has been introduced in the January 2018 release. The underlying methodology remains unchanged. The index is primarily intended to measure short-term trends. For long term analysis, allowance must be made for the fact that the series does not reflect changes in retail structures between updates.
The February period covers the 4 weeks from 30/01/22 to 26/02/22 and the March period covers the 5 weeks from 27/02/22 to 02/04/22.
This set of monthly retail sales indices has been compiled with reference to base year 2015=100. The underlying structural weighting system is mainly based on the 2015 Annual Services Inquiry. Weights are updated from year to year using ratios of average weekly turnover by size class within business type.
The Retail Sales Index covers, on a matched sample basis, the retail sales of retail businesses, wholesale businesses with sizeable retailing activity, and the separate sales establishments of non-distribution enterprises. Excluded from the index coverage are the direct retail sales from non-distribution establishments together with the incidental retail sales of wholesale businesses. Also excluded are sales by hawkers, street stalls, and other retailing activities not conducted from permanent business premises. The RSI does include internet/online sales of enterprises which have a presence in Ireland, but these sales are included under the primary activity of the enterprise, e.g. online grocery sales are included in Non-Specialised Stores. The statistical unit used for reporting sales figures in this inquiry is the enterprise (i.e. complete business covering all branches). Online retailers not registered in Ireland but selling to Irish Residents are not within the scope of the Irish RSI.
The business categories are based mainly on the Statistical Classification of Economic Activities in the European Community (NACE Rev. 2). The index system is structured on the retailing enterprises covered in the 2015 Annual Services Inquiry classified by 13 retail business categories and four turnover (excluding VAT) ranges. The following NACE Rev.2 categories apply:
For a full NACE Rev2 breakdown of the above categories see attached link to the Retail Sales Index Methodological Documents.
The value indices are calculated by updating the aggregate 2015 retail turnover (including VAT) of these enterprises in these cells using the monthly retail sales data provided by the enterprise respondent panel from 2015 onwards.
The compilation of the index for a current month is based on the percentage change in average weekly sales in these cells over the corresponding monthly period of the previous year. The monthly volume indices are calculated by deflating the seasonally unadjusted value indices by specially constructed retail price indices derived from the Consumer Price Index (CPI). A copy of the Retail Sales Index methodology is available on our website (www.cso.ie).
All Retail Sales “unadjusted” series are trading day adjusted as they are based on either a standardised four or five-week reporting period (see reference period note above). Seasonal adjustment is conducted using the direct seasonal adjustment approach. Under this approach each individual series is independently adjusted, e.g. aggregate series are adjusted without reference to the component series. A consequence of the direct seasonal adjustment is that there can be a loss of additivity in the series. Each individual seasonally adjusted series is calculated based on unadjusted data spanning from January 2010 to the current period.
The adjustments are completed by applying the X-13-ARIMA model, developed by the U.S. Census Bureau, to the unadjusted data. For additional information on the use of X-13ARIMA-SEATS see (Findley, D.F., B.C. Monsell, W.R. Bell, M.C. Otto, and B. Chen (1998), “New Capabilities and Methods of the X-12-Arima Seasonal Adjustment Program”, Journal of Business & Economic Statistics, 16, pp. 127-177.) and https://www.census.gov/data/software/x13as/winx13.html/.
This methodology estimates seasonal factors while also taking into consideration factors that impact on the quality of the seasonal adjustment, such as:
The rebasing of the series is in line with EU recommendations to update the base reference periods at regular five-year intervals. This new series replaces the existing series to base year 2010 as 100.
The difference in the new rebased RSI series is the use of new cell and sector baseweights taken from the ASI 2015. The existing cell structure/breakdown was maintained in this series.
The new baseweights are updated each month using changes to respondents’ monthly turnover. The rebase also includes the reclassification of enterprises based on their current product profile.
Detail of the methodology used in the RSI are available on Methodological Documents page.
Online Sales
The collection of data for online turnover began in November 2018. Enterprises in the sample provide the value of their online turnover for the reporting period. As for all of the survey only Enterprises registered in Ireland are included. From the Annual Services Inquiry (2017) the Online and Mail Order Sector (G4791) registered in Ireland is estimated at 1.0% of all Retail Businesses. A fixed base weight is used from the Annual Services Inquiry (2017).
Reference
A detailed description of the Retail Sales Index is available on the Retail Sales Index page. Retrospective details for the current and previous series are also available on the CSO website.
 Hide Background Notes
Scan the QR code below to view this release online or go to
http://www.cso.ie/en/releasesandpublications/er/rsi/retailsalesindexmarch2022/
 Show Table 1 Seasonally Adjusted Indices of Total Retail Sales
 Hide Table 1 Seasonally Adjusted Indices of Total Retail Sales