
| Road freight activity, Quarter 2 2017-2019 | ||||
| Q2 2017 | Q2 20181 | Q2 2019 | % change Q2 2018-2019 | |
| Tonne-km (million) | 2,962 | 3,114 | 3,136 | 0.7% |
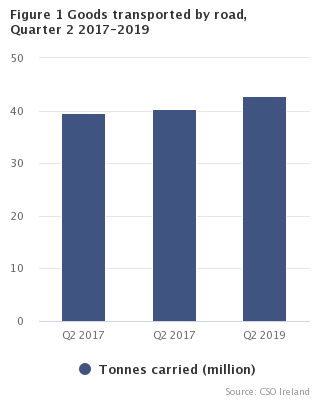
| Tonnes carried (thousand) | 39,611 | 40,325 | 42,782 | 6.1% |
| Vehicle kilometres (million) | 412 | 420 | 450 | 7.1% |
| Average number of vehicles (number) | 107,704 | 117,151 | 127,570 | 8.9% |
| Laden journeys (thousand) | 3,353 | 3,510 | 3,966 | 13.0% |
| 1 Minor revisions to quarter 2 data in 2018 | ||||
| Type of work | Tonnes carried (million) |
|---|---|
| Import/export work | 3.661 |
| Carriage of livestock | 0.427 |
| Carriage of other farm produce from farms | 2.256 |
| Carriage of fertilisers, feeding stuffs, etc. to farms | 2.199 |
| Delivery of goods to road works or building sites | 15.766 |
| Delivery of goods to retail outlets | 3.931 |
| Delivery of goods to wholesalers | 3.474 |
| Delivery of materials and fuels to factories | 4.961 |
| Delivery of goods to households | 1.273 |
| Other work | 4.835 |
| Table 1: Road freight activity by business of owner, Quarter 2 2017-2019 | |||||||||||
| Q2 2017 | Q2 20181 | Q2 2019 | |||||||||
| Transport | Other | Total | Transport | Other | Total | Transport | Other | Total | |||
| Tonne-km (million) | 2,117 | 845 | 2,962 | 2,208 | 906 | 3,114 | 2,216 | 920 | 3,136 | ||
| Tonnes carried (thousand) | 22,685 | 16,926 | 39,611 | 22,169 | 18,156 | 40,325 | 23,922 | 18,861 | 42,782 | ||
| Vehicle kilometres (million) | 204 | 208 | 412 | 210 | 210 | 420 | 216 | 234 | 450 | ||
| Laden journeys (thousand) | 1,319 | 2,033 | 3,353 | 1,324 | 2,185 | 3,510 | 1,423 | 2,543 | 3,966 | ||
| 1 Minor revisions to quarter 2 data in 2018 | |||||||||||
| Table 2: Road freight activity by commodity group carried, Quarter 2 2019 | |||
| Commodity | Tonne-km | Tonnes carried | Vehicle kilometres |
| million | thousand | million | |
| Products of agriculture, forestry and fishing | 358 | 3,788 | 26 |
| Coal and natural gas | 17 | 202 | 1 |
| Quarry products, metal ores and peat | 353 | 10,862 | 18 |
| Foodstuffs | 745 | 6,885 | 76 |
| Textiles and leather | 26 | 216 | 4 |
| Wood, pulp and paper | 148 | 1,585 | 13 |
| Coke and refined petroleum products | 161 | 2,283 | 11 |
| Chemicals and plastics | 136 | 1,381 | 13 |
| Other non-metallic mineral products | 301 | 7,443 | 21 |
| Metal products (except machinery and equipment) | 61 | 548 | 5 |
| Machinery and equipment | 58 | 608 | 8 |
| Furniture and other manufactured goods | 58 | 514 | 13 |
| Secondary raw materials and waste | 98 | 1,713 | 11 |
| Other goods | 617 | 4,756 | 229 |
| Total | 3,136 | 42,782 | 450 |
| Table 3: Road freight activity by main type of work, Quarter 2 2019 | |||
| Tonne-km | Tonnes carried | Vehicle kilometres | |
| million | thousand | million | |
| Import/export work | 731 | 3,661 | 54 |
| Carriage of livestock | 57 | 427 | 9 |
| Carriage of other farm produce from farms | 120 | 2,256 | 10 |
| Carriage of fertilisers, feeding stuffs, etc. to farms | 149 | 2,199 | 13 |
| Delivery of goods to road works or building sites | 539 | 15,766 | 74 |
| Delivery of goods to retail outlets | 381 | 3,931 | 117 |
| Delivery of goods to wholesalers | 368 | 3,474 | 55 |
| Delivery of materials and fuels to factories | 423 | 4,961 | 43 |
| Delivery of goods to households | 75 | 1,273 | 28 |
| Other work | 294 | 4,835 | 47 |
| Total | 3,136 | 42,782 | 450 |
| Table 4: Domestic transport activity1 classified by region of origin, Quarter 2 2019 | ||||
| Region | Tonne-km | Tonnes carried | ||
| million | % | thousand | % | |
| Northern and Western | 439 | 17.6% | 6,736 | 16.6% |
| Border | 216 | 8.6% | 3,735 | 9.2% |
| West | 222 | 8.9% | 3,001 | 7.4% |
| Southern | 941 | 37.6% | 14,931 | 36.7% |
| Mid-West | 245 | 9.8% | 4,497 | 11.1% |
| South-East | 261 | 10.4% | 3,330 | 8.2% |
| South-West | 435 | 17.4% | 7,104 | 17.5% |
| Eastern and Midland | 1,121 | 44.8% | 19,006 | 46.7% |
| Dublin | 611 | 24.4% | 9,838 | 24.2% |
| Mid-East | 344 | 13.8% | 6,782 | 16.7% |
| Midland | 166 | 6.6% | 2,387 | 5.9% |
| Total | 2,500 | 100.0 | 40,673 | 100.0 |
| 1Domestic transport activity excludes Northern Ireland and other countries | ||||
| Table 5: Road freight activity by country of origin, Quarter 2 2019 | |||||
| Country of destination | |||||
| Country of origin | Ireland | United Kingdom | Other EU countries | Non-EU countries | Total |
| Tonne-km (millions) | |||||
| Ireland | 2,500 | 163 | 89 | 4 | 2,756 |
| United Kingdom | 95 | 47 | 20 | 0 | 163 |
| Other EU countries | 76 | 46 | 75 | 0 | 197 |
| Non-EU countries | 9 | 0 | 10 | 0 | 20 |
| Total | 2,681 | 257 | 195 | 4 | 3,136 |
| Tonnes carried (thousands) | |||||
| Ireland | 40,673 | 1,011 | 86 | 3 | 41,773 |
| United Kingdom | 437 | 212 | 36 | 0 | 685 |
| Other EU countries | 75 | 65 | 176 | 0 | 316 |
| Non-EU countries | 5 | 0 | 4 | 0 | 9 |
| Total | 41,189 | 1,288 | 301 | 3 | 42,782 |
This report contains the results of the "National Survey of Transport of Goods by Road" which is conducted on a weekly basis throughout the year.
This is a statutory survey conducted under the Statistics (Road Freight) Order, 2016 (SI No 146 of 2016) to meet Ireland’s EU requirements under Council Regulation (EC) 70/2012 on statistical returns in respect of the carriage of goods by road.
Quarterly results cover a survey period of 13 weeks for each quarter. Irish registered vehicles that come within the scope of the survey must meet the following criteria:
a. belong to the motor taxation class ‘Goods Vehicles’
b. have a valid motor tax disk during the relevant survey week. However, in practice, as the survey sample was selected several weeks before the survey week, vehicles where the motor tax had expired no more than three months previously were also included in the scope.
c. have an unladen weight of two tonnes and over
d. have a vehicular body type appropriate for carrying freight.
No other vehicles are covered. In particular this means that vehicles in other motor taxation classes such as agricultural tractors, general haulage tractors, dumpers and exempt vehicles (i.e. vehicles exempt from liability to pay road tax which includes state owned, diplomatic, fire services or disabled drivers) are not included in the survey.
All activity of goods vehicles within the scope of the survey engaged in the carriage of goods on the public road, either on own account or for hire or reward, are covered. Excluded, therefore, is activity such as site work off the public road or work of a mainly service nature (e.g. carriage of personnel to or from places of work).
The sampling frame for the Survey comes from the Department of Transport, Tourism and Sport’s database on vehicles taxed as goods vehicles.
The sampling frame/register is updated every eight weeks during the year with information from the Department regarding vehicles:
1. being registered for the first time
2. having their motor taxation class changed
3. being formally scrapped
4. having their registered owner changed.
The information required of each vehicle on the register for survey purposes is as follows:
a) year of manufacture of the vehicle
b) date of first registration of the vehicle
c) an indication as to whether the vehicle has been taxed for the carriage of goods on own account or for hire or reward
d) the unladen weight of the vehicle
e) name and address of the person on whose name the vehicle was most recently taxed (referred to as the owner of the vehicle in the following paragraphs).
The results are published on a quarterly and annual basis.
Information is collected in respect of one week’s transport activity for a random sample of goods vehicles. Every week a sample of vehicles is selected from the register. A survey questionnaire is then issued to the registered owners of these vehicles by post, seeking information on the vehicle and an account of the vehicle’s activity during that week. For the purposes of sample selection, vehicles are divided into 20 strata. These strata were created on the basis of four criteria:
Two basic categories of journey are distinguished – split delivery/collection journeys and end-to-end journeys.
National transport is the carriage of goods by road by Irish registered goods vehicles between two places (a place of loading/embarkment and a place of unloading/disembarkment) both of which are located in the Republic of Ireland.
The regional classification in this release is based on the NUTS (Nomenclature of Territorial Units) classification used by Eurostat. Until Q4 2017, the NUTS3 regions corresponded to the eight Regional Authorities established under the Local Government Act, 1991 (Regional Authorities) (Establishment) Order, 1993, which came into operation on 1 January 1994 while the NUTS2 regions, which were proposed by Government and agreed by Eurostat in 1999, were groupings of those historic NUTS3 regions.
However, the NUTS3 boundaries were amended on 21st of November 2016 under Regulation (EC) No. 2066/2016 and have come into force from Q1 2018. These new groupings are reflected in the Road Freight Transport Survey results from Q1 2018 onwards. The changes resulting from the amendment are that County Louth has moved from the Border to the Mid-East and what was formerly South Tipperary has moved from the South-East to the Mid-West, resulting in the new NUTS2 and NUTS3 regions:
| Northern & Western NUTS2 Region | Southern NUTS2 Region | Eastern & Midland NUTS2 Region | |||
| Border | Cavan | Mid-West | Clare | Dublin | Dublin City |
| Donegal | Limerick City & County | Dun Laoghaire-Rathdown | |||
| Leitrim | Tipperary | Fingal | |||
| Monaghan | South Dublin | ||||
| Sligo | |||||
| South-East | Carlow | Mid-East | Kildare | ||
| West | Galway City | Kilkenny | Meath | ||
| Galway County | Waterford City & County | Wicklow | |||
| Mayo | Wexford | Louth | |||
| Roscommon | |||||
| Midland | Laois | ||||
| South-West | Cork City | Longford | |||
| Cork County | Offaly | ||||
| Kerry | Westmeath | ||||
 Hide Background Notes
Scan the QR code below to view this release online or go to
http://www.cso.ie/en/releasesandpublications/er/rfts/roadfreighttransportsurveyquarter22019/
 Show Table 1: Road freight activity by business of owner, Quarter 2 2017-2019
 Hide Table 1: Road freight activity by business of owner, Quarter 2 2017-2019