
| Indicator | Q2 10 | Q2 11 | Q2 12 | Q2 13 | Q2 14 | Q2 15 | Q2 16 | Change Q2 15 to Q2 16 |
| Proportion of persons aged 0-17 living in jobless households | 19.4% | 20.1% | 20.1% | 18.0% | 16.2% | 14.9% | 13.3% | - 1.6 percentage points |
| Proportion of persons aged 18-59 living in jobless households | 14.3% | 15.2% | 15.9% | 14.9% | 13.7% | 12.4% | 11.8% | - 0.6 percentage points |
| Proportion of all persons aged 0-59 living in jobless households | 15.9% | 16.7% | 17.2% | 15.8% | 14.5% | 13.2% | 12.3% | - 0.9 percentage points |
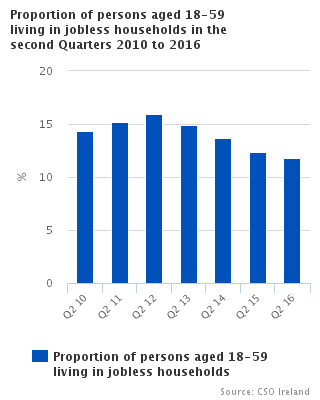
The proportion of persons aged 0-59 living in jobless households in the second quarter of 2016 was 12.3%. This compares with 13.2% in the second quarter of 2015. The proportion of persons aged 18-59 living in jobless households in Q2 2016 was 11.8% compared with 12.4% in Q2 2015. The proportion of persons aged 0-17 living in jobless households in Q2 2016 was 13.3% compared with 14.9% in Q2 2015.
In Q2 2016, the Mid-East region had the lowest proportion of persons aged 0-59 living in jobless households (10.2%), while the Border region had the highest proportion (14.1%). In Q2 2010 the Mid-East region again had the lowest proportion of persons aged 0-59 living in jobless households (13.1%) while the South-East region had the highest proportion (19.9%). See Table 1.
Household Composition
One and two person households together accounted for more than half (52.5%) of all the households in the State in Q2 2016, while 3.8% of households contained six or more persons. See Tables 2 and 3.
The proportion of households in the State that did not contain a person aged less than 18 in Q2 2016 was 63.6%. The Mid-East region had the lowest proportion of households without a person aged less than 18 at 56.8%, while the Dublin region had the highest proportion of households without a person aged less than 18 at 66.2%. See Tables 4 and 5.
Household Composition and Family Unit Type
There were 412,600 single person households in the State in the second quarter of 2016. The number of households in which the only family unit was a couple without children was 370,800, while the number of households where the only family unit was a couple with children was 644,200. In addition, there were 195,300 households where the only family unit was a lone parent family unit. See Table 6.
Family Units and ILO Status
There were 2,318,600 adult members of family units in the second quarter of 2016 of whom 1,436,100 were classified as employed, 97,200 as unemployed and 785,400 as not in the labour force. See Tables 7 and 8.
Family Units and Employment Rate
The employment rate for all persons aged 15-64 was 64.7% in Q2 2016. This compares with 63.1% in Q2 2015 and 60.0% in Q2 2010. In Q2 2016, the employment rate of lone parents (aged 15-64) was 56.4%. This compares with 73.0% for the adult members of couples without children and 74.4% for the adult members of couples with children. See Tables 9 and 10.
The employment rate of lone parents (aged 15-64) whose youngest child was aged 0 to 5 years was 46.0% in Q2 2016 compared to 57.2% where the youngest child was aged 6 to 11 and 63.4% where the youngest child was aged 12 to 17. See Tables 9 and 10.
Family Units and Unemployment Rate
The unemployment rate for all persons aged 15-74 was 8.6% in Q2 2016. The adult members (aged 15-74) of couples without children had a 5.2% unemployment rate, while the adult members of couples with children had an unemployment rate of 6.3% in Q2 2016. The unemployment rate of lone parents was 10.8% in the same period. See Tables 11 and 12.
Family Units and Participation Rate
The participation rates for all males and females aged 15 and over in Q2 2016 were 67.8% and 53.6% respectively. The participation rate of males in couples with children was 87.8% in Q2 2016 while the corresponding participation rate for females was 64.4%. The participation rate of the adult members of couples without children was 52.3% in Q2 2016, compared to a participation rate of 76.2% for the adult members of couples with children and 54.1% for lone parents. See Tables 13 and 14.
Family Units and Duration of Unemployment
There were 11,200 adult members of couples without children classified as long-term unemployed in Q2 2016, while there were 34,400 adult members of couples with children classified as long-term unemployed in the same period. In addition, there were 7,500 lone parents classified as long-term unemployed in Q2 2016. In total, there were 53,100 adult members of family units classified as long-term unemployed in Q2 2016, compared with 70,500 in Q2 2015 and 82,600 in Q2 2014. See Table 15.
| Table 1 Proportion of persons in jobless households by NUTS2 and NUTS3 regions, age and gender | ||||||||||
| % | ||||||||||
| Region/Jobless households | Q2 10 | Q2 11 | Q2 12 | Q2 13 | Q2 14 | Q2 15 | Q2 16 | |||
| Border, Midland and Western | ||||||||||
| Proportion of persons aged 0-17 living in jobless household | 19.4 | 21.6 | 21.1 | 19.5 | 18.2 | 15.3 | 13.4 | |||
| Proportion of male persons aged 18-59 living in jobless household | 15.1 | 17.2 | 18.9 | 16.7 | 16.3 | 12.9 | 12.8 | |||
| Proportion of female persons aged 18-59 living in jobless household | 16.2 | 17.7 | 19.5 | 17.0 | 17.1 | 14.7 | 13.8 | |||
| Proportion of persons aged 18-59 living in jobless households | 15.7 | 17.5 | 19.2 | 16.8 | 16.7 | 13.8 | 13.3 | |||
| Proportion of all persons aged 0-59 living in jobless households | 16.9 | 18.8 | 19.8 | 17.7 | 17.2 | 14.3 | 13.3 | |||
| Border | ||||||||||
| Proportion of persons aged 0-17 living in jobless household | 19.2 | 23.4 | 24.6 | 23.1 | 19.2 | 15.8 | 13.3 | |||
| Proportion of male persons aged 18-59 living in jobless household | 16.2 | 19.3 | 21.7 | 19.0 | 18.8 | 13.5 | 13.8 | |||
| Proportion of female persons aged 18-59 living in jobless household | 17.3 | 19.7 | 22.1 | 20.1 | 18.1 | 15.6 | 15.1 | |||
| Proportion of persons aged 18-59 living in jobless households | 16.8 | 19.5 | 21.9 | 19.5 | 18.5 | 14.6 | 14.5 | |||
| Proportion of all persons aged 0-59 living in jobless households | 17.5 | 20.7 | 22.8 | 20.7 | 18.7 | 15.0 | 14.1 | |||
| Midland | ||||||||||
| Proportion of persons aged 0-17 living in jobless household | 24.0 | 23.9 | 21.8 | 18.5 | 17.4 | 15.4 | 13.5 | |||
| Proportion of male persons aged 18-59 living in jobless household | 15.7 | 16.8 | 19.6 | 17.9 | 15.7 | 15.0 | 13.4 | |||
| Proportion of female persons aged 18-59 living in jobless household | 18.8 | 18.4 | 21.1 | 16.1 | 17.2 | 15.1 | 13.9 | |||
| Proportion of persons aged 18-59 living in jobless households | 17.2 | 17.6 | 20.3 | 17.0 | 16.4 | 15.0 | 13.7 | |||
| Proportion of all persons aged 0-59 living in jobless households | 19.5 | 19.7 | 20.8 | 17.5 | 16.7 | 15.2 | 13.6 | |||
| West | ||||||||||
| Proportion of persons aged 0-17 living in jobless household | 16.5 | 17.6 | 16.2 | 15.7 | 17.7 | 14.5 | 13.3 | |||
| Proportion of male persons aged 18-59 living in jobless household | 13.6 | 15.2 | 15.1 | 13.2 | 13.8 | 10.9 | 11.2 | |||
| Proportion of female persons aged 18-59 living in jobless household | 13.2 | 14.9 | 15.5 | 14.1 | 16.0 | 13.5 | 12.3 | |||
| Proportion of persons aged 18-59 living in jobless households | 13.4 | 15.1 | 15.3 | 13.6 | 14.9 | 12.2 | 11.8 | |||
| Proportion of all persons aged 0-59 living in jobless households | 14.3 | 15.8 | 15.6 | 14.3 | 15.8 | 12.9 | 12.3 | |||
| Southern and Eastern | ||||||||||
| Proportion of persons aged 0-17 living in jobless household | 19.4 | 19.5 | 19.8 | 17.4 | 15.4 | 14.7 | 13.3 | |||
| Proportion of male persons aged 18-59 living in jobless household | 12.8 | 13.9 | 14.0 | 13.6 | 11.6 | 11.4 | 10.7 | |||
| Proportion of female persons aged 18-59 living in jobless household | 14.9 | 15.0 | 15.4 | 14.8 | 13.7 | 12.5 | 11.9 | |||
| Proportion of persons aged 18-59 living in jobless households | 13.9 | 14.4 | 14.7 | 14.2 | 12.7 | 11.9 | 11.3 | |||
| Proportion of all persons aged 0-59 living in jobless households | 15.5 | 15.9 | 16.2 | 15.2 | 13.5 | 12.8 | 11.9 | |||
| Dublin | ||||||||||
| Proportion of persons aged 0-17 living in jobless household | 21.8 | 20.9 | 20.2 | 17.8 | 16.2 | 16.0 | 15.0 | |||
| Proportion of male persons aged 18-59 living in jobless household | 11.3 | 12.3 | 12.6 | 12.8 | 10.2 | 10.4 | 9.8 | |||
| Proportion of female persons aged 18-59 living in jobless household | 14.2 | 14.1 | 14.4 | 13.8 | 11.8 | 11.3 | 11.6 | |||
| Proportion of persons aged 18-59 living in jobless households | 12.8 | 13.2 | 13.6 | 13.3 | 11.0 | 10.9 | 10.7 | |||
| Proportion of all persons aged 0-59 living in jobless households | 15.2 | 15.3 | 15.4 | 14.6 | 12.5 | 12.3 | 12.0 | |||
| Mid-East | ||||||||||
| Proportion of persons aged 0-17 living in jobless household | 14.9 | 17.1 | 18.0 | 17.1 | 13.5 | 12.5 | 11.4 | |||
| Proportion of male persons aged 18-59 living in jobless household | 11.1 | 12.1 | 11.2 | 11.5 | 10.1 | 9.9 | 8.9 | |||
| Proportion of female persons aged 18-59 living in jobless household | 13.4 | 12.7 | 13.7 | 14.3 | 12.8 | 11.3 | 10.1 | |||
| Proportion of persons aged 18-59 living in jobless households | 12.3 | 12.4 | 12.5 | 13.0 | 11.5 | 10.6 | 9.5 | |||
| Proportion of all persons aged 0-59 living in jobless households | 13.1 | 13.9 | 14.3 | 14.4 | 12.2 | 11.3 | 10.2 | |||
| Mid-West | ||||||||||
| Proportion of persons aged 0-17 living in jobless household | 19.2 | 15.7 | 17.2 | 14.9 | 15.9 | 13.3 | 11.7 | |||
| Proportion of male persons aged 18-59 living in jobless household | 16.5 | 14.4 | 16.1 | 13.7 | 13.0 | 12.6 | 11.9 | |||
| Proportion of female persons aged 18-59 living in jobless household | 16.1 | 13.6 | 16.4 | 13.8 | 13.7 | 14.1 | 11.7 | |||
| Proportion of persons aged 18-59 living in jobless households | 16.3 | 14.0 | 16.3 | 13.7 | 13.3 | 13.3 | 11.8 | |||
| Proportion of all persons aged 0-59 living in jobless households | 17.2 | 14.5 | 16.6 | 14.1 | 14.2 | 13.3 | 11.8 | |||
| South-East | ||||||||||
| Proportion of persons aged 0-17 living in jobless household | 24.1 | 24.9 | 24.0 | 21.7 | 15.7 | 14.3 | 11.5 | |||
| Proportion of male persons aged 18-59 living in jobless household | 16.5 | 18.2 | 18.9 | 20.0 | 14.3 | 13.1 | 13.5 | |||
| Proportion of female persons aged 18-59 living in jobless household | 19.7 | 20.7 | 20.1 | 19.7 | 17.4 | 15.4 | 12.9 | |||
| Proportion of persons aged 18-59 living in jobless households | 18.1 | 19.4 | 19.5 | 19.8 | 15.9 | 14.3 | 13.2 | |||
| Proportion of all persons aged 0-59 living in jobless households | 19.9 | 21.2 | 20.9 | 20.4 | 15.8 | 14.3 | 12.7 | |||
| South-West | ||||||||||
| Proportion of persons aged 0-17 living in jobless household | 15.9 | 17.3 | 18.7 | 15.1 | 15.2 | 15.6 | 14.1 | |||
| Proportion of male persons aged 18-59 living in jobless household | 12.2 | 15.0 | 14.2 | 12.0 | 13.0 | 12.7 | 11.3 | |||
| Proportion of female persons aged 18-59 living in jobless household | 13.5 | 15.4 | 14.6 | 14.1 | 15.6 | 13.0 | 13.2 | |||
| Proportion of persons aged 18-59 living in jobless households | 12.9 | 15.2 | 14.4 | 13.0 | 14.3 | 12.8 | 12.3 | |||
| Proportion of all persons aged 0-59 living in jobless households | 13.7 | 15.8 | 15.7 | 13.7 | 14.6 | 13.7 | 12.8 | |||
| State | ||||||||||
| Proportion of persons aged 0-17 living in jobless household | 19.4 | 20.1 | 20.1 | 18.0 | 16.2 | 14.9 | 13.3 | |||
| Proportion of male persons aged 18-59 living in jobless household | 13.4 | 14.7 | 15.3 | 14.4 | 12.8 | 11.8 | 11.2 | |||
| Proportion of female persons aged 18-59 living in jobless household | 15.3 | 15.7 | 16.4 | 15.4 | 14.6 | 13.1 | 12.4 | |||
| Proportion of persons aged 18-59 living in jobless households | 14.3 | 15.2 | 15.9 | 14.9 | 13.7 | 12.4 | 11.8 | |||
| Proportion of all persons aged 0-59 living in jobless households | 15.9 | 16.7 | 17.2 | 15.8 | 14.5 | 13.2 | 12.3 | |||
| Note: Households consisting entirely of persons aged 18-24, all of whom have indicated that their Principal Economic Status is Student, are excluded from the above calculations | ||||||||||
| Table 2 Number of households classified by NUTS2 and NUTS3 regions and Size of Household | |||||||||
| '000 | |||||||||
| Region/Household size | Q2 10 | Q2 11 | Q2 12 | Q2 13 | Q2 14 | Q2 15 | Q2 16 | ||
| Border, Midland and Western | |||||||||
| 1 person | 107.4 | 108.4 | 113.1 | 114.7 | 110.6 | 105.5 | 116.5 | ||
| 2 persons | 132.8 | 138.3 | 139.9 | 137.5 | 135.6 | 131.8 | 137.8 | ||
| 3 persons | 80.4 | 79.5 | 77.0 | 80.0 | 77.4 | 78.3 | 77.0 | ||
| 4 persons | 71.5 | 71.2 | 70.0 | 70.4 | 73.5 | 71.9 | 70.6 | ||
| 5 persons | 39.3 | 39.9 | 40.7 | 39.9 | 38.0 | 40.8 | 40.5 | ||
| 6 or more persons | 20.9 | 20.7 | 19.8 | 19.4 | 20.5 | 20.2 | 18.6 | ||
| Total households | 452.4 | 457.9 | 460.6 | 461.9 | 455.6 | 448.5 | 461.0 | ||
| Border | |||||||||
| 1 person | 45.5 | 47.2 | 52.4 | 51.6 | 47.0 | 43.4 | 47.1 | ||
| 2 persons | 54.5 | 57.8 | 56.8 | 55.9 | 55.7 | 53.7 | 57.6 | ||
| 3 persons | 33.3 | 33.2 | 28.8 | 30.8 | 31.3 | 29.6 | 29.8 | ||
| 4 persons | 28.7 | 27.3 | 26.9 | 28.3 | 29.1 | 29.9 | 26.2 | ||
| 5 persons | 16.5 | 16.2 | 17.1 | 17.4 | 15.8 | 17.4 | 17.5 | ||
| 6 or more persons | 9.4 | 9.8 | 10.0 | 8.2 | 8.6 | 7.9 | 8.1 | ||
| Total households | 188.1 | 191.4 | 192.0 | 192.2 | 187.4 | 181.8 | 186.3 | ||
| Midland | |||||||||
| 1 person | 21.7 | 21.2 | 21.8 | 24.0 | 22.0 | 23.8 | 28.2 | ||
| 2 persons | 30.8 | 31.0 | 31.1 | 30.2 | 31.3 | 31.5 | 29.5 | ||
| 3 persons | 18.0 | 17.7 | 19.6 | 19.7 | 20.5 | 21.1 | 19.1 | ||
| 4 persons | 18.2 | 17.5 | 17.6 | 17.6 | 17.2 | 16.2 | 18.6 | ||
| 5 persons | 8.5 | 9.5 | 9.9 | 9.7 | 9.6 | 8.9 | 9.0 | ||
| 6 or more persons | 4.3 | 4.7 | 3.8 | 4.1 | 4.3 | 5.3 | [4.4] | ||
| Total households | 101.5 | 101.7 | 103.7 | 105.4 | 105.0 | 106.7 | 108.7 | ||
| West | |||||||||
| 1 person | 40.2 | 40.0 | 39.0 | 39.2 | 41.6 | 38.3 | 41.2 | ||
| 2 persons | 47.4 | 49.5 | 52.0 | 51.4 | 48.5 | 46.7 | 50.6 | ||
| 3 persons | 29.1 | 28.5 | 28.7 | 29.4 | 25.6 | 27.6 | 28.1 | ||
| 4 persons | 24.6 | 26.4 | 25.5 | 24.5 | 27.3 | 25.8 | 25.8 | ||
| 5 persons | 14.2 | 14.2 | 13.7 | 12.8 | 12.7 | 14.6 | 14.0 | ||
| 6 or more persons | 7.3 | 6.2 | 6.0 | 7.0 | 7.5 | 7.1 | 6.1 | ||
| Total households | 162.8 | 164.8 | 164.8 | 164.4 | 163.2 | 159.9 | 165.9 | ||
| Southern and Eastern | |||||||||
| 1 person | 271.9 | 254.4 | 253.2 | 266.4 | 268.2 | 278.9 | 296.2 | ||
| 2 persons | 367.5 | 357.7 | 364.1 | 374.0 | 375.5 | 361.6 | 355.8 | ||
| 3 persons | 224.1 | 229.5 | 216.9 | 223.1 | 220.0 | 226.8 | 234.9 | ||
| 4 persons | 210.8 | 207.0 | 215.5 | 214.7 | 212.2 | 214.6 | 217.8 | ||
| 5 persons | 99.7 | 108.1 | 111.4 | 102.8 | 109.5 | 107.1 | 112.9 | ||
| 6 or more persons | 47.9 | 48.1 | 46.7 | 47.1 | 47.1 | 51.9 | 47.2 | ||
| Total households | 1,221.9 | 1,204.8 | 1,207.8 | 1,228.1 | 1,232.6 | 1,240.8 | 1,264.8 | ||
| Dublin | |||||||||
| 1 person | 97.1 | 89.8 | 91.5 | 98.9 | 105.5 | 107.2 | 117.9 | ||
| 2 persons | 136.0 | 134.3 | 137.3 | 146.8 | 145.2 | 142.8 | 144.7 | ||
| 3 persons | 85.5 | 87.6 | 83.2 | 86.4 | 86.9 | 90.2 | 93.1 | ||
| 4 persons | 84.2 | 76.9 | 83.8 | 79.0 | 78.4 | 81.2 | 84.6 | ||
| 5 persons | 37.2 | 43.0 | 40.0 | 36.9 | 38.4 | 38.0 | 41.4 | ||
| 6 or more persons | 17.5 | 18.4 | 17.3 | 17.5 | 17.5 | 19.7 | 14.8 | ||
| Total households | 457.5 | 450.0 | 453.0 | 465.5 | 472.0 | 479.0 | 496.6 | ||
| Mid-East | |||||||||
| 1 person | 36.4 | 34.4 | 32.6 | 32.6 | 32.8 | 33.0 | 36.4 | ||
| 2 persons | 57.4 | 51.6 | 54.2 | 49.3 | 54.5 | 48.5 | 48.4 | ||
| 3 persons | 33.5 | 33.8 | 30.3 | 34.3 | 32.4 | 36.9 | 37.3 | ||
| 4 persons | 35.7 | 37.5 | 36.6 | 36.0 | 39.2 | 37.7 | 39.4 | ||
| 5 persons | 16.6 | 18.6 | 21.4 | 19.6 | 19.6 | 19.9 | 21.3 | ||
| 6 or more persons | 8.0 | 8.1 | 8.8 | 9.9 | 8.5 | 9.5 | 7.9 | ||
| Total households | 187.7 | 184.0 | 183.8 | 181.7 | 186.8 | 185.5 | 190.7 | ||
| Mid-West | |||||||||
| 1 person | 35.6 | 32.5 | 34.1 | 31.7 | 31.5 | 31.8 | 32.9 | ||
| 2 persons | 41.7 | 42.0 | 44.0 | 43.0 | 42.4 | 40.1 | 38.3 | ||
| 3 persons | 26.7 | 23.8 | 24.2 | 23.5 | 24.1 | 22.8 | 26.8 | ||
| 4 persons | 23.6 | 23.9 | 22.3 | 24.6 | 22.8 | 23.3 | 23.6 | ||
| 5 persons | 10.7 | 11.8 | 12.4 | 11.9 | 12.4 | 13.5 | 11.5 | ||
| 6 or more persons | 5.0 | 5.6 | 5.4 | 5.0 | 5.4 | 5.6 | 5.7 | ||
| Total households | 143.3 | 139.6 | 142.4 | 139.7 | 138.8 | 137.3 | 138.8 | ||
| South-East | |||||||||
| 1 person | 43.2 | 37.4 | 37.6 | 44.1 | 40.9 | 46.5 | 47.2 | ||
| 2 persons | 58.3 | 56.9 | 55.4 | 59.1 | 58.8 | 58.2 | 56.0 | ||
| 3 persons | 32.2 | 36.4 | 33.8 | 33.7 | 33.3 | 34.8 | 35.7 | ||
| 4 persons | 29.1 | 30.7 | 32.3 | 32.3 | 29.8 | 30.2 | 28.6 | ||
| 5 persons | 16.1 | 14.3 | 16.3 | 15.6 | 16.6 | 14.5 | 16.5 | ||
| 6 or more persons | 6.8 | 6.9 | 6.4 | 5.3 | 6.8 | 7.1 | 7.5 | ||
| Total households | 185.6 | 182.5 | 181.9 | 190.2 | 186.3 | 191.4 | 191.5 | ||
| South-West | |||||||||
| 1 person | 59.6 | 60.4 | 57.4 | 59.1 | 57.5 | 60.4 | 61.8 | ||
| 2 persons | 74.1 | 72.8 | 73.1 | 75.8 | 74.6 | 71.9 | 68.3 | ||
| 3 persons | 46.2 | 47.8 | 45.4 | 45.1 | 43.3 | 42.1 | 42.1 | ||
| 4 persons | 38.1 | 37.9 | 40.5 | 42.8 | 41.9 | 42.0 | 41.5 | ||
| 5 persons | 19.1 | 20.5 | 21.3 | 18.8 | 22.4 | 21.2 | 22.2 | ||
| 6 or more persons | 10.5 | 9.1 | 9.0 | 9.4 | 8.9 | 10.0 | 11.3 | ||
| Total households | 247.8 | 248.6 | 246.6 | 250.9 | 248.7 | 247.6 | 247.2 | ||
| State | |||||||||
| 1 person | 379.3 | 362.7 | 366.3 | 381.1 | 378.9 | 384.4 | 412.6 | ||
| 2 persons | 500.3 | 496.0 | 504.0 | 511.5 | 511.1 | 493.4 | 493.5 | ||
| 3 persons | 304.5 | 309.0 | 294.0 | 303.1 | 297.4 | 305.1 | 312.0 | ||
| 4 persons | 282.3 | 278.2 | 285.5 | 285.2 | 285.7 | 286.5 | 288.4 | ||
| 5 persons | 139.0 | 148.0 | 152.1 | 142.7 | 147.5 | 147.9 | 153.4 | ||
| 6 or more persons | 68.8 | 68.8 | 66.5 | 66.5 | 67.6 | 72.0 | 65.8 | ||
| Total households | 1,674.3 | 1,662.7 | 1,668.3 | 1,690.1 | 1,688.2 | 1,689.3 | 1,725.8 | ||
| Note: The average grossing factor of all members of a household is used to calculate the number of households. The number of households should be treated as indicative only. | |||||||||
| Table 3 Share of households classified by NUTS2 and NUTS3 regions and Size of Household | |||||||||
| % | |||||||||
| Region/Household size | Q2 10 | Q2 11 | Q2 12 | Q2 13 | Q2 14 | Q2 15 | Q2 16 | ||
| Border, Midland and Western | |||||||||
| 1 person | 23.7 | 23.7 | 24.6 | 24.8 | 24.3 | 23.5 | 25.3 | ||
| 2 persons | 29.4 | 30.2 | 30.4 | 29.8 | 29.8 | 29.4 | 29.9 | ||
| 3 persons | 17.8 | 17.4 | 16.7 | 17.3 | 17.0 | 17.5 | 16.7 | ||
| 4 persons | 15.8 | 15.6 | 15.2 | 15.2 | 16.1 | 16.0 | 15.3 | ||
| 5 persons | 8.7 | 8.7 | 8.8 | 8.6 | 8.3 | 9.1 | 8.8 | ||
| 6 or more persons | 4.6 | 4.5 | 4.3 | 4.2 | 4.5 | 4.5 | 4.0 | ||
| Total households | 100.0 | 100.0 | 100.0 | 100.0 | 100.0 | 100.0 | 100.0 | ||
| Border | |||||||||
| 1 person | 24.2 | 24.6 | 27.3 | 26.8 | 25.1 | 23.9 | 25.3 | ||
| 2 persons | 29.0 | 30.2 | 29.6 | 29.1 | 29.7 | 29.5 | 30.9 | ||
| 3 persons | 17.7 | 17.4 | 15.0 | 16.0 | 16.7 | 16.3 | 16.0 | ||
| 4 persons | 15.3 | 14.3 | 14.0 | 14.7 | 15.5 | 16.4 | 14.1 | ||
| 5 persons | 8.8 | 8.4 | 8.9 | 9.0 | 8.4 | 9.6 | 9.4 | ||
| 6 or more persons | 5.0 | 5.1 | 5.2 | 4.3 | 4.6 | 4.3 | 4.4 | ||
| Total households | 100.0 | 100.0 | 100.0 | 100.0 | 100.0 | 100.0 | 100.0 | ||
| Midland | |||||||||
| 1 person | 21.4 | 20.9 | 21.0 | 22.7 | 21.0 | 22.3 | 26.0 | ||
| 2 persons | 30.4 | 30.5 | 30.0 | 28.6 | 29.9 | 29.5 | 27.1 | ||
| 3 persons | 17.7 | 17.4 | 18.9 | 18.7 | 19.5 | 19.8 | 17.6 | ||
| 4 persons | 18.0 | 17.3 | 16.9 | 16.7 | 16.4 | 15.2 | 17.1 | ||
| 5 persons | 8.4 | 9.4 | 9.6 | 9.2 | 9.1 | 8.3 | 8.3 | ||
| 6 or more persons | 4.2 | 4.6 | 3.6 | 3.9 | 4.1 | 4.9 | 4.0 | ||
| Total households | 100.0 | 100.0 | 100.0 | 100.0 | 100.0 | 100.0 | 100.0 | ||
| West | |||||||||
| 1 person | 24.7 | 24.3 | 23.7 | 23.8 | 25.5 | 23.9 | 24.8 | ||
| 2 persons | 29.1 | 30.0 | 31.6 | 31.3 | 29.7 | 29.2 | 30.5 | ||
| 3 persons | 17.9 | 17.3 | 17.4 | 17.9 | 15.7 | 17.3 | 17.0 | ||
| 4 persons | 15.1 | 16.0 | 15.5 | 14.9 | 16.7 | 16.1 | 15.5 | ||
| 5 persons | 8.7 | 8.6 | 8.3 | 7.8 | 7.8 | 9.1 | 8.5 | ||
| 6 or more persons | 4.5 | 3.8 | 3.6 | 4.3 | 4.6 | 4.4 | 3.7 | ||
| Total households | 100.0 | 100.0 | 100.0 | 100.0 | 100.0 | 100.0 | 100.0 | ||
| Southern and Eastern | |||||||||
| 1 person | 22.3 | 21.1 | 21.0 | 21.7 | 21.8 | 22.5 | 23.4 | ||
| 2 persons | 30.1 | 29.7 | 30.1 | 30.4 | 30.5 | 29.1 | 28.1 | ||
| 3 persons | 18.3 | 19.1 | 18.0 | 18.2 | 17.9 | 18.3 | 18.6 | ||
| 4 persons | 17.3 | 17.2 | 17.8 | 17.5 | 17.2 | 17.3 | 17.2 | ||
| 5 persons | 8.2 | 9.0 | 9.2 | 8.4 | 8.9 | 8.6 | 8.9 | ||
| 6 or more persons | 3.9 | 4.0 | 3.9 | 3.8 | 3.8 | 4.2 | 3.7 | ||
| Total households | 100.0 | 100.0 | 100.0 | 100.0 | 100.0 | 100.0 | 100.0 | ||
| Dublin | |||||||||
| 1 person | 21.2 | 19.9 | 20.2 | 21.3 | 22.4 | 22.4 | 23.7 | ||
| 2 persons | 29.7 | 29.9 | 30.3 | 31.5 | 30.8 | 29.8 | 29.1 | ||
| 3 persons | 18.7 | 19.5 | 18.4 | 18.6 | 18.4 | 18.8 | 18.8 | ||
| 4 persons | 18.4 | 17.1 | 18.5 | 17.0 | 16.6 | 17.0 | 17.0 | ||
| 5 persons | 8.1 | 9.6 | 8.8 | 7.9 | 8.1 | 7.9 | 8.3 | ||
| 6 or more persons | 3.8 | 4.1 | 3.8 | 3.8 | 3.7 | 4.1 | 3.0 | ||
| Total households | 100.0 | 100.0 | 100.0 | 100.0 | 100.0 | 100.0 | 100.0 | ||
| Mid-East | |||||||||
| 1 person | 19.4 | 18.7 | 17.7 | 17.9 | 17.5 | 17.8 | 19.1 | ||
| 2 persons | 30.6 | 28.0 | 29.5 | 27.1 | 29.1 | 26.1 | 25.4 | ||
| 3 persons | 17.8 | 18.4 | 16.5 | 18.9 | 17.3 | 19.9 | 19.6 | ||
| 4 persons | 19.0 | 20.4 | 19.9 | 19.8 | 21.0 | 20.4 | 20.7 | ||
| 5 persons | 8.8 | 10.1 | 11.6 | 10.8 | 10.5 | 10.7 | 11.2 | ||
| 6 or more persons | 4.3 | 4.4 | 4.8 | 5.5 | 4.6 | 5.1 | 4.1 | ||
| Total households | 100.0 | 100.0 | 100.0 | 100.0 | 100.0 | 100.0 | 100.0 | ||
| Mid-West | |||||||||
| 1 person | 24.8 | 23.3 | 24.0 | 22.7 | 22.7 | 23.2 | 23.7 | ||
| 2 persons | 29.1 | 30.1 | 30.9 | 30.8 | 30.6 | 29.2 | 27.6 | ||
| 3 persons | 18.6 | 17.1 | 17.0 | 16.8 | 17.4 | 16.6 | 19.3 | ||
| 4 persons | 16.5 | 17.1 | 15.6 | 17.6 | 16.5 | 17.0 | 17.0 | ||
| 5 persons | 7.5 | 8.4 | 8.7 | 8.5 | 9.0 | 9.9 | 8.3 | ||
| 6 or more persons | 3.5 | 4.0 | 3.8 | 3.6 | 3.9 | 4.1 | 4.1 | ||
| Total households | 100.0 | 100.0 | 100.0 | 100.0 | 100.0 | 100.0 | 100.0 | ||
| South-East | |||||||||
| 1 person | 23.3 | 20.5 | 20.7 | 23.2 | 22.0 | 24.3 | 24.6 | ||
| 2 persons | 31.4 | 31.2 | 30.5 | 31.1 | 31.6 | 30.4 | 29.2 | ||
| 3 persons | 17.3 | 19.9 | 18.6 | 17.7 | 17.9 | 18.2 | 18.6 | ||
| 4 persons | 15.7 | 16.8 | 17.8 | 17.0 | 16.0 | 15.8 | 15.0 | ||
| 5 persons | 8.7 | 7.8 | 8.9 | 8.2 | 8.9 | 7.6 | 8.6 | ||
| 6 or more persons | 3.7 | 3.8 | 3.5 | 2.8 | 3.6 | 3.7 | 3.9 | ||
| Total households | 100.0 | 100.0 | 100.0 | 100.0 | 100.0 | 100.0 | 100.0 | ||
| South-West | |||||||||
| 1 person | 24.1 | 24.3 | 23.3 | 23.5 | 23.1 | 24.4 | 25.0 | ||
| 2 persons | 29.9 | 29.3 | 29.7 | 30.2 | 30.0 | 29.0 | 27.6 | ||
| 3 persons | 18.7 | 19.2 | 18.4 | 18.0 | 17.4 | 17.0 | 17.0 | ||
| 4 persons | 15.4 | 15.3 | 16.4 | 17.1 | 16.9 | 17.0 | 16.8 | ||
| 5 persons | 7.7 | 8.3 | 8.6 | 7.5 | 9.0 | 8.6 | 9.0 | ||
| 6 or more persons | 4.3 | 3.7 | 3.6 | 3.7 | 3.6 | 4.0 | 4.6 | ||
| Total households | 100.0 | 100.0 | 100.0 | 100.0 | 100.0 | 100.0 | 100.0 | ||
| State | |||||||||
| 1 person | 22.7 | 21.8 | 22.0 | 22.6 | 22.4 | 22.8 | 23.9 | ||
| 2 persons | 29.9 | 29.8 | 30.2 | 30.3 | 30.3 | 29.2 | 28.6 | ||
| 3 persons | 18.2 | 18.6 | 17.6 | 17.9 | 17.6 | 18.1 | 18.1 | ||
| 4 persons | 16.9 | 16.7 | 17.1 | 16.9 | 16.9 | 17.0 | 16.7 | ||
| 5 persons | 8.3 | 8.9 | 9.1 | 8.4 | 8.7 | 8.8 | 8.9 | ||
| 6 or more persons | 4.1 | 4.1 | 4.0 | 3.9 | 4.0 | 4.3 | 3.8 | ||
| Total households | 100.0 | 100.0 | 100.0 | 100.0 | 100.0 | 100.0 | 100.0 | ||
| Note: The average grossing factor of all members of a household is used to calculate the number of households. The number of households should be treated as indicative only. | |||||||||
| Table 4 Number of households with or without person aged less than 18 by NUTS2 and NUTS3 regions | |||||||||
| '000 | |||||||||
| Region/Household by age of persons | Q2 10 | Q2 11 | Q2 12 | Q2 13 | Q2 14 | Q2 15 | Q2 16 | ||
| Border, Midland and Western | |||||||||
| Household without person aged less than 18 | 279.5 | 284.3 | 287.3 | 287.4 | 284.2 | 275.8 | 292.3 | ||
| Household with person aged less than 18 | 172.9 | 173.6 | 173.3 | 174.6 | 171.4 | 172.7 | 168.6 | ||
| Total households | 452.4 | 457.9 | 460.6 | 461.9 | 455.6 | 448.5 | 461.0 | ||
| Border | |||||||||
| Household without person aged less than 18 | 114.6 | 118.4 | 120.3 | 120.8 | 117.1 | 111.3 | 118.1 | ||
| Household with person aged less than 18 | 73.5 | 73.0 | 71.7 | 71.4 | 70.3 | 70.4 | 68.2 | ||
| Total households | 188.1 | 191.4 | 192.0 | 192.2 | 187.4 | 181.8 | 186.3 | ||
| Midland | |||||||||
| Household without person aged less than 18 | 60.4 | 60.8 | 61.2 | 62.4 | 61.0 | 64.8 | 66.2 | ||
| Household with person aged less than 18 | 41.1 | 40.8 | 42.5 | 43.0 | 44.0 | 42.0 | 42.5 | ||
| Total households | 101.5 | 101.7 | 103.7 | 105.4 | 105.0 | 106.7 | 108.7 | ||
| West | |||||||||
| Household without person aged less than 18 | 104.5 | 105.1 | 105.8 | 104.2 | 106.1 | 99.7 | 108.0 | ||
| Household with person aged less than 18 | 58.3 | 59.8 | 59.1 | 60.2 | 57.1 | 60.2 | 57.9 | ||
| Total households | 162.8 | 164.8 | 164.8 | 164.4 | 163.2 | 159.9 | 165.9 | ||
| Southern and Eastern | |||||||||
| Household without person aged less than 18 | 763.9 | 749.7 | 742.0 | 762.2 | 771.1 | 777.1 | 804.8 | ||
| Household with person aged less than 18 | 458.0 | 455.1 | 465.8 | 465.9 | 461.5 | 463.7 | 460.1 | ||
| Total households | 1,221.9 | 1,204.8 | 1,207.8 | 1,228.1 | 1,232.6 | 1,240.8 | 1,264.8 | ||
| Dublin | |||||||||
| Household without person aged less than 18 | 290.5 | 288.5 | 286.2 | 299.9 | 307.9 | 307.7 | 329.0 | ||
| Household with person aged less than 18 | 167.0 | 161.5 | 166.8 | 165.7 | 164.2 | 171.4 | 167.6 | ||
| Total households | 457.5 | 450.0 | 453.0 | 465.5 | 472.0 | 479.0 | 496.6 | ||
| Mid-East | |||||||||
| Household without person aged less than 18 | 108.1 | 103.1 | 101.3 | 97.8 | 102.7 | 103.0 | 108.3 | ||
| Household with person aged less than 18 | 79.7 | 80.9 | 82.5 | 84.0 | 84.1 | 82.5 | 82.4 | ||
| Total households | 187.7 | 184.0 | 183.8 | 181.7 | 186.8 | 185.5 | 190.7 | ||
| Mid-West | |||||||||
| Household without person aged less than 18 | 92.3 | 87.8 | 90.6 | 88.2 | 87.8 | 86.4 | 88.5 | ||
| Household with person aged less than 18 | 51.0 | 51.8 | 51.8 | 51.5 | 51.0 | 50.8 | 50.2 | ||
| Total households | 143.3 | 139.6 | 142.4 | 139.7 | 138.8 | 137.3 | 138.8 | ||
| South-East | |||||||||
| Household without person aged less than 18 | 114.2 | 111.9 | 109.0 | 117.1 | 115.4 | 120.5 | 122.0 | ||
| Household with person aged less than 18 | 71.4 | 70.6 | 72.9 | 73.1 | 70.9 | 70.9 | 69.6 | ||
| Total households | 185.6 | 182.5 | 181.9 | 190.2 | 186.3 | 191.4 | 191.5 | ||
| South-West | |||||||||
| Household without person aged less than 18 | 158.7 | 158.3 | 154.9 | 159.2 | 157.4 | 159.5 | 157.0 | ||
| Household with person aged less than 18 | 89.0 | 90.2 | 91.7 | 91.7 | 91.3 | 88.2 | 90.2 | ||
| Total households | 247.8 | 248.6 | 246.6 | 250.9 | 248.7 | 247.6 | 247.2 | ||
| State | |||||||||
| Household without person aged less than 18 | 1,043.3 | 1,034.0 | 1,029.3 | 1,049.6 | 1,055.4 | 1,052.9 | 1,097.1 | ||
| Household with person aged less than 18 | 630.9 | 628.7 | 639.0 | 640.5 | 632.8 | 636.4 | 628.7 | ||
| Total households | 1,674.3 | 1,662.7 | 1,668.3 | 1,690.1 | 1,688.2 | 1,689.3 | 1,725.8 | ||
| Note: The average grossing factor of all members of a household is used to calculate the number of households. The number of households should be treated as indicative only. | |||||||||
 Show Table 5 Share of households with or without person aged less than 18 by NUTS2 and NUTS3 regions
| Table 5 Share of households with or without person aged less than 18 by NUTS2 and NUTS3 regions | |||||||||
| % | |||||||||
| Region/Household by age of persons | Q2 10 | Q2 11 | Q2 12 | Q2 13 | Q2 14 | Q2 15 | Q2 16 | ||
| Border, Midland and Western | |||||||||
| Household without person aged less than 18 | 61.8 | 62.1 | 62.4 | 62.2 | 62.4 | 61.5 | 63.4 | ||
| Household with person aged less than 18 | 38.2 | 37.9 | 37.6 | 37.8 | 37.6 | 38.5 | 36.6 | ||
| Total households | 100.0 | 100.0 | 100.0 | 100.0 | 100.0 | 100.0 | 100.0 | ||
| Border | |||||||||
| Household without person aged less than 18 | 60.9 | 61.9 | 62.6 | 62.8 | 62.5 | 61.3 | 63.4 | ||
| Household with person aged less than 18 | 39.1 | 38.1 | 37.4 | 37.2 | 37.5 | 38.7 | 36.6 | ||
| Total households | 100.0 | 100.0 | 100.0 | 100.0 | 100.0 | 100.0 | 100.0 | ||
| Midland | |||||||||
| Household without person aged less than 18 | 59.5 | 59.8 | 59.0 | 59.2 | 58.1 | 60.7 | 60.9 | ||
| Household with person aged less than 18 | 40.5 | 40.2 | 41.0 | 40.8 | 41.9 | 39.3 | 39.1 | ||
| Total households | 100.0 | 100.0 | 100.0 | 100.0 | 100.0 | 100.0 | 100.0 | ||
| West | |||||||||
| Household without person aged less than 18 | 64.2 | 63.7 | 64.2 | 63.4 | 65.0 | 62.3 | 65.1 | ||
| Household with person aged less than 18 | 35.8 | 36.3 | 35.8 | 36.6 | 35.0 | 37.7 | 34.9 | ||
| Total households | 100.0 | 100.0 | 100.0 | 100.0 | 100.0 | 100.0 | 100.0 | ||
| Southern and Eastern | |||||||||
| Household without person aged less than 18 | 62.5 | 62.2 | 61.4 | 62.1 | 62.6 | 62.6 | 63.6 | ||
| Household with person aged less than 18 | 37.5 | 37.8 | 38.6 | 37.9 | 37.4 | 37.4 | 36.4 | ||
| Total households | 100.0 | 100.0 | 100.0 | 100.0 | 100.0 | 100.0 | 100.0 | ||
| Dublin | |||||||||
| Household without person aged less than 18 | 63.5 | 64.1 | 63.2 | 64.4 | 65.2 | 64.2 | 66.2 | ||
| Household with person aged less than 18 | 36.5 | 35.9 | 36.8 | 35.6 | 34.8 | 35.8 | 33.8 | ||
| Total households | 100.0 | 100.0 | 100.0 | 100.0 | 100.0 | 100.0 | 100.0 | ||
| Mid-East | |||||||||
| Household without person aged less than 18 | 57.6 | 56.0 | 55.1 | 53.8 | 55.0 | 55.6 | 56.8 | ||
| Household with person aged less than 18 | 42.4 | 44.0 | 44.9 | 46.2 | 45.0 | 44.4 | 43.2 | ||
| Total households | 100.0 | 100.0 | 100.0 | 100.0 | 100.0 | 100.0 | 100.0 | ||
| Mid-West | |||||||||
| Household without person aged less than 18 | 64.4 | 62.9 | 63.6 | 63.1 | 63.2 | 63.0 | 63.8 | ||
| Household with person aged less than 18 | 35.6 | 37.1 | 36.4 | 36.9 | 36.8 | 37.0 | 36.2 | ||
| Total households | 100.0 | 100.0 | 100.0 | 100.0 | 100.0 | 100.0 | 100.0 | ||
| South-East | |||||||||
| Household without person aged less than 18 | 61.5 | 61.3 | 59.9 | 61.6 | 61.9 | 62.9 | 63.7 | ||
| Household with person aged less than 18 | 38.5 | 38.7 | 40.1 | 38.4 | 38.1 | 37.1 | 36.3 | ||
| Total households | 100.0 | 100.0 | 100.0 | 100.0 | 100.0 | 100.0 | 100.0 | ||
| South-West | |||||||||
| Household without person aged less than 18 | 64.1 | 63.7 | 62.8 | 63.5 | 63.3 | 64.4 | 63.5 | ||
| Household with person aged less than 18 | 35.9 | 36.3 | 37.2 | 36.5 | 36.7 | 35.6 | 36.5 | ||
| Total households | 100.0 | 100.0 | 100.0 | 100.0 | 100.0 | 100.0 | 100.0 | ||
| State | |||||||||
| Household without person aged less than 18 | 62.3 | 62.2 | 61.7 | 62.1 | 62.5 | 62.3 | 63.6 | ||
| Household with person aged less than 18 | 37.7 | 37.8 | 38.3 | 37.9 | 37.5 | 37.7 | 36.4 | ||
| Total households | 100.0 | 100.0 | 100.0 | 100.0 | 100.0 | 100.0 | 100.0 | ||
| Note: The average grossing factor of all members of a household is used to calculate the number of households. The number of households should be treated as indicative only. | |||||||||
| Table 6 Number of households classified by NUTS2 and NUTS3 regions and family units | |||||||||
| '000 | |||||||||
| Region/Household type | Q2 10 | Q2 11 | Q2 12 | Q2 13 | Q2 14 | Q2 15 | Q2 16 | ||
| Border, Midland and Western | |||||||||
| Single person household | 107.4 | 108.4 | 113.1 | 114.7 | 110.6 | 105.5 | 116.5 | ||
| Couple with no children household (with/without other persons) | 95.2 | 100.6 | 101.6 | 101.4 | 100.9 | 97.4 | 103.7 | ||
| Couple with children household (with/without other persons) | 174.0 | 174.1 | 168.7 | 172.0 | 172.7 | 176.7 | 171.2 | ||
| Lone parent household (with/without other persons) | 50.1 | 54.4 | 53.6 | 52.4 | 50.7 | 51.0 | 50.6 | ||
| Two or more family unit household (with/without other persons) | 4.7 | 4.5 | 4.5 | [3.6] | [4.3] | [4.3] | [4.6] | ||
| All other households | 20.9 | 16.0 | 19.0 | 17.9 | 16.4 | 13.6 | 14.5 | ||
| Total households | 452.4 | 457.9 | 460.6 | 461.9 | 455.6 | 448.5 | 461.0 | ||
| Border | |||||||||
| Single person household | 45.5 | 47.2 | 52.4 | 51.6 | 47.0 | 43.4 | 47.1 | ||
| Couple with no children household (with/without other persons) | 38.0 | 39.4 | 40.0 | 40.8 | 41.6 | 37.6 | 43.2 | ||
| Couple with children household (with/without other persons) | 71.8 | 70.2 | 65.8 | 70.9 | 69.5 | 69.3 | 68.3 | ||
| Lone parent household (with/without other persons) | 23.0 | 25.1 | 24.7 | 21.9 | 21.9 | 23.9 | 20.7 | ||
| Two or more family unit household (with/without other persons) | [2.3] | * | [2.7] | * | * | * | * | ||
| All other households | 7.4 | 7.4 | 6.5 | 5.9 | 5.4 | 5.5 | 5.1 | ||
| Total households | 188.1 | 191.4 | 192.0 | 192.2 | 187.4 | 181.8 | 186.3 | ||
| Midland | |||||||||
| Single person household | 21.7 | 21.2 | 21.8 | 24.0 | 22.0 | 23.8 | 28.2 | ||
| Couple with no children household (with/without other persons) | 22.8 | 22.8 | 22.0 | 23.5 | 23.1 | 24.4 | 22.2 | ||
| Couple with children household (with/without other persons) | 40.3 | 41.6 | 43.1 | 41.9 | 43.6 | 42.9 | 43.0 | ||
| Lone parent household (with/without other persons) | 11.5 | 12.1 | 12.0 | 12.0 | 12.4 | 11.5 | 12.5 | ||
| Two or more family unit household (with/without other persons) | * | * | * | * | * | * | * | ||
| All other households | 3.9 | [2.5] | 4.0 | [3.2] | [3.3] | [3.0] | * | ||
| Total households | 101.5 | 101.7 | 103.7 | 105.4 | 105.0 | 106.7 | 108.7 | ||
| West | |||||||||
| Single person household | 40.2 | 40.0 | 39.0 | 39.2 | 41.6 | 38.3 | 41.2 | ||
| Couple with no children household (with/without other persons) | 34.4 | 38.5 | 39.6 | 37.1 | 36.3 | 35.4 | 38.3 | ||
| Couple with children household (with/without other persons) | 62.0 | 62.3 | 59.9 | 59.1 | 59.6 | 64.5 | 59.8 | ||
| Lone parent household (with/without other persons) | 15.5 | 17.2 | 16.9 | 18.5 | 16.4 | 15.7 | 17.4 | ||
| Two or more family unit household (with/without other persons) | * | * | * | * | * | * | * | ||
| All other households | 9.6 | 6.1 | 8.5 | 8.8 | 7.7 | 5.1 | 7.6 | ||
| Total households | 162.8 | 164.8 | 164.8 | 164.4 | 163.2 | 159.9 | 165.9 | ||
| Southern and Eastern | |||||||||
| Single person household | 271.9 | 254.4 | 253.2 | 266.4 | 268.2 | 278.9 | 296.2 | ||
| Couple with no children household (with/without other persons) | 261.4 | 259.8 | 261.7 | 268.9 | 265.6 | 267.9 | 267.1 | ||
| Couple with children household (with/without other persons) | 457.7 | 464.2 | 463.5 | 470.4 | 468.4 | 468.6 | 473.0 | ||
| Lone parent household (with/without other persons) | 150.6 | 148.2 | 149.1 | 143.2 | 142.7 | 140.0 | 144.7 | ||
| Two or more family unit household (with/without other persons) | 16.2 | 16.0 | 17.5 | 15.9 | 16.5 | 19.9 | 21.9 | ||
| All other households | 64.1 | 62.2 | 62.7 | 63.3 | 71.1 | 65.5 | 61.9 | ||
| Total households | 1,221.9 | 1,204.8 | 1,207.8 | 1,228.1 | 1,232.6 | 1,240.8 | 1,264.8 | ||
| Dublin | |||||||||
| Single person household | 97.1 | 89.8 | 91.5 | 98.9 | 105.5 | 107.2 | 117.9 | ||
| Couple with no children household (with/without other persons) | 94.1 | 97.2 | 92.8 | 99.1 | 99.5 | 101.5 | 105.0 | ||
| Couple with children household (with/without other persons) | 163.6 | 165.7 | 164.8 | 166.7 | 165.3 | 165.9 | 163.2 | ||
| Lone parent household (with/without other persons) | 63.9 | 59.5 | 62.4 | 59.7 | 55.3 | 57.1 | 60.3 | ||
| Two or more family unit household (with/without other persons) | 8.1 | 8.1 | 8.9 | 7.9 | 8.4 | 10.5 | 12.1 | ||
| All other households | 30.6 | 29.9 | 32.5 | 33.1 | 38.0 | 36.8 | 38.1 | ||
| Total households | 457.5 | 450.0 | 453.0 | 465.5 | 472.0 | 479.0 | 496.6 | ||
| Mid-East | |||||||||
| Single person household | 36.4 | 34.4 | 32.6 | 32.6 | 32.8 | 33.0 | 36.4 | ||
| Couple with no children household (with/without other persons) | 42.1 | 37.8 | 41.7 | 38.5 | 40.2 | 38.0 | 38.5 | ||
| Couple with children household (with/without other persons) | 79.9 | 81.5 | 81.8 | 85.0 | 84.6 | 85.7 | 86.9 | ||
| Lone parent household (with/without other persons) | 19.4 | 23.0 | 19.1 | 18.4 | 21.6 | 20.7 | 20.8 | ||
| Two or more family unit household (with/without other persons) | [2.2] | * | [2.5] | * | * | * | * | ||
| All other households | 7.8 | 5.6 | 6.1 | [4.8] | 5.7 | [5.1] | [4.8] | ||
| Total households | 187.7 | 184.0 | 183.8 | 181.7 | 186.8 | 185.5 | 190.7 | ||
| Mid-West | |||||||||
| Single person household | 35.6 | 32.5 | 34.1 | 31.7 | 31.5 | 31.8 | 32.9 | ||
| Couple with no children household (with/without other persons) | 31.0 | 31.3 | 33.9 | 32.6 | 31.7 | 30.4 | 30.7 | ||
| Couple with children household (with/without other persons) | 54.5 | 54.0 | 53.1 | 53.0 | 51.9 | 54.6 | 55.6 | ||
| Lone parent household (with/without other persons) | 14.1 | 14.5 | 14.7 | 14.4 | 15.2 | 12.4 | 14.1 | ||
| Two or more family unit household (with/without other persons) | * | * | * | * | * | * | * | ||
| All other households | 6.8 | 6.0 | 5.2 | 6.4 | 6.7 | 6.1 | [3.8] | ||
| Total households | 143.3 | 139.6 | 142.4 | 139.7 | 138.8 | 137.3 | 138.8 | ||
| South-East | |||||||||
| Single person household | 43.2 | 37.4 | 37.6 | 44.1 | 40.9 | 46.5 | 47.2 | ||
| Couple with no children household (with/without other persons) | 40.9 | 41.3 | 41.1 | 45.0 | 42.7 | 43.1 | 41.7 | ||
| Couple with children household (with/without other persons) | 67.1 | 68.8 | 71.9 | 71.1 | 72.7 | 70.4 | 71.4 | ||
| Lone parent household (with/without other persons) | 26.1 | 24.0 | 22.8 | 21.6 | 21.4 | 23.2 | 22.5 | ||
| Two or more family unit household (with/without other persons) | [2.5] | [2.7] | [2.2] | * | * | * | * | ||
| All other households | 5.9 | 8.4 | 6.3 | 6.6 | 6.7 | 6.3 | 6.5 | ||
| Total households | 185.6 | 182.5 | 181.9 | 190.2 | 186.3 | 191.4 | 191.5 | ||
| South-West | |||||||||
| Single person household | 59.6 | 60.4 | 57.4 | 59.1 | 57.5 | 60.4 | 61.8 | ||
| Couple with no children household (with/without other persons) | 53.3 | 52.2 | 52.1 | 53.7 | 51.4 | 54.8 | 51.3 | ||
| Couple with children household (with/without other persons) | 92.7 | 94.2 | 91.8 | 94.5 | 93.9 | 92.1 | 95.9 | ||
| Lone parent household (with/without other persons) | 27.1 | 27.3 | 30.0 | 29.2 | 29.3 | 26.6 | 27.0 | ||
| Two or more family unit household (with/without other persons) | [2.1] | [2.2] | [2.5] | * | [2.6] | [2.7] | * | ||
| All other households | 13.0 | 12.4 | 12.7 | 12.4 | 14.0 | 11.1 | 8.8 | ||
| Total households | 247.8 | 248.6 | 246.6 | 250.9 | 248.7 | 247.6 | 247.2 | ||
| State | |||||||||
| Single person household | 379.3 | 362.7 | 366.3 | 381.1 | 378.9 | 384.4 | 412.6 | ||
| Couple with no children household (with/without other persons) | 356.7 | 360.4 | 363.3 | 370.3 | 366.5 | 365.3 | 370.8 | ||
| Couple with children household (with/without other persons) | 631.7 | 638.2 | 632.2 | 642.3 | 641.1 | 645.3 | 644.2 | ||
| Lone parent household (with/without other persons) | 200.7 | 202.6 | 202.7 | 195.7 | 193.4 | 191.1 | 195.3 | ||
| Two or more family unit household (with/without other persons) | 20.9 | 20.5 | 22.0 | 19.5 | 20.8 | 24.1 | 26.5 | ||
| All other households | 85.0 | 78.2 | 81.7 | 81.2 | 87.5 | 79.1 | 76.4 | ||
| Total households | 1,674.3 | 1,662.7 | 1,668.3 | 1,690.1 | 1,688.2 | 1,689.3 | 1,725.8 | ||
| Note: The average grossing factor of all members of a household is used to calculate the number of households. The number of households should be treated as indicative only. | |||||||||
| Table 7 Adult members of family units classified by NUTS2 and NUTS3 regions, composition of family unit, ILO Economic Status and sex | ||||||||||
| '000 | ||||||||||
| Region/Family unit type/ILO Economic Status/Sex | Q2 10 | Q2 11 | Q2 12 | Q2 13 | Q2 14 | Q2 15 | Q2 16 | |||
| Border, Midland and Western | ||||||||||
| Couple without children | ||||||||||
| In employment | ||||||||||
| Male | 49.7 | 50.7 | 50.0 | 51.8 | 52.6 | 50.7 | 53.2 | |||
| Female | 44.5 | 47.2 | 44.9 | 42.1 | 41.5 | 40.6 | 45.5 | |||
| Total | 94.2 | 97.9 | 94.9 | 93.9 | 94.1 | 91.3 | 98.7 | |||
| Unemployed | ||||||||||
| Male | 6.9 | 7.2 | 7.1 | 6.0 | 5.3 | [3.9] | [3.5] | |||
| Female | [2.6] | [4.1] | 4.7 | [3.4] | * | * | * | |||
| Total | 9.5 | 11.3 | 11.8 | 9.4 | 7.7 | 5.7 | 6.1 | |||
| Not in the labour force | ||||||||||
| Male | 42.6 | 46.1 | 48.3 | 45.2 | 44.4 | 45.4 | 49.2 | |||
| Female | 49.8 | 50.5 | 54.3 | 56.9 | 58.1 | 56.9 | 58.7 | |||
| Total | 92.4 | 96.5 | 102.6 | 102.1 | 102.5 | 102.3 | 107.9 | |||
| Total | ||||||||||
| Male | 99.2 | 103.9 | 105.4 | 103.0 | 102.2 | 99.9 | 105.9 | |||
| Female | 96.9 | 101.8 | 103.8 | 102.4 | 102.0 | 99.3 | 106.8 | |||
| Total | 196.1 | 205.7 | 209.3 | 205.4 | 204.3 | 199.2 | 212.7 | |||
| Couple with children | ||||||||||
| In employment | ||||||||||
| Male | 133.0 | 131.0 | 126.2 | 135.8 | 139.5 | 147.7 | 142.5 | |||
| Female | 97.6 | 100.2 | 94.7 | 96.5 | 99.2 | 106.9 | 102.1 | |||
| Total | 230.6 | 231.2 | 220.9 | 232.3 | 238.8 | 254.6 | 244.6 | |||
| Unemployed | ||||||||||
| Male | 22.6 | 24.7 | 25.3 | 19.9 | 17.3 | 15.1 | 10.9 | |||
| Female | 8.5 | 9.4 | 11.0 | 10.9 | 8.3 | 6.5 | 5.9 | |||
| Total | 31.1 | 34.1 | 36.3 | 30.8 | 25.6 | 21.6 | 16.9 | |||
| Not in the labour force | ||||||||||
| Male | 29.1 | 28.5 | 28.3 | 24.8 | 23.8 | 20.7 | 21.3 | |||
| Female | 70.8 | 68.5 | 67.4 | 66.9 | 66.8 | 63.8 | 62.9 | |||
| Total | 99.9 | 97.0 | 95.7 | 91.7 | 90.5 | 84.5 | 84.2 | |||
| Total | ||||||||||
| Male | 184.6 | 184.1 | 179.8 | 180.6 | 180.6 | 183.6 | 174.8 | |||
| Female | 177.0 | 178.1 | 173.0 | 174.2 | 174.3 | 177.2 | 170.9 | |||
| Total | 361.6 | 362.2 | 352.8 | 354.8 | 354.9 | 360.8 | 345.6 | |||
| Lone parent | ||||||||||
| In employment | ||||||||||
| Male | [2.5] | [2.4] | [2.6] | [2.9] | [3.2] | * | [4.1] | |||
| Female | 19.5 | 22.3 | 22.4 | 22.9 | 21.1 | 19.5 | 20.9 | |||
| Total | 22.0 | 24.7 | 25.0 | 25.7 | 24.3 | 21.8 | 25.0 | |||
| Unemployed | ||||||||||
| Male | * | * | * | * | * | * | * | |||
| Female | [3.1] | 4.2 | 4.4 | 5.5 | [4.4] | [3.3] | * | |||
| Total | [3.6] | 5.0 | 5.0 | 5.9 | 5.1 | [4.2] | [3.6] | |||
| Not in the labour force | ||||||||||
| Male | [2.5] | [2.9] | [3.2] | [3.2] | [3.4] | 4.8 | [2.7] | |||
| Female | 27.3 | 26.2 | 24.9 | 21.9 | 23.5 | 25.1 | 23.0 | |||
| Total | 29.8 | 29.0 | 28.1 | 25.1 | 26.9 | 29.9 | 25.7 | |||
| Total | ||||||||||
| Male | 5.6 | 6.1 | 6.4 | 6.5 | 7.3 | 8.0 | 7.3 | |||
| Female | 49.9 | 52.6 | 51.7 | 50.3 | 49.1 | 47.9 | 46.9 | |||
| Total | 55.5 | 58.7 | 58.1 | 56.7 | 56.4 | 55.9 | 54.2 | |||
| All family units | ||||||||||
| In employment | ||||||||||
| Male | 185.2 | 184.1 | 178.8 | 190.6 | 195.3 | 200.7 | 199.8 | |||
| Female | 161.6 | 169.7 | 162.0 | 161.4 | 161.9 | 167.0 | 168.5 | |||
| Total | 346.8 | 353.7 | 340.8 | 352.0 | 357.2 | 367.7 | 368.3 | |||
| Unemployed | ||||||||||
| Male | 30.0 | 32.7 | 33.0 | 26.2 | 23.3 | 19.9 | 15.0 | |||
| Female | 14.2 | 17.7 | 20.0 | 19.8 | 15.1 | 11.6 | 11.5 | |||
| Total | 44.2 | 50.4 | 53.0 | 46.1 | 38.4 | 31.5 | 26.5 | |||
| Not in the labour force | ||||||||||
| Male | 74.2 | 77.4 | 79.8 | 73.3 | 71.5 | 70.9 | 73.1 | |||
| Female | 147.9 | 145.1 | 146.5 | 145.6 | 148.4 | 145.8 | 144.6 | |||
| Total | 222.2 | 222.5 | 226.3 | 218.9 | 220.0 | 216.7 | 217.7 | |||
| Total | ||||||||||
| Male | 289.4 | 294.2 | 291.6 | 290.1 | 290.1 | 291.5 | 287.9 | |||
| Female | 323.8 | 332.5 | 328.5 | 326.9 | 325.4 | 324.4 | 324.6 | |||
| Total | 613.3 | 626.7 | 620.2 | 616.9 | 615.5 | 615.9 | 612.5 | |||
| Border | ||||||||||
| Couple without children | ||||||||||
| In employment | ||||||||||
| Male | 19.5 | 19.2 | 17.1 | 19.5 | 19.3 | 18.3 | 22.2 | |||
| Female | 16.3 | 16.7 | 16.2 | 15.5 | 15.7 | 14.0 | 18.1 | |||
| Total | 35.9 | 35.9 | 33.4 | 35.0 | 35.0 | 32.3 | 40.3 | |||
| Unemployed | ||||||||||
| Male | * | * | [3.4] | * | * | * | * | |||
| Female | * | * | * | * | * | * | * | |||
| Total | [3.2] | [3.6] | 5.6 | [2.9] | * | * | * | |||
| Not in the labour force | ||||||||||
| Male | 17.8 | 19.7 | 21.1 | 20.0 | 20.7 | 19.1 | 20.8 | |||
| Female | 22.0 | 21.4 | 22.9 | 24.3 | 25.4 | 23.9 | 25.3 | |||
| Total | 39.7 | 41.1 | 44.0 | 44.2 | 46.1 | 43.0 | 46.1 | |||
| Total | ||||||||||
| Male | 39.6 | 41.2 | 41.6 | 41.3 | 41.8 | 38.8 | 44.3 | |||
| Female | 39.2 | 39.4 | 41.3 | 40.9 | 42.0 | 38.6 | 44.2 | |||
| Total | 78.8 | 80.6 | 83.0 | 82.2 | 83.9 | 77.4 | 88.5 | |||
| Couple with children | ||||||||||
| In employment | ||||||||||
| Male | 54.2 | 53.1 | 48.7 | 53.3 | 54.0 | 56.7 | 54.7 | |||
| Female | 39.7 | 38.7 | 35.0 | 37.5 | 39.1 | 42.8 | 42.5 | |||
| Total | 94.0 | 91.8 | 83.8 | 90.8 | 93.1 | 99.5 | 97.2 | |||
| Unemployed | ||||||||||
| Male | 7.7 | 8.2 | 9.8 | 7.9 | 6.4 | 5.8 | [4.6] | |||
| Female | [2.5] | [3.8] | [3.8] | [4.5] | [3.5] | * | * | |||
| Total | 10.1 | 12.0 | 13.7 | 12.4 | 9.9 | 7.6 | 6.6 | |||
| Not in the labour force | ||||||||||
| Male | 14.2 | 13.5 | 14.2 | 12.5 | 12.0 | 10.4 | 10.1 | |||
| Female | 30.7 | 29.0 | 28.8 | 30.3 | 28.2 | 26.0 | 24.1 | |||
| Total | 44.8 | 42.5 | 43.1 | 42.8 | 40.1 | 36.4 | 34.2 | |||
| Total | ||||||||||
| Male | 76.1 | 74.8 | 72.8 | 73.7 | 72.4 | 72.9 | 69.4 | |||
| Female | 72.9 | 71.5 | 67.7 | 72.2 | 70.8 | 70.7 | 68.6 | |||
| Total | 148.9 | 146.3 | 140.5 | 145.9 | 143.1 | 143.6 | 138.0 | |||
| Lone parent | ||||||||||
| In employment | ||||||||||
| Male | * | * | * | * | * | * | * | |||
| Female | 8.8 | 10.5 | 10.5 | 9.1 | 8.8 | 9.7 | 8.1 | |||
| Total | 9.9 | 11.3 | 11.7 | 9.8 | 10.2 | 10.8 | 9.8 | |||
| Unemployed | ||||||||||
| Male | * | * | * | * | * | * | * | |||
| Female | * | * | * | [2.9] | * | * | * | |||
| Total | * | * | * | [2.9] | * | * | * | |||
| Not in the labour force | ||||||||||
| Male | * | * | * | * | * | [2.6] | * | |||
| Female | 12.3 | 12.8 | 12.0 | 9.7 | 11.4 | 11.8 | 10.2 | |||
| Total | 13.5 | 14.2 | 13.6 | 11.1 | 12.7 | 14.4 | 11.7 | |||
| Total | ||||||||||
| Male | [2.6] | * | [3.2] | * | [3.1] | [4.2] | [3.3] | |||
| Female | 22.7 | 24.9 | 23.9 | 21.7 | 21.7 | 23.1 | 19.0 | |||
| Total | 25.3 | 27.5 | 27.1 | 23.9 | 24.9 | 27.2 | 22.3 | |||
| All family units | ||||||||||
| In employment | ||||||||||
| Male | 74.9 | 73.1 | 67.1 | 73.6 | 74.7 | 76.2 | 78.6 | |||
| Female | 64.9 | 65.9 | 61.7 | 62.1 | 63.5 | 66.4 | 68.7 | |||
| Total | 139.7 | 139.1 | 128.8 | 135.6 | 138.2 | 142.7 | 147.2 | |||
| Unemployed | ||||||||||
| Male | 10.3 | 10.7 | 13.6 | 9.7 | 8.6 | 7.5 | 6.1 | |||
| Female | 5.0 | 6.7 | 7.4 | 8.5 | 6.1 | [4.1] | [3.5] | |||
| Total | 15.2 | 17.4 | 21.1 | 18.2 | 14.7 | 11.6 | 9.7 | |||
| Not in the labour force | ||||||||||
| Male | 33.1 | 34.7 | 36.9 | 34.0 | 34.0 | 32.1 | 32.3 | |||
| Female | 64.9 | 63.2 | 63.7 | 64.2 | 64.9 | 61.8 | 59.7 | |||
| Total | 98.0 | 97.9 | 100.6 | 98.2 | 98.9 | 93.9 | 92.0 | |||
| Total | ||||||||||
| Male | 118.2 | 118.5 | 117.7 | 117.3 | 117.3 | 115.8 | 117.0 | |||
| Female | 134.8 | 135.8 | 132.9 | 134.7 | 134.5 | 132.3 | 131.8 | |||
| Total | 253.0 | 254.3 | 250.5 | 252.0 | 251.8 | 248.2 | 248.9 | |||
| Midland | ||||||||||
| Couple without children | ||||||||||
| In employment | ||||||||||
| Male | 11.5 | 12.7 | 11.3 | 11.7 | 13.4 | 13.6 | 10.7 | |||
| Female | 9.5 | 11.8 | 9.1 | 9.7 | 10.6 | 11.4 | 9.6 | |||
| Total | 21.0 | 24.5 | 20.4 | 21.3 | 24.0 | 25.0 | 20.3 | |||
| Unemployed | ||||||||||
| Male | * | * | * | * | * | * | * | |||
| Female | * | * | * | * | * | * | * | |||
| Total | [3.5] | [3.4] | [2.8] | * | * | * | * | |||
| Not in the labour force | ||||||||||
| Male | 10.2 | 9.2 | 10.0 | 10.2 | 9.4 | 10.1 | 11.5 | |||
| Female | 12.3 | 10.2 | 12.3 | 13.2 | 11.9 | 13.0 | 12.3 | |||
| Total | 22.5 | 19.4 | 22.3 | 23.5 | 21.3 | 23.2 | 23.8 | |||
| Total | ||||||||||
| Male | 24.1 | 23.9 | 23.0 | 23.7 | 23.8 | 24.8 | 23.0 | |||
| Female | 22.9 | 23.4 | 22.4 | 23.9 | 22.8 | 24.9 | 22.3 | |||
| Total | 47.0 | 47.3 | 45.5 | 47.6 | 46.6 | 49.8 | 45.3 | |||
| Couple with children | ||||||||||
| In employment | ||||||||||
| Male | 30.9 | 30.2 | 30.7 | 32.3 | 34.9 | 35.3 | 37.1 | |||
| Female | 20.9 | 22.7 | 23.3 | 23.4 | 23.9 | 23.1 | 23.1 | |||
| Total | 51.8 | 52.9 | 54.0 | 55.7 | 58.8 | 58.4 | 60.1 | |||
| Unemployed | ||||||||||
| Male | 6.0 | 6.9 | 6.5 | 5.8 | 5.1 | [4.4] | * | |||
| Female | * | * | [3.2] | [3.0] | * | * | * | |||
| Total | 8.1 | 8.7 | 9.7 | 8.7 | 7.0 | 6.1 | [4.0] | |||
| Not in the labour force | ||||||||||
| Male | 6.4 | 7.4 | 6.4 | 5.8 | 4.8 | [3.9] | [4.7] | |||
| Female | 17.8 | 18.1 | 18.4 | 16.2 | 17.4 | 16.2 | 17.3 | |||
| Total | 24.2 | 25.4 | 24.8 | 22.0 | 22.2 | 20.0 | 22.0 | |||
| Total | ||||||||||
| Male | 43.3 | 44.5 | 43.5 | 43.8 | 44.7 | 43.5 | 44.0 | |||
| Female | 40.8 | 42.6 | 44.9 | 42.5 | 43.3 | 41.0 | 42.1 | |||
| Total | 84.1 | 87.1 | 88.5 | 86.4 | 88.0 | 84.5 | 86.1 | |||
| Lone parent | ||||||||||
| In employment | ||||||||||
| Male | * | * | * | * | * | * | * | |||
| Female | 4.1 | 4.5 | 5.0 | 4.7 | 5.0 | 4.4 | 5.9 | |||
| Total | 4.8 | 5.1 | 5.5 | 5.8 | 5.8 | 4.8 | 7.0 | |||
| Unemployed | ||||||||||
| Male | * | * | * | * | * | * | * | |||
| Female | * | * | * | * | * | * | * | |||
| Total | * | * | * | * | * | * | * | |||
| Not in the labour force | ||||||||||
| Male | * | * | * | * | * | * | * | |||
| Female | 6.8 | 6.6 | 5.5 | 5.1 | 5.2 | 4.9 | 4.9 | |||
| Total | 7.3 | 7.0 | 6.2 | 6.0 | 5.9 | 6.1 | 5.4 | |||
| Total | ||||||||||
| Male | * | * | * | * | * | * | * | |||
| Female | 11.4 | 11.8 | 11.6 | 10.8 | 11.6 | 10.3 | 11.7 | |||
| Total | 12.7 | 13.1 | 13.0 | 13.0 | 13.1 | 12.2 | 13.3 | |||
| All family units | ||||||||||
| In employment | ||||||||||
| Male | 43.0 | 43.6 | 42.5 | 45.0 | 49.0 | 49.4 | 48.9 | |||
| Female | 34.4 | 38.9 | 37.4 | 37.8 | 39.5 | 38.8 | 38.5 | |||
| Total | 77.5 | 82.5 | 79.9 | 82.8 | 88.6 | 88.2 | 87.4 | |||
| Unemployed | ||||||||||
| Male | 8.5 | 9.1 | 8.4 | 7.8 | 6.2 | 5.6 | * | |||
| Female | 3.8 | [4.1] | 5.4 | 4.9 | [3.6] | [3.3] | * | |||
| Total | 12.3 | 13.2 | 13.8 | 12.7 | 9.8 | 9.0 | 6.2 | |||
| Not in the labour force | ||||||||||
| Male | 17.1 | 16.9 | 17.0 | 16.9 | 14.8 | 15.2 | 16.8 | |||
| Female | 36.8 | 34.9 | 36.3 | 34.5 | 34.6 | 34.1 | 34.4 | |||
| Total | 54.0 | 51.8 | 53.3 | 51.4 | 49.4 | 49.3 | 51.2 | |||
| Total | ||||||||||
| Male | 68.7 | 69.6 | 67.9 | 69.7 | 70.1 | 70.2 | 68.6 | |||
| Female | 75.1 | 77.9 | 79.0 | 77.2 | 77.7 | 76.2 | 76.1 | |||
| Total | 143.8 | 147.5 | 146.9 | 146.9 | 147.8 | 146.5 | 144.7 | |||
| West | ||||||||||
| Couple without children | ||||||||||
| In employment | ||||||||||
| Male | 18.6 | 18.8 | 21.5 | 20.6 | 19.9 | 18.7 | 20.3 | |||
| Female | 18.7 | 18.7 | 19.6 | 16.9 | 15.2 | 15.3 | 17.8 | |||
| Total | 37.4 | 37.5 | 41.1 | 37.6 | 35.1 | 34.0 | 38.1 | |||
| Unemployed | ||||||||||
| Male | [2.3] | [2.9] | * | * | * | * | * | |||
| Female | * | * | * | * | * | * | * | |||
| Total | [2.8] | 4.3 | [3.4] | [3.7] | [3.6] | * | * | |||
| Not in the labour force | ||||||||||
| Male | 14.7 | 17.2 | 17.3 | 15.0 | 14.3 | 16.2 | 16.8 | |||
| Female | 15.5 | 18.9 | 19.0 | 19.4 | 20.8 | 19.9 | 21.2 | |||
| Total | 30.2 | 36.0 | 36.3 | 34.4 | 35.1 | 36.1 | 38.0 | |||
| Total | ||||||||||
| Male | 35.6 | 38.9 | 40.8 | 38.0 | 36.6 | 36.3 | 38.6 | |||
| Female | 34.8 | 38.9 | 40.1 | 37.7 | 37.2 | 35.7 | 40.2 | |||
| Total | 70.3 | 77.8 | 80.8 | 75.7 | 73.8 | 72.0 | 78.8 | |||
| Couple with children | ||||||||||
| In employment | ||||||||||
| Male | 47.9 | 47.7 | 46.8 | 50.3 | 50.7 | 55.7 | 50.8 | |||
| Female | 37.0 | 38.8 | 36.3 | 35.6 | 36.2 | 41.0 | 36.6 | |||
| Total | 84.9 | 86.4 | 83.1 | 85.9 | 86.9 | 96.7 | 87.3 | |||
| Unemployed | ||||||||||
| Male | 8.9 | 9.6 | 9.0 | 6.2 | 5.8 | [5.0] | [4.1] | |||
| Female | 4.0 | [3.7] | 3.9 | [3.5] | [2.8] | * | * | |||
| Total | 12.9 | 13.4 | 12.9 | 9.7 | 8.6 | 7.9 | 6.3 | |||
| Not in the labour force | ||||||||||
| Male | 8.5 | 7.6 | 7.7 | 6.5 | 7.0 | 6.5 | 6.5 | |||
| Female | 22.4 | 21.4 | 20.2 | 20.4 | 21.2 | 21.6 | 21.5 | |||
| Total | 30.9 | 29.0 | 27.8 | 26.9 | 28.2 | 28.1 | 28.0 | |||
| Total | ||||||||||
| Male | 65.3 | 64.9 | 63.5 | 63.0 | 63.5 | 67.2 | 61.4 | |||
| Female | 63.4 | 64.0 | 60.4 | 59.5 | 60.2 | 65.5 | 60.2 | |||
| Total | 128.6 | 128.8 | 123.9 | 122.5 | 123.7 | 132.7 | 121.5 | |||
| Lone parent | ||||||||||
| In employment | ||||||||||
| Male | * | * | * | * | * | * | * | |||
| Female | 6.5 | 7.3 | 7.0 | 9.1 | 7.4 | 5.5 | 6.9 | |||
| Total | 7.4 | 8.2 | 7.8 | 10.1 | 8.3 | 6.1 | 8.3 | |||
| Unemployed | ||||||||||
| Male | * | * | * | * | * | * | * | |||
| Female | * | * | * | * | * | * | * | |||
| Total | * | * | * | * | * | * | * | |||
| Not in the labour force | ||||||||||
| Male | * | * | * | * | * | * | * | |||
| Female | 8.3 | 6.8 | 7.4 | 7.1 | 6.9 | 8.4 | 7.9 | |||
| Total | 9.1 | 7.8 | 8.3 | 8.0 | 8.4 | 9.3 | 8.6 | |||
| Total | ||||||||||
| Male | * | * | * | * | [2.6] | * | * | |||
| Female | 15.8 | 15.9 | 16.2 | 17.8 | 15.7 | 14.6 | 16.2 | |||
| Total | 17.5 | 18.2 | 18.0 | 19.9 | 18.3 | 16.5 | 18.6 | |||
| All family units | ||||||||||
| In employment | ||||||||||
| Male | 67.3 | 67.3 | 69.2 | 72.0 | 71.5 | 75.1 | 72.4 | |||
| Female | 62.3 | 64.8 | 62.9 | 61.6 | 58.8 | 61.7 | 61.3 | |||
| Total | 129.6 | 132.2 | 132.1 | 133.5 | 130.4 | 136.8 | 133.7 | |||
| Unemployed | ||||||||||
| Male | 11.2 | 12.9 | 11.0 | 8.7 | 8.5 | 6.8 | 5.9 | |||
| Female | 5.5 | 6.9 | 7.2 | 6.5 | 5.4 | [4.2] | [4.8] | |||
| Total | 16.7 | 19.8 | 18.2 | 15.2 | 13.9 | 10.9 | 10.7 | |||
| Not in the labour force | ||||||||||
| Male | 24.0 | 25.8 | 25.9 | 22.4 | 22.7 | 23.6 | 24.0 | |||
| Female | 46.2 | 47.1 | 46.6 | 46.9 | 48.9 | 49.9 | 50.6 | |||
| Total | 70.2 | 72.8 | 72.4 | 69.3 | 71.7 | 73.5 | 74.6 | |||
| Total | ||||||||||
| Male | 102.5 | 106.0 | 106.0 | 103.1 | 102.7 | 105.4 | 102.3 | |||
| Female | 113.9 | 118.8 | 116.7 | 114.9 | 113.1 | 115.8 | 116.6 | |||
| Total | 216.5 | 224.8 | 222.7 | 218.0 | 215.9 | 221.2 | 219.0 | |||
| Southern and Eastern | ||||||||||
| Couple without children | ||||||||||
| In employment | ||||||||||
| Male | 147.8 | 144.0 | 140.2 | 139.7 | 141.8 | 146.5 | 151.6 | |||
| Female | 132.2 | 127.6 | 122.5 | 124.9 | 126.1 | 126.7 | 132.4 | |||
| Total | 279.9 | 271.6 | 262.7 | 264.6 | 267.9 | 273.2 | 284.0 | |||
| Unemployed | ||||||||||
| Male | 16.4 | 16.1 | 15.2 | 14.5 | 12.9 | 11.4 | 8.0 | |||
| Female | 10.1 | 9.0 | 7.9 | 7.7 | 7.8 | 7.1 | 6.7 | |||
| Total | 26.5 | 25.1 | 23.1 | 22.2 | 20.7 | 18.5 | 14.7 | |||
| Not in the labour force | ||||||||||
| Male | 111.7 | 111.1 | 119.2 | 126.0 | 122.8 | 123.1 | 120.6 | |||
| Female | 121.5 | 129.0 | 137.7 | 144.1 | 138.2 | 140.0 | 139.3 | |||
| Total | 233.2 | 240.1 | 256.9 | 270.1 | 260.9 | 263.1 | 259.8 | |||
| Total | ||||||||||
| Male | 275.8 | 271.2 | 274.6 | 280.1 | 277.4 | 280.9 | 280.1 | |||
| Female | 263.7 | 265.6 | 268.1 | 276.8 | 272.0 | 273.9 | 278.4 | |||
| Total | 539.5 | 536.8 | 542.7 | 556.9 | 549.5 | 554.8 | 558.6 | |||
| Couple with children | ||||||||||
| In employment | ||||||||||
| Male | 374.5 | 369.2 | 377.3 | 384.4 | 393.1 | 404.4 | 402.3 | |||
| Female | 267.3 | 272.2 | 276.1 | 281.4 | 288.2 | 297.5 | 300.0 | |||
| Total | 641.8 | 641.4 | 653.4 | 665.9 | 681.3 | 701.9 | 702.3 | |||
| Unemployed | ||||||||||
| Male | 54.9 | 55.9 | 58.2 | 51.6 | 40.5 | 33.3 | 29.6 | |||
| Female | 19.1 | 24.2 | 25.3 | 27.9 | 21.4 | 18.9 | 17.1 | |||
| Total | 74.0 | 80.1 | 83.5 | 79.5 | 61.8 | 52.2 | 46.7 | |||
| Not in the labour force | ||||||||||
| Male | 59.4 | 68.5 | 65.2 | 60.6 | 59.9 | 60.8 | 59.9 | |||
| Female | 178.3 | 184.9 | 179.8 | 177.2 | 173.2 | 169.4 | 172.2 | |||
| Total | 237.6 | 253.4 | 245.0 | 237.7 | 233.1 | 230.2 | 232.2 | |||
| Total | ||||||||||
| Male | 488.8 | 493.6 | 500.6 | 496.6 | 493.5 | 498.5 | 491.8 | |||
| Female | 464.7 | 481.2 | 481.2 | 486.5 | 482.7 | 485.8 | 489.3 | |||
| Total | 953.5 | 974.8 | 981.8 | 983.1 | 976.2 | 984.3 | 981.1 | |||
| Lone parent | ||||||||||
| In employment | ||||||||||
| Male | 8.9 | 9.0 | 7.8 | 8.9 | 9.7 | 9.8 | 10.2 | |||
| Female | 63.3 | 63.7 | 64.5 | 64.6 | 61.3 | 66.4 | 71.4 | |||
| Total | 72.1 | 72.7 | 72.3 | 73.5 | 71.0 | 76.2 | 81.6 | |||
| Unemployed | ||||||||||
| Male | [2.4] | [2.9] | [2.6] | [2.9] | * | * | * | |||
| Female | 11.8 | 13.1 | 13.8 | 14.9 | 10.3 | 10.9 | 7.7 | |||
| Total | 14.2 | 16.0 | 16.4 | 17.8 | 13.1 | 12.6 | 9.3 | |||
| Not in the labour force | ||||||||||
| Male | 8.9 | 9.0 | 9.6 | 8.5 | 9.6 | 7.2 | 8.8 | |||
| Female | 73.5 | 69.5 | 72.7 | 62.4 | 67.6 | 67.0 | 66.8 | |||
| Total | 82.4 | 78.5 | 82.3 | 70.8 | 77.3 | 74.2 | 75.6 | |||
| Total | ||||||||||
| Male | 20.2 | 20.9 | 20.0 | 20.3 | 22.1 | 18.8 | 20.6 | |||
| Female | 148.5 | 146.2 | 151.0 | 141.8 | 139.2 | 144.3 | 145.9 | |||
| Total | 168.7 | 167.1 | 171.0 | 162.1 | 161.3 | 163.1 | 166.5 | |||
| All family units | ||||||||||
| In employment | ||||||||||
| Male | 531.1 | 522.2 | 525.2 | 533.0 | 544.6 | 560.7 | 564.1 | |||
| Female | 462.8 | 463.5 | 463.2 | 470.9 | 475.5 | 490.6 | 503.8 | |||
| Total | 993.9 | 985.6 | 988.4 | 1,003.9 | 1,020.2 | 1,051.3 | 1,067.8 | |||
| Unemployed | ||||||||||
| Male | 73.7 | 74.9 | 76.0 | 68.9 | 56.1 | 46.3 | 39.1 | |||
| Female | 41.0 | 46.2 | 47.1 | 50.5 | 39.4 | 37.0 | 31.5 | |||
| Total | 114.7 | 121.1 | 123.0 | 119.5 | 95.6 | 83.3 | 70.6 | |||
| Not in the labour force | ||||||||||
| Male | 179.9 | 188.6 | 194.0 | 195.0 | 192.3 | 191.1 | 189.3 | |||
| Female | 373.2 | 383.4 | 390.1 | 383.6 | 379.0 | 376.4 | 378.3 | |||
| Total | 553.1 | 572.0 | 584.1 | 578.7 | 571.3 | 567.6 | 567.6 | |||
| Total | ||||||||||
| Male | 784.8 | 785.7 | 795.2 | 797.0 | 793.1 | 798.2 | 792.5 | |||
| Female | 876.9 | 893.0 | 900.4 | 905.1 | 893.9 | 904.0 | 913.6 | |||
| Total | 1,661.7 | 1,678.7 | 1,695.6 | 1,702.0 | 1,687.0 | 1,702.2 | 1,706.1 | |||
| Dublin | ||||||||||
| Couple without children | ||||||||||
| In employment | ||||||||||
| Male | 55.3 | 57.4 | 52.2 | 56.2 | 61.3 | 58.7 | 66.1 | |||
| Female | 48.0 | 51.4 | 47.4 | 50.0 | 55.6 | 51.7 | 56.7 | |||
| Total | 103.3 | 108.7 | 99.6 | 106.1 | 116.9 | 110.5 | 122.8 | |||
| Unemployed | ||||||||||
| Male | [4.7] | [5.2] | [4.8] | [5.2] | [3.9] | [4.1] | * | |||
| Female | [3.4] | * | * | * | * | * | * | |||
| Total | 8.1 | 8.2 | 7.3 | 7.7 | 6.0 | 5.8 | [6.6] | |||
| Not in the labour force | ||||||||||
| Male | 40.3 | 38.8 | 41.0 | 43.6 | 40.8 | 46.8 | 43.2 | |||
| Female | 44.4 | 46.3 | 47.5 | 50.9 | 44.5 | 49.5 | 51.7 | |||
| Total | 84.7 | 85.1 | 88.5 | 94.4 | 85.3 | 96.3 | 94.9 | |||
| Total | ||||||||||
| Male | 100.3 | 101.3 | 98.0 | 105.0 | 106.0 | 109.7 | 112.4 | |||
| Female | 95.8 | 100.7 | 97.4 | 103.2 | 102.2 | 103.0 | 111.9 | |||
| Total | 196.1 | 202.1 | 195.4 | 208.2 | 208.2 | 212.6 | 224.3 | |||
| Couple with children | ||||||||||
| In employment | ||||||||||
| Male | 139.1 | 134.9 | 134.4 | 137.0 | 141.4 | 147.4 | 137.5 | |||
| Female | 98.5 | 99.4 | 100.6 | 103.7 | 102.0 | 106.8 | 109.1 | |||
| Total | 237.6 | 234.3 | 235.1 | 240.6 | 243.4 | 254.2 | 246.6 | |||
| Unemployed | ||||||||||
| Male | 15.3 | 14.7 | 17.5 | 16.5 | 12.8 | 10.1 | 11.3 | |||
| Female | 5.2 | 6.6 | 8.3 | 8.5 | 8.1 | 6.5 | [6.1] | |||
| Total | 20.5 | 21.3 | 25.8 | 25.0 | 20.9 | 16.7 | 17.5 | |||
| Not in the labour force | ||||||||||
| Male | 23.4 | 27.3 | 26.8 | 24.7 | 24.7 | 24.7 | 21.0 | |||
| Female | 65.4 | 67.2 | 64.9 | 65.7 | 63.3 | 63.0 | 56.7 | |||
| Total | 88.8 | 94.5 | 91.7 | 90.5 | 88.0 | 87.7 | 77.8 | |||
| Total | ||||||||||
| Male | 177.8 | 176.8 | 178.7 | 178.2 | 178.9 | 182.2 | 169.9 | |||
| Female | 169.1 | 173.2 | 173.8 | 177.9 | 173.4 | 176.3 | 172.0 | |||
| Total | 346.8 | 350.0 | 352.5 | 356.1 | 352.3 | 358.6 | 341.8 | |||
| Lone parent | ||||||||||
| In employment | ||||||||||
| Male | [3.4] | [3.3] | [2.9] | [3.8] | [3.3] | [3.8] | [5.2] | |||
| Female | 28.1 | 26.4 | 28.9 | 28.2 | 26.7 | 29.3 | 29.9 | |||
| Total | 31.5 | 29.6 | 31.9 | 32.0 | 30.0 | 33.1 | 35.1 | |||
| Unemployed | ||||||||||
| Male | * | * | * | * | * | * | * | |||
| Female | [4.2] | 5.4 | [4.2] | 6.0 | [3.7] | [3.1] | * | |||
| Total | 4.8 | 6.6 | 5.2 | 7.0 | 4.9 | [3.8] | [3.5] | |||
| Not in the labour force | ||||||||||
| Male | 4.1 | [2.6] | 4.8 | [3.9] | [3.9] | * | [3.8] | |||
| Female | 33.6 | 29.9 | 31.1 | 26.5 | 26.6 | 29.9 | 29.8 | |||
| Total | 37.7 | 32.5 | 35.9 | 30.4 | 30.5 | 32.6 | 33.6 | |||
| Total | ||||||||||
| Male | 8.2 | 7.1 | 8.7 | 8.7 | 8.4 | 7.3 | 9.4 | |||
| Female | 65.9 | 61.7 | 64.2 | 60.7 | 57.0 | 62.2 | 62.8 | |||
| Total | 74.1 | 68.8 | 72.9 | 69.4 | 65.4 | 69.5 | 72.2 | |||
| All family units | ||||||||||
| In employment | ||||||||||
| Male | 197.8 | 195.5 | 189.5 | 197.0 | 206.0 | 209.9 | 208.8 | |||
| Female | 174.6 | 177.1 | 177.0 | 181.8 | 184.3 | 187.9 | 195.8 | |||
| Total | 372.5 | 372.7 | 366.5 | 378.8 | 390.3 | 397.8 | 404.5 | |||
| Unemployed | ||||||||||
| Male | 20.6 | 21.1 | 23.3 | 22.7 | 17.9 | 15.0 | 14.9 | |||
| Female | 12.8 | 15.1 | 15.0 | 17.0 | 13.9 | 11.3 | 12.7 | |||
| Total | 33.4 | 36.2 | 38.3 | 39.7 | 31.8 | 26.4 | 27.5 | |||
| Not in the labour force | ||||||||||
| Male | 67.8 | 68.7 | 72.6 | 72.2 | 69.3 | 74.2 | 68.0 | |||
| Female | 143.4 | 143.4 | 143.5 | 143.1 | 134.4 | 142.3 | 138.2 | |||
| Total | 211.2 | 212.1 | 216.0 | 215.3 | 203.7 | 216.6 | 206.2 | |||
| Total | ||||||||||
| Male | 286.3 | 285.3 | 285.4 | 291.9 | 293.3 | 299.2 | 291.6 | |||
| Female | 330.8 | 335.6 | 335.4 | 341.8 | 332.6 | 341.5 | 346.7 | |||
| Total | 617.0 | 620.9 | 620.9 | 633.7 | 625.9 | 640.7 | 638.3 | |||
| Mid-East | ||||||||||
| Couple without children | ||||||||||
| In employment | ||||||||||
| Male | 26.4 | 23.4 | 25.3 | 21.4 | 21.3 | 20.8 | 22.5 | |||
| Female | 24.3 | 19.9 | 20.8 | 18.8 | 18.4 | 18.1 | 21.6 | |||
| Total | 50.6 | 43.4 | 46.1 | 40.2 | 39.7 | 39.0 | 44.1 | |||
| Unemployed | ||||||||||
| Male | 3.7 | * | [2.8] | * | * | * | * | |||
| Female | * | * | * | * | * | * | * | |||
| Total | 5.3 | 4.2 | 4.4 | * | [3.7] | * | * | |||
| Not in the labour force | ||||||||||
| Male | 14.3 | 14.2 | 16.4 | 16.8 | 17.9 | 17.1 | 18.3 | |||
| Female | 16.4 | 16.2 | 20.5 | 20.2 | 21.5 | 19.9 | 18.3 | |||
| Total | 30.6 | 30.4 | 36.9 | 37.0 | 39.4 | 37.0 | 36.6 | |||
| Total | ||||||||||
| Male | 44.3 | 40.0 | 44.5 | 40.0 | 41.6 | 38.8 | 41.7 | |||
| Female | 42.2 | 37.9 | 42.9 | 39.9 | 41.2 | 39.5 | 40.8 | |||
| Total | 86.5 | 78.0 | 87.4 | 79.9 | 82.8 | 78.3 | 82.5 | |||
| Couple with children | ||||||||||
| In employment | ||||||||||
| Male | 67.2 | 70.1 | 69.9 | 73.0 | 73.1 | 74.4 | 75.1 | |||
| Female | 47.5 | 48.1 | 48.1 | 48.6 | 51.6 | 53.8 | 51.6 | |||
| Total | 114.6 | 118.2 | 118.0 | 121.6 | 124.7 | 128.2 | 126.7 | |||
| Unemployed | ||||||||||
| Male | 8.7 | 9.8 | 10.0 | 10.6 | 6.6 | [4.8] | [4.2] | |||
| Female | 3.5 | [2.9] | 4.5 | 6.0 | [3.4] | [3.2] | * | |||
| Total | 12.2 | 12.7 | 14.5 | 16.5 | 10.0 | 8.0 | 7.9 | |||
| Not in the labour force | ||||||||||
| Male | 8.4 | 8.9 | 9.5 | 8.2 | 8.3 | 11.5 | 11.1 | |||
| Female | 29.5 | 33.9 | 33.3 | 34.4 | 33.1 | 31.3 | 31.9 | |||
| Total | 38.0 | 42.9 | 42.8 | 42.6 | 41.3 | 42.8 | 43.0 | |||
| Total | ||||||||||
| Male | 84.3 | 88.9 | 89.4 | 91.8 | 88.0 | 90.7 | 90.4 | |||
| Female | 80.5 | 84.9 | 86.0 | 89.0 | 88.0 | 88.3 | 87.2 | |||
| Total | 164.8 | 173.8 | 175.3 | 180.8 | 176.0 | 179.0 | 177.6 | |||
| Lone parent | ||||||||||
| In employment | ||||||||||
| Male | * | * | * | * | * | * | * | |||
| Female | 8.5 | 10.4 | 8.0 | 8.9 | 9.6 | 10.5 | 12.1 | |||
| Total | 9.9 | 11.7 | 9.0 | 9.7 | 11.2 | 11.9 | 12.6 | |||
| Unemployed | ||||||||||
| Male | * | * | * | * | * | * | * | |||
| Female | [1.9] | * | [2.4] | * | * | * | * | |||
| Total | [2.3] | [2.3] | [2.9] | [2.8] | * | * | * | |||
| Not in the labour force | ||||||||||
| Male | * | * | * | * | * | * | * | |||
| Female | 8.1 | 9.6 | 10.0 | 8.5 | 9.8 | 9.3 | 8.9 | |||
| Total | 9.2 | 11.1 | 11.1 | 9.3 | 11.0 | 10.4 | 9.7 | |||
| Total | ||||||||||
| Male | [3.0] | [3.2] | * | * | [3.2] | * | * | |||
| Female | 18.4 | 21.9 | 20.5 | 19.6 | 20.8 | 21.2 | 21.7 | |||
| Total | 21.4 | 25.1 | 22.9 | 21.8 | 24.1 | 24.0 | 23.1 | |||
| All family units | ||||||||||
| In employment | ||||||||||
| Male | 95.0 | 94.9 | 96.1 | 95.1 | 96.1 | 96.7 | 98.1 | |||
| Female | 80.2 | 78.4 | 77.0 | 76.4 | 79.6 | 82.4 | 85.3 | |||
| Total | 175.2 | 173.3 | 173.0 | 171.5 | 175.7 | 179.0 | 183.4 | |||
| Unemployed | ||||||||||
| Male | 12.8 | 12.7 | 13.2 | 13.0 | 9.4 | 5.8 | [5.3] | |||
| Female | 7.0 | 6.6 | 8.5 | 9.0 | 6.0 | 6.1 | [5.1] | |||
| Total | 19.7 | 19.3 | 21.8 | 22.1 | 15.4 | 12.0 | 10.4 | |||
| Not in the labour force | ||||||||||
| Male | 23.8 | 24.6 | 27.0 | 25.8 | 27.4 | 29.8 | 30.1 | |||
| Female | 54.0 | 59.7 | 63.8 | 63.1 | 64.4 | 60.5 | 59.2 | |||
| Total | 77.8 | 84.3 | 90.8 | 88.9 | 91.8 | 90.3 | 89.3 | |||
| Total | ||||||||||
| Male | 131.6 | 132.1 | 136.3 | 134.0 | 132.8 | 132.3 | 133.5 | |||
| Female | 141.2 | 144.8 | 149.3 | 148.5 | 150.1 | 149.0 | 149.7 | |||
| Total | 272.8 | 276.9 | 285.6 | 282.5 | 282.9 | 281.3 | 283.2 | |||
| Mid-West | ||||||||||
| Couple without children | ||||||||||
| In employment | ||||||||||
| Male | 15.7 | 17.3 | 18.0 | 16.0 | 14.5 | 15.5 | 15.3 | |||
| Female | 15.6 | 15.3 | 15.3 | 14.2 | 12.5 | 13.9 | 15.3 | |||
| Total | 31.3 | 32.6 | 33.3 | 30.2 | 27.0 | 29.4 | 30.6 | |||
| Unemployed | ||||||||||
| Male | [2.6] | [2.4] | [2.2] | * | * | * | * | |||
| Female | * | * | * | * | * | * | * | |||
| Total | 4.2 | 3.8 | 3.5 | [2.8] | * | * | * | |||
| Not in the labour force | ||||||||||
| Male | 14.2 | 13.2 | 14.8 | 17.2 | 16.7 | 15.2 | 14.7 | |||
| Female | 14.1 | 15.3 | 17.2 | 17.2 | 19.3 | 16.5 | 16.2 | |||
| Total | 28.3 | 28.4 | 32.0 | 34.4 | 36.0 | 31.7 | 31.0 | |||
| Total | ||||||||||
| Male | 32.4 | 32.9 | 35.0 | 34.9 | 32.0 | 32.7 | 31.0 | |||
| Female | 31.4 | 32.0 | 33.8 | 32.6 | 32.9 | 31.3 | 32.2 | |||
| Total | 63.8 | 64.9 | 68.8 | 67.4 | 64.9 | 64.0 | 63.1 | |||
| Couple with children | ||||||||||
| In employment | ||||||||||
| Male | 41.2 | 42.5 | 41.8 | 42.9 | 42.8 | 47.7 | 46.5 | |||
| Female | 30.1 | 32.6 | 31.2 | 32.4 | 31.8 | 34.6 | 35.0 | |||
| Total | 71.3 | 75.1 | 72.9 | 75.4 | 74.6 | 82.3 | 81.4 | |||
| Unemployed | ||||||||||
| Male | 7.4 | 6.9 | 6.8 | 6.7 | 5.4 | [3.7] | * | |||
| Female | 3.0 | 4.5 | 3.1 | 3.8 | [3.4] | [3.0] | * | |||
| Total | 10.4 | 11.4 | 10.0 | 10.5 | 8.8 | 6.8 | [4.7] | |||
| Not in the labour force | ||||||||||
| Male | 7.5 | 6.8 | 6.3 | 6.1 | 6.0 | 7.6 | 7.5 | |||
| Female | 21.4 | 17.9 | 18.6 | 16.8 | 17.9 | 18.9 | 20.6 | |||
| Total | 28.9 | 24.7 | 24.9 | 22.9 | 23.9 | 26.5 | 28.1 | |||
| Total | ||||||||||
| Male | 56.1 | 56.1 | 54.9 | 55.8 | 54.3 | 59.0 | 56.6 | |||
| Female | 54.5 | 55.0 | 52.9 | 53.0 | 53.1 | 56.5 | 57.7 | |||
| Total | 110.6 | 111.1 | 107.8 | 108.8 | 107.4 | 115.5 | 114.3 | |||
| Lone parent | ||||||||||
| In employment | ||||||||||
| Male | * | * | * | * | * | * | * | |||
| Female | 4.4 | 5.8 | 5.2 | 5.7 | 5.3 | 5.8 | 5.8 | |||
| Total | 5.6 | 7.0 | 6.0 | 6.8 | 7.0 | 7.0 | 7.1 | |||
| Unemployed | ||||||||||
| Male | * | * | * | * | * | * | * | |||
| Female | * | * | * | * | * | * | * | |||
| Total | [1.7] | [1.9] | [2.2] | * | * | * | * | |||
| Not in the labour force | ||||||||||
| Male | * | * | * | * | * | * | * | |||
| Female | 7.0 | 5.9 | 7.2 | 5.9 | 6.7 | [5.0] | 6.4 | |||
| Total | 8.2 | 7.0 | 8.1 | 7.0 | 7.9 | 5.7 | 7.2 | |||
| Total | ||||||||||
| Male | [2.8] | [2.6] | [2.1] | [2.4] | [3.2] | * | * | |||
| Female | 12.7 | 13.3 | 14.2 | 13.5 | 13.4 | 12.7 | 13.2 | |||
| Total | 15.5 | 15.9 | 16.3 | 15.8 | 16.6 | 14.8 | 15.7 | |||
| All family units | ||||||||||
| In employment | ||||||||||
| Male | 58.2 | 61.0 | 60.6 | 60.0 | 59.0 | 64.5 | 63.0 | |||
| Female | 50.1 | 53.7 | 51.7 | 52.4 | 49.6 | 54.2 | 56.1 | |||
| Total | 108.2 | 114.7 | 112.3 | 112.4 | 108.6 | 118.7 | 119.1 | |||
| Unemployed | ||||||||||
| Male | 10.3 | 9.7 | 9.3 | 8.6 | 6.7 | 5.8 | [4.0] | |||
| Female | 6.0 | 7.4 | 6.3 | 6.8 | 5.9 | 5.9 | [3.7] | |||
| Total | 16.3 | 17.1 | 15.7 | 15.4 | 12.5 | 11.7 | 7.7 | |||
| Not in the labour force | ||||||||||
| Male | 22.9 | 21.0 | 22.0 | 24.3 | 23.9 | 23.5 | 23.0 | |||
| Female | 42.5 | 39.1 | 43.0 | 39.9 | 43.9 | 40.4 | 43.3 | |||
| Total | 65.4 | 60.1 | 65.0 | 64.3 | 67.8 | 64.0 | 66.3 | |||
| Total | ||||||||||
| Male | 91.4 | 91.6 | 92.0 | 93.0 | 89.5 | 93.8 | 90.0 | |||
| Female | 98.6 | 100.3 | 101.0 | 99.1 | 99.4 | 100.5 | 103.1 | |||
| Total | 190.0 | 191.9 | 193.0 | 192.1 | 188.9 | 194.4 | 193.1 | |||
| South-East | ||||||||||
| Couple without children | ||||||||||
| In employment | ||||||||||
| Male | 21.1 | 19.5 | 19.9 | 20.8 | 20.1 | 21.0 | 21.4 | |||
| Female | 17.8 | 16.9 | 17.2 | 19.5 | 18.1 | 18.2 | 17.2 | |||
| Total | 38.9 | 36.5 | 37.1 | 40.3 | 38.2 | 39.2 | 38.6 | |||
| Unemployed | ||||||||||
| Male | [2.7] | [2.6] | * | [3.1] | * | * | * | |||
| Female | * | * | * | * | * | * | * | |||
| Total | 4.2 | 4.1 | [3.2] | 4.9 | [3.7] | [3.9] | * | |||
| Not in the labour force | ||||||||||
| Male | 20.0 | 20.8 | 20.5 | 21.5 | 20.9 | 20.1 | 19.8 | |||
| Female | 21.3 | 24.0 | 23.4 | 25.6 | 24.3 | 24.4 | 22.6 | |||
| Total | 41.3 | 44.7 | 43.9 | 47.1 | 45.2 | 44.5 | 42.3 | |||
| Total | ||||||||||
| Male | 43.8 | 43.0 | 42.2 | 45.4 | 43.4 | 43.7 | 42.9 | |||
| Female | 40.6 | 42.3 | 42.0 | 46.9 | 43.6 | 43.9 | 41.0 | |||
| Total | 84.5 | 85.3 | 84.2 | 92.3 | 87.1 | 87.6 | 83.9 | |||
| Couple with children | ||||||||||
| In employment | ||||||||||
| Male | 53.2 | 50.4 | 54.9 | 52.7 | 56.2 | 57.0 | 58.8 | |||
| Female | 37.7 | 37.6 | 40.6 | 39.3 | 45.5 | 45.7 | 44.4 | |||
| Total | 90.9 | 88.0 | 95.5 | 92.0 | 101.7 | 102.8 | 103.1 | |||
| Unemployed | ||||||||||
| Male | 12.4 | 12.2 | 11.9 | 10.1 | 8.0 | 7.2 | 6.3 | |||
| Female | [3.5] | 5.9 | 5.3 | 5.8 | * | * | * | |||
| Total | 15.8 | 18.2 | 17.2 | 15.9 | 10.7 | 9.6 | 9.2 | |||
| Not in the labour force | ||||||||||
| Male | 8.2 | 11.2 | 10.1 | 9.9 | 9.5 | 5.9 | 7.7 | |||
| Female | 26.0 | 26.3 | 27.5 | 25.3 | 24.1 | 22.0 | 25.7 | |||
| Total | 34.2 | 37.5 | 37.5 | 35.2 | 33.6 | 27.9 | 33.3 | |||
| Total | ||||||||||
| Male | 73.8 | 73.8 | 76.9 | 72.6 | 73.7 | 70.1 | 72.7 | |||
| Female | 67.1 | 69.8 | 73.4 | 70.4 | 72.2 | 70.2 | 72.9 | |||
| Total | 140.9 | 143.7 | 150.3 | 143.0 | 145.9 | 140.3 | 145.7 | |||
| Lone parent | ||||||||||
| In employment | ||||||||||
| Male | * | * | * | * | * | * | * | |||
| Female | 11.0 | 9.5 | 8.5 | 9.4 | 8.4 | 9.0 | 11.7 | |||
| Total | 12.2 | 10.9 | 9.9 | 10.2 | 9.4 | 11.0 | 13.0 | |||
| Unemployed | ||||||||||
| Male | * | * | * | * | * | * | * | |||
| Female | [2.9] | [2.3] | [2.5] | * | * | * | * | |||
| Total | 3.6 | [3.0] | [3.0] | [2.7] | * | * | * | |||
| Not in the labour force | ||||||||||
| Male | * | [2.2] | * | * | * | * | * | |||
| Female | 11.6 | 11.0 | 11.6 | 9.3 | 11.0 | 10.1 | 8.8 | |||
| Total | 12.6 | 13.2 | 13.0 | 10.5 | 12.3 | 11.4 | 10.4 | |||
| Total | ||||||||||
| Male | [2.9] | 4.3 | [3.2] | [2.5] | [2.5] | [3.7] | [3.5] | |||
| Female | 25.6 | 22.8 | 22.6 | 20.9 | 21.1 | 21.3 | 21.4 | |||
| Total | 28.5 | 27.1 | 25.9 | 23.4 | 23.6 | 25.0 | 24.8 | |||
| All family units | ||||||||||
| In employment | ||||||||||
| Male | 75.5 | 71.4 | 76.2 | 74.2 | 77.3 | 80.1 | 81.5 | |||
| Female | 66.5 | 64.0 | 66.3 | 68.2 | 72.0 | 72.8 | 73.2 | |||
| Total | 142.0 | 135.4 | 142.5 | 142.4 | 149.3 | 153.0 | 154.8 | |||
| Unemployed | ||||||||||
| Male | 15.7 | 15.5 | 14.2 | 13.7 | 10.6 | 10.0 | 8.5 | |||
| Female | 7.9 | 9.7 | 9.2 | 9.8 | 5.6 | 6.1 | [5.0] | |||
| Total | 23.7 | 25.2 | 23.5 | 23.5 | 16.2 | 16.1 | 13.5 | |||
| Not in the labour force | ||||||||||
| Male | 29.2 | 34.2 | 31.9 | 32.6 | 31.7 | 27.3 | 29.0 | |||
| Female | 58.9 | 61.3 | 62.5 | 60.2 | 59.4 | 56.5 | 57.1 | |||
| Total | 88.1 | 95.5 | 94.4 | 92.8 | 91.1 | 83.8 | 86.1 | |||
| Total | ||||||||||
| Male | 120.5 | 121.1 | 122.3 | 120.5 | 119.6 | 117.4 | 119.1 | |||
| Female | 133.4 | 135.0 | 138.0 | 138.2 | 137.0 | 135.4 | 135.3 | |||
| Total | 253.9 | 256.1 | 260.4 | 258.7 | 256.6 | 252.9 | 254.4 | |||
| South-West | ||||||||||
| Couple without children | ||||||||||
| In employment | ||||||||||
| Male | 29.3 | 26.4 | 24.9 | 25.4 | 24.6 | 30.3 | 26.2 | |||
| Female | 26.4 | 24.0 | 21.8 | 22.4 | 21.5 | 24.8 | 21.6 | |||
| Total | 55.7 | 50.4 | 46.6 | 47.7 | 46.1 | 55.1 | 47.9 | |||
| Unemployed | ||||||||||
| Male | [2.7] | 3.4 | 3.5 | [2.6] | [3.3] | * | * | |||
| Female | [2.0] | * | * | * | * | * | * | |||
| Total | 4.7 | 4.7 | 4.6 | 4.1 | 5.3 | [3.6] | * | |||
| Not in the labour force | ||||||||||
| Male | 22.9 | 24.2 | 26.4 | 26.9 | 26.5 | 23.8 | 24.6 | |||
| Female | 25.3 | 27.3 | 29.2 | 30.2 | 28.6 | 29.7 | 30.4 | |||
| Total | 48.2 | 51.5 | 55.6 | 57.2 | 55.1 | 53.5 | 55.0 | |||
| Total | ||||||||||
| Male | 54.9 | 54.0 | 54.8 | 54.9 | 54.3 | 56.1 | 52.1 | |||
| Female | 53.7 | 52.6 | 52.0 | 54.2 | 52.1 | 56.1 | 52.6 | |||
| Total | 108.6 | 106.5 | 106.9 | 109.1 | 106.4 | 112.2 | 104.8 | |||
| Couple with children | ||||||||||
| In employment | ||||||||||
| Male | 73.7 | 71.3 | 76.3 | 78.9 | 79.6 | 77.9 | 84.5 | |||
| Female | 53.6 | 54.5 | 55.6 | 57.4 | 57.3 | 56.6 | 59.9 | |||
| Total | 127.4 | 125.8 | 131.9 | 136.2 | 136.9 | 134.4 | 144.4 | |||
| Unemployed | ||||||||||
| Male | 11.2 | 12.3 | 11.9 | 7.8 | 7.6 | 7.4 | [5.1] | |||
| Female | 4.0 | 4.2 | 4.1 | 3.8 | [3.9] | [3.8] | * | |||
| Total | 15.1 | 16.6 | 16.0 | 11.6 | 11.5 | 11.2 | 7.4 | |||
| Not in the labour force | ||||||||||
| Male | 11.9 | 14.3 | 12.5 | 11.6 | 11.5 | 11.1 | 12.6 | |||
| Female | 35.9 | 39.5 | 35.5 | 34.9 | 34.8 | 34.2 | 37.2 | |||
| Total | 47.8 | 53.8 | 48.0 | 46.6 | 46.3 | 45.3 | 49.9 | |||
| Total | ||||||||||
| Male | 96.8 | 97.9 | 100.7 | 98.2 | 98.6 | 96.4 | 102.2 | |||
| Female | 93.5 | 98.3 | 95.1 | 96.1 | 96.0 | 94.5 | 99.4 | |||
| Total | 190.3 | 196.2 | 195.9 | 194.3 | 194.6 | 190.9 | 201.7 | |||
| Lone parent | ||||||||||
| In employment | ||||||||||
| Male | * | * | * | [2.5] | * | * | * | |||
| Female | 11.3 | 11.6 | 13.9 | 12.3 | 11.3 | 11.9 | 11.8 | |||
| Total | 12.9 | 13.4 | 15.6 | 14.8 | 13.3 | 13.2 | 13.7 | |||
| Unemployed | ||||||||||
| Male | * | * | * | * | * | * | * | |||
| Female | * | * | [2.8] | [2.6] | * | * | * | |||
| Total | * | [2.1] | 3.2 | [3.1] | * | [2.5] | * | |||
| Not in the labour force | ||||||||||
| Male | * | * | * | * | * | * | * | |||
| Female | 13.2 | 13.1 | 12.8 | 12.2 | 13.4 | 12.8 | 12.9 | |||
| Total | 14.6 | 14.7 | 14.3 | 13.7 | 15.5 | 14.1 | 14.8 | |||
| Total | ||||||||||
| Male | 3.3 | 3.7 | 3.6 | 4.5 | 4.9 | [2.9] | [3.9] | |||
| Female | 25.9 | 26.5 | 29.5 | 27.2 | 26.8 | 26.8 | 26.8 | |||
| Total | 29.2 | 30.2 | 33.0 | 31.7 | 31.7 | 29.8 | 30.7 | |||
| All family units | ||||||||||
| In employment | ||||||||||
| Male | 104.6 | 99.4 | 102.8 | 106.7 | 106.3 | 109.5 | 112.6 | |||
| Female | 91.4 | 90.1 | 91.3 | 92.0 | 90.0 | 93.2 | 93.3 | |||
| Total | 196.0 | 189.6 | 194.1 | 198.8 | 196.3 | 202.8 | 205.9 | |||
| Unemployed | ||||||||||
| Male | 14.2 | 16.0 | 15.8 | 10.9 | 11.5 | 9.7 | 6.5 | |||
| Female | 7.3 | 7.3 | 8.0 | 8.0 | 8.1 | 7.6 | [5.0] | |||
| Total | 21.5 | 23.4 | 23.8 | 18.9 | 19.6 | 17.2 | 11.5 | |||
| Not in the labour force | ||||||||||
| Male | 36.2 | 40.2 | 40.5 | 40.1 | 40.1 | 36.3 | 39.2 | |||
| Female | 74.4 | 79.9 | 77.4 | 77.4 | 76.8 | 76.6 | 80.5 | |||
| Total | 110.6 | 120.0 | 117.9 | 117.4 | 116.9 | 112.9 | 119.7 | |||
| Total | ||||||||||
| Male | 155.0 | 155.6 | 159.1 | 157.7 | 157.8 | 155.5 | 158.3 | |||
| Female | 173.1 | 177.3 | 176.6 | 177.4 | 175.0 | 177.5 | 178.8 | |||
| Total | 328.1 | 332.9 | 335.8 | 335.1 | 332.8 | 332.9 | 337.1 | |||
| State | ||||||||||
| Couple without children | ||||||||||
| In employment | ||||||||||
| Male | 197.4 | 194.7 | 190.2 | 191.5 | 194.4 | 197.1 | 204.7 | |||
| Female | 176.7 | 174.8 | 167.4 | 167.0 | 167.6 | 167.3 | 177.9 | |||
| Total | 374.1 | 369.4 | 357.6 | 358.5 | 362.0 | 364.4 | 382.7 | |||
| Unemployed | ||||||||||
| Male | 23.3 | 23.3 | 22.3 | 20.4 | 18.2 | 15.2 | 11.5 | |||
| Female | 12.7 | 13.1 | 12.6 | 11.2 | 10.2 | 8.9 | 9.3 | |||
| Total | 36.0 | 36.3 | 34.9 | 31.6 | 28.4 | 24.2 | 20.8 | |||
| Not in the labour force | ||||||||||
| Male | 154.3 | 157.2 | 167.5 | 171.2 | 167.1 | 168.5 | 169.8 | |||
| Female | 171.3 | 179.5 | 191.9 | 201.0 | 196.3 | 196.9 | 198.0 | |||
| Total | 325.6 | 336.7 | 359.5 | 372.2 | 363.4 | 365.4 | 367.8 | |||
| Total | ||||||||||
| Male | 375.1 | 375.1 | 380.0 | 383.1 | 379.7 | 380.9 | 386.0 | |||
| Female | 360.6 | 367.4 | 372.0 | 379.1 | 374.1 | 373.1 | 385.2 | |||
| Total | 735.7 | 742.5 | 752.0 | 762.3 | 753.7 | 754.0 | 771.2 | |||
| Couple with children | ||||||||||
| In employment | ||||||||||
| Male | 507.5 | 500.1 | 503.5 | 520.3 | 532.7 | 552.1 | 544.8 | |||
| Female | 365.0 | 372.4 | 370.8 | 377.9 | 387.4 | 404.4 | 402.0 | |||
| Total | 872.5 | 872.5 | 874.3 | 898.1 | 920.1 | 956.5 | 946.9 | |||
| Unemployed | ||||||||||
| Male | 77.5 | 80.6 | 83.5 | 71.5 | 57.7 | 48.4 | 40.5 | |||
| Female | 27.6 | 33.6 | 36.3 | 38.8 | 29.7 | 25.4 | 23.0 | |||
| Total | 105.1 | 114.2 | 119.8 | 110.3 | 87.4 | 73.8 | 63.5 | |||
| Not in the labour force | ||||||||||
| Male | 88.4 | 97.0 | 93.5 | 85.4 | 83.7 | 81.5 | 81.2 | |||
| Female | 249.1 | 253.4 | 247.2 | 244.1 | 240.0 | 233.2 | 235.1 | |||
| Total | 337.5 | 350.3 | 340.7 | 329.4 | 323.6 | 314.7 | 316.3 | |||
| Total | ||||||||||
| Male | 673.4 | 677.8 | 680.4 | 677.2 | 674.1 | 682.1 | 666.6 | |||
| Female | 641.7 | 659.3 | 654.2 | 660.7 | 657.1 | 663.0 | 660.2 | |||
| Total | 1,315.1 | 1,337.1 | 1,334.7 | 1,337.9 | 1,331.1 | 1,345.1 | 1,326.7 | |||
| Lone parent | ||||||||||
| In employment | ||||||||||
| Male | 11.4 | 11.5 | 10.4 | 11.8 | 12.9 | 12.1 | 14.3 | |||
| Female | 82.7 | 85.9 | 87.0 | 87.4 | 82.4 | 85.9 | 92.3 | |||
| Total | 94.2 | 97.4 | 97.4 | 99.2 | 95.3 | 98.0 | 106.6 | |||
| Unemployed | ||||||||||
| Male | [3.0] | [3.8] | [3.2] | [3.3] | [3.5] | * | * | |||
| Female | 14.9 | 17.3 | 18.2 | 20.4 | 14.7 | 14.3 | 10.8 | |||
| Total | 17.8 | 21.0 | 21.4 | 23.7 | 18.2 | 16.8 | 12.9 | |||
| Not in the labour force | ||||||||||
| Male | 11.4 | 11.8 | 12.8 | 11.7 | 13.1 | 12.0 | 11.5 | |||
| Female | 100.8 | 95.7 | 97.5 | 84.2 | 91.1 | 92.1 | 89.8 | |||
| Total | 112.2 | 107.5 | 110.3 | 95.9 | 104.2 | 104.2 | 101.3 | |||
| Total | ||||||||||
| Male | 25.8 | 27.0 | 26.4 | 26.7 | 29.4 | 26.7 | 27.9 | |||
| Female | 198.4 | 198.8 | 202.7 | 192.1 | 188.3 | 192.3 | 192.8 | |||
| Total | 224.2 | 225.9 | 229.1 | 218.8 | 217.7 | 219.0 | 220.7 | |||
| All family units | ||||||||||
| In employment | ||||||||||
| Male | 716.3 | 706.2 | 704.0 | 723.6 | 739.9 | 761.4 | 763.8 | |||
| Female | 624.4 | 633.1 | 625.2 | 632.3 | 637.4 | 657.6 | 672.3 | |||
| Total | 1,340.7 | 1,339.3 | 1,329.2 | 1,355.9 | 1,377.3 | 1,419.0 | 1,436.1 | |||
| Unemployed | ||||||||||
| Male | 103.7 | 107.7 | 109.0 | 95.2 | 79.4 | 66.2 | 54.1 | |||
| Female | 55.2 | 63.9 | 67.1 | 70.4 | 54.5 | 48.6 | 43.0 | |||
| Total | 158.9 | 171.6 | 176.1 | 165.5 | 134.0 | 114.8 | 97.2 | |||
| Not in the labour force | ||||||||||
| Male | 254.2 | 266.0 | 273.8 | 268.3 | 263.8 | 262.0 | 262.5 | |||
| Female | 521.1 | 528.5 | 536.7 | 529.3 | 527.4 | 522.2 | 522.9 | |||
| Total | 775.3 | 794.5 | 810.4 | 797.6 | 791.2 | 784.3 | 785.4 | |||
| Total | ||||||||||
| Male | 1,074.2 | 1,079.9 | 1,086.8 | 1,087.0 | 1,083.2 | 1,089.7 | 1,080.4 | |||
| Female | 1,200.8 | 1,225.5 | 1,228.9 | 1,231.9 | 1,219.4 | 1,228.4 | 1,238.2 | |||
| Total | 2,275.0 | 2,305.4 | 2,315.7 | 2,319.0 | 2,302.5 | 2,318.1 | 2,318.6 | |||
| Note: For the purpose of this table, an adult member of a family unit is either a lone parent or a member of a couple. Never married persons (regardless of age) living with a parent or parents are defined as children provided those persons are themselves not part of a separate family unit. In addition users should note that the grossing factors assigned to each spouse within a family unit may differ. | ||||||||||
| Table 8 Adult members of family units classified by composition of detailed family unit, ILO Economic Status and sex | ||||||||||
| '000 | ||||||||||
| Family unit type/ILO Economic Status/Sex | Q2 10 | Q2 11 | Q2 12 | Q2 13 | Q2 14 | Q2 15 | Q2 16 | |||
| Couple without children | ||||||||||
| At least one partner aged under 45 | ||||||||||
| In employment | ||||||||||
| Male | 102.8 | 97.9 | 91.8 | 89.0 | 88.4 | 84.9 | 88.7 | |||
| Female | 98.5 | 94.4 | 86.5 | 84.1 | 80.4 | 78.4 | 83.7 | |||
| Total | 201.3 | 192.4 | 178.3 | 173.1 | 168.9 | 163.3 | 172.4 | |||
| Unemployed | ||||||||||
| Male | 11.8 | 11.8 | 11.0 | 8.3 | 6.2 | [5.0] | [5.1] | |||
| Female | 7.6 | 8.3 | 6.4 | [4.6] | [4.7] | [3.4] | [5.5] | |||
| Total | 19.4 | 20.1 | 17.4 | 12.9 | 10.8 | 8.3 | 10.7 | |||
| Not in the labour force | ||||||||||
| Male | 5.0 | 5.2 | 5.2 | 5.4 | [3.3] | [3.9] | [5.7] | |||
| Female | 8.1 | 7.7 | 9.2 | 8.6 | 7.5 | 8.0 | 8.1 | |||
| Total | 13.2 | 12.9 | 14.4 | 14.0 | 10.9 | 12.0 | 13.8 | |||
| Total | ||||||||||
| Male | 119.7 | 115.0 | 108.0 | 102.7 | 97.9 | 93.8 | 99.6 | |||
| Female | 114.2 | 110.4 | 102.1 | 97.3 | 92.6 | 89.8 | 97.3 | |||
| Total | 233.8 | 225.4 | 210.1 | 200.0 | 190.6 | 183.6 | 196.9 | |||
| Both partners aged 45 to 64 | ||||||||||
| In employment | ||||||||||
| Male | 85.5 | 87.0 | 87.3 | 89.5 | 92.8 | 95.6 | 99.2 | |||
| Female | 73.0 | 74.7 | 76.2 | 76.8 | 80.7 | 81.6 | 85.2 | |||
| Total | 158.5 | 161.7 | 163.5 | 166.3 | 173.4 | 177.2 | 184.4 | |||
| Unemployed | ||||||||||
| Male | 11.4 | 11.3 | 11.2 | 11.9 | 12.0 | 10.3 | 6.2 | |||
| Female | 5.0 | 4.7 | 6.1 | 6.4 | 5.4 | 5.4 | [3.7] | |||
| Total | 16.4 | 16.1 | 17.4 | 18.3 | 17.4 | 15.7 | 9.9 | |||
| Not in the labour force | ||||||||||
| Male | 59.6 | 59.4 | 61.7 | 58.1 | 58.9 | 54.9 | 56.0 | |||
| Female | 72.6 | 73.7 | 75.7 | 75.5 | 76.4 | 71.0 | 69.3 | |||
| Total | 132.2 | 133.1 | 137.5 | 133.6 | 135.2 | 126.0 | 125.2 | |||
| Total | ||||||||||
| Male | 156.5 | 157.7 | 160.3 | 159.5 | 163.6 | 160.8 | 161.4 | |||
| Female | 150.6 | 153.2 | 158.0 | 158.7 | 162.5 | 158.1 | 158.2 | |||
| Total | 307.1 | 310.9 | 318.3 | 318.2 | 326.1 | 318.9 | 319.6 | |||
| At least one partner aged 65 or more | ||||||||||
| In employment | ||||||||||
| Male | 9.2 | 9.7 | 11.1 | 13.0 | 13.2 | 16.6 | 16.9 | |||
| Female | 5.2 | 5.7 | 4.8 | 6.2 | 6.5 | 7.3 | 9.0 | |||
| Total | 14.3 | 15.4 | 15.9 | 19.1 | 19.7 | 23.9 | 25.9 | |||
| Unemployed | ||||||||||
| Male | * | * | * | * | * | * | * | |||
| Female | * | * | * | * | * | * | * | |||
| Total | * | * | * | * | * | * | * | |||
| Not in the labour force | ||||||||||
| Male | 89.6 | 92.5 | 100.6 | 107.7 | 104.9 | 109.6 | 108.1 | |||
| Female | 90.6 | 98.1 | 106.9 | 116.8 | 112.4 | 117.8 | 120.7 | |||
| Total | 180.2 | 190.7 | 207.5 | 224.6 | 217.3 | 227.5 | 228.7 | |||
| Total | ||||||||||
| Male | 98.9 | 102.4 | 111.7 | 121.0 | 118.1 | 126.2 | 125.1 | |||
| Female | 95.9 | 103.8 | 111.9 | 123.1 | 119.0 | 125.3 | 129.7 | |||
| Total | 194.7 | 206.2 | 223.6 | 244.1 | 237.1 | 251.5 | 254.7 | |||
| Total all couples without children | ||||||||||
| In employment | ||||||||||
| Male | 197.4 | 194.7 | 190.2 | 191.5 | 194.4 | 197.1 | 204.7 | |||
| Female | 176.7 | 174.8 | 167.4 | 167.0 | 167.6 | 167.3 | 177.9 | |||
| Total | 374.1 | 369.4 | 357.6 | 358.5 | 362.0 | 364.4 | 382.7 | |||
| Unemployed | ||||||||||
| Male | 23.3 | 23.3 | 22.3 | 20.4 | 18.2 | 15.2 | 11.5 | |||
| Female | 12.7 | 13.1 | 12.6 | 11.2 | 10.2 | 8.9 | 9.3 | |||
| Total | 36.0 | 36.3 | 34.9 | 31.6 | 28.4 | 24.2 | 20.8 | |||
| Not in the labour force | ||||||||||
| Male | 154.3 | 157.2 | 167.5 | 171.2 | 167.1 | 168.5 | 169.8 | |||
| Female | 171.3 | 179.5 | 191.9 | 201.0 | 196.3 | 196.9 | 198.0 | |||
| Total | 325.6 | 336.7 | 359.5 | 372.2 | 363.4 | 365.4 | 367.8 | |||
| Total | ||||||||||
| Male | 375.1 | 375.1 | 380.0 | 383.1 | 379.7 | 380.9 | 386.0 | |||
| Female | 360.6 | 367.4 | 372.0 | 379.1 | 374.1 | 373.1 | 385.2 | |||
| Total | 735.7 | 742.5 | 752.0 | 762.3 | 753.7 | 754.0 | 771.2 | |||
| Couple with children | ||||||||||
| At least 1 child aged under 5 and no child aged 15 or over | ||||||||||
| In employment | ||||||||||
| Male | 217.5 | 214.2 | 218.1 | 221.5 | 220.5 | 227.9 | 216.2 | |||
| Female | 151.9 | 157.4 | 157.5 | 162.0 | 160.6 | 167.2 | 159.9 | |||
| Total | 369.4 | 371.6 | 375.6 | 383.5 | 381.1 | 395.1 | 376.0 | |||
| Unemployed | ||||||||||
| Male | 37.3 | 40.3 | 38.4 | 33.6 | 23.5 | 18.0 | 14.9 | |||
| Female | 15.0 | 16.2 | 18.0 | 18.3 | 12.3 | 10.2 | 8.7 | |||
| Total | 52.3 | 56.5 | 56.4 | 52.0 | 35.8 | 28.2 | 23.6 | |||
| Not in the labour force | ||||||||||
| Male | 16.7 | 18.2 | 15.6 | 16.9 | 12.1 | 12.9 | 9.5 | |||
| Female | 90.9 | 91.3 | 83.6 | 81.9 | 74.3 | 73.6 | 69.2 | |||
| Total | 107.6 | 109.5 | 99.2 | 98.8 | 86.4 | 86.5 | 78.7 | |||
| Total | ||||||||||
| Male | 271.5 | 272.8 | 272.1 | 272.0 | 256.0 | 258.7 | 240.6 | |||
| Female | 257.8 | 264.9 | 259.1 | 262.1 | 247.2 | 251.1 | 237.8 | |||
| Total | 529.3 | 537.6 | 531.2 | 534.2 | 503.3 | 509.8 | 478.4 | |||
| At least 1 child aged under 5 and at least 1 child aged 15 or over | ||||||||||
| In employment | ||||||||||
| Male | 11.7 | 12.6 | 12.5 | 13.9 | 14.0 | 14.0 | 15.6 | |||
| Female | 6.8 | 7.4 | 7.0 | 7.9 | 7.5 | 8.9 | 10.0 | |||
| Total | 18.5 | 20.0 | 19.5 | 21.8 | 21.5 | 22.9 | 25.5 | |||
| Unemployed | ||||||||||
| Male | [2.3] | 3.9 | 3.9 | [4.1] | [4.2] | * | * | |||
| Female | * | * | * | * | * | * | * | |||
| Total | [3.0] | 4.7 | 5.5 | 5.2 | 5.1 | [3.6] | * | |||
| Not in the labour force | ||||||||||
| Male | * | [3.0] | [2.5] | * | [3.2] | * | * | |||
| Female | 7.5 | 10.6 | 9.3 | 10.1 | 11.9 | 8.2 | 8.5 | |||
| Total | 9.3 | 13.5 | 11.8 | 11.8 | 15.0 | 10.5 | 10.3 | |||
| Total | ||||||||||
| Male | 15.7 | 19.5 | 18.9 | 19.6 | 21.3 | 19.1 | 19.8 | |||
| Female | 15.0 | 18.7 | 17.9 | 19.1 | 20.3 | 17.9 | 19.1 | |||
| Total | 30.8 | 38.2 | 36.9 | 38.8 | 41.6 | 37.0 | 39.0 | |||
| All children aged 5 to 14 | ||||||||||
| In employment | ||||||||||
| Male | 81.5 | 79.1 | 87.9 | 90.9 | 95.8 | 97.9 | 100.2 | |||
| Female | 61.0 | 60.2 | 67.2 | 65.2 | 72.0 | 72.6 | 77.9 | |||
| Total | 142.5 | 139.3 | 155.1 | 156.1 | 167.8 | 170.5 | 178.2 | |||
| Unemployed | ||||||||||
| Male | 12.9 | 13.1 | 14.2 | 8.4 | 10.5 | 9.1 | 7.8 | |||
| Female | 4.7 | 6.1 | 6.6 | 8.3 | 5.7 | 5.4 | [5.0] | |||
| Total | 17.6 | 19.2 | 20.8 | 16.7 | 16.2 | 14.5 | 12.8 | |||
| Not in the labour force | ||||||||||
| Male | 7.5 | 7.9 | 9.2 | 7.5 | 6.9 | 7.5 | 8.1 | |||
| Female | 30.5 | 30.0 | 31.8 | 29.8 | 32.1 | 33.0 | 32.2 | |||
| Total | 38.0 | 37.9 | 41.0 | 37.3 | 39.0 | 40.5 | 40.3 | |||
| Total | ||||||||||
| Male | 101.9 | 100.1 | 111.2 | 106.7 | 113.2 | 114.4 | 116.1 | |||
| Female | 96.3 | 96.4 | 105.7 | 103.3 | 109.8 | 111.0 | 115.1 | |||
| Total | 198.2 | 196.5 | 216.9 | 210.1 | 223.0 | 225.4 | 231.2 | |||
| No child aged under 5, at least 1 child aged 5 to 14 and at least 1 child aged 15 or over | ||||||||||
| In employment | ||||||||||
| Male | 70.5 | 66.8 | 65.8 | 68.8 | 72.5 | 75.6 | 71.7 | |||
| Female | 49.1 | 48.6 | 45.4 | 46.4 | 50.5 | 52.7 | 50.4 | |||
| Total | 119.6 | 115.4 | 111.3 | 115.2 | 123.0 | 128.3 | 122.1 | |||
| Unemployed | ||||||||||
| Male | 10.9 | 9.3 | 11.2 | 10.9 | 6.3 | 8.8 | 6.4 | |||
| Female | 3.4 | [3.7] | 4.7 | 4.8 | [3.9] | [3.9] | [4.0] | |||
| Total | 14.4 | 12.9 | 15.9 | 15.7 | 10.2 | 12.7 | 10.4 | |||
| Not in the labour force | ||||||||||
| Male | 7.8 | 8.2 | 9.5 | 7.8 | 7.8 | 6.5 | 8.4 | |||
| Female | 32.7 | 30.2 | 33.0 | 33.0 | 30.3 | 31.4 | 31.9 | |||
| Total | 40.5 | 38.4 | 42.5 | 40.8 | 38.1 | 37.9 | 40.3 | |||
| Total | ||||||||||
| Male | 89.3 | 84.3 | 86.5 | 87.6 | 86.6 | 90.9 | 86.5 | |||
| Female | 85.2 | 82.4 | 83.2 | 84.2 | 84.7 | 88.0 | 86.3 | |||
| Total | 174.5 | 166.7 | 169.6 | 171.7 | 171.3 | 178.9 | 172.8 | |||
| All children aged 15 or over | ||||||||||
| In employment | ||||||||||
| Male | 126.2 | 127.5 | 119.1 | 125.1 | 129.9 | 136.8 | 141.1 | |||
| Female | 96.2 | 98.8 | 93.6 | 96.4 | 96.8 | 103.0 | 103.9 | |||
| Total | 222.4 | 226.3 | 212.7 | 221.6 | 226.7 | 239.8 | 245.0 | |||
| Unemployed | ||||||||||
| Male | 14.1 | 14.0 | 15.8 | 14.5 | 13.3 | 9.9 | 9.0 | |||
| Female | 3.8 | 6.8 | 5.4 | 6.3 | 6.9 | 5.0 | [4.6] | |||
| Total | 17.9 | 20.8 | 21.2 | 20.8 | 20.2 | 14.9 | 13.6 | |||
| Not in the labour force | ||||||||||
| Male | 54.7 | 59.7 | 56.7 | 51.5 | 53.8 | 52.3 | 53.3 | |||
| Female | 87.4 | 91.3 | 89.4 | 89.2 | 91.3 | 87.0 | 93.4 | |||
| Total | 142.1 | 151.0 | 146.1 | 140.7 | 145.1 | 139.3 | 146.7 | |||
| Total | ||||||||||
| Male | 195.0 | 201.2 | 191.7 | 191.2 | 196.9 | 199.0 | 203.4 | |||
| Female | 187.4 | 196.9 | 188.3 | 191.9 | 195.0 | 195.0 | 201.9 | |||
| Total | 382.4 | 398.1 | 380.0 | 383.1 | 391.9 | 394.0 | 405.3 | |||
| Total couples with children | ||||||||||
| In employment | ||||||||||
| Male | 507.5 | 500.1 | 503.5 | 520.3 | 532.7 | 552.1 | 544.8 | |||
| Female | 365.0 | 372.4 | 370.8 | 377.9 | 387.4 | 404.4 | 402.0 | |||
| Total | 872.5 | 872.5 | 874.3 | 898.1 | 920.1 | 956.5 | 946.9 | |||
| Unemployed | ||||||||||
| Male | 77.5 | 80.6 | 83.5 | 71.5 | 57.7 | 48.4 | 40.5 | |||
| Female | 27.6 | 33.6 | 36.3 | 38.8 | 29.7 | 25.4 | 23.0 | |||
| Total | 105.1 | 114.2 | 119.8 | 110.3 | 87.4 | 73.8 | 63.5 | |||
| Not in the labour force | ||||||||||
| Male | 88.4 | 97.0 | 93.5 | 85.4 | 83.7 | 81.5 | 81.2 | |||
| Female | 249.1 | 253.4 | 247.2 | 244.1 | 240.0 | 233.2 | 235.1 | |||
| Total | 337.5 | 350.3 | 340.7 | 329.4 | 323.6 | 314.7 | 316.3 | |||
| Total | ||||||||||
| Male | 673.4 | 677.8 | 680.4 | 677.2 | 674.1 | 682.1 | 666.6 | |||
| Female | 641.7 | 659.3 | 654.2 | 660.7 | 657.1 | 663.0 | 660.2 | |||
| Total | 1,315.1 | 1,337.1 | 1,334.7 | 1,337.9 | 1,331.1 | 1,345.1 | 1,326.7 | |||
| Lone parent | ||||||||||
| At least 1 child aged under 5 and no child aged 15 or over | ||||||||||
| In employment | ||||||||||
| Male | * | * | * | * | * | * | * | |||
| Female | 20.2 | 22.3 | 21.3 | 20.8 | 17.9 | 18.6 | 19.0 | |||
| Total | 21.0 | 23.0 | 22.2 | 21.4 | 19.3 | 19.9 | 20.4 | |||
| Unemployed | ||||||||||
| Male | * | * | * | * | * | * | * | |||
| Female | 5.0 | 6.7 | 7.0 | 5.5 | [4.1] | [3.9] | [3.4] | |||
| Total | 5.7 | 7.5 | 8.3 | 6.2 | [4.5] | [4.3] | [3.6] | |||
| Not in the labour force | ||||||||||
| Male | * | * | * | * | * | * | * | |||
| Female | 32.8 | 27.3 | 26.9 | 22.9 | 23.0 | 22.1 | 19.4 | |||
| Total | 33.2 | 28.1 | 27.5 | 23.2 | 23.4 | 22.5 | 19.6 | |||
| Total | ||||||||||
| Male | * | * | [2.8] | * | * | * | * | |||
| Female | 58.0 | 56.3 | 55.2 | 49.1 | 44.9 | 44.6 | 41.8 | |||
| Total | 59.9 | 58.6 | 58.0 | 50.8 | 47.2 | 46.7 | 43.7 | |||
| At least 1 child aged under 5 and at least 1 child aged 15 or over | ||||||||||
| In employment | ||||||||||
| Male | * | * | * | * | * | * | * | |||
| Female | * | * | * | * | * | * | * | |||
| Total | * | * | * | * | * | * | * | |||
| Unemployed | ||||||||||
| Male | * | * | * | * | * | * | * | |||
| Female | * | * | * | * | * | * | * | |||
| Total | * | * | * | * | * | * | * | |||
| Not in the labour force | ||||||||||
| Male | * | * | * | * | * | * | * | |||
| Female | [3.2] | [2.8] | [3.1] | [2.8] | [3.3] | [3.1] | * | |||
| Total | [3.2] | [2.8] | [3.1] | [2.8] | [3.4] | [3.3] | * | |||
| Total | ||||||||||
| Male | * | * | * | * | * | * | * | |||
| Female | 5.6 | 4.2 | 5.6 | 4.8 | 5.0 | 5.6 | [4.9] | |||
| Total | 5.6 | 4.3 | 5.6 | 5.0 | 5.3 | 6.1 | [5.1] | |||
| All children aged 5 to 14 | ||||||||||
| In employment | ||||||||||
| Male | * | * | * | * | * | * | * | |||
| Female | 23.3 | 23.0 | 21.7 | 24.5 | 20.8 | 20.2 | 24.5 | |||
| Total | 24.6 | 25.0 | 23.3 | 26.5 | 22.6 | 22.1 | 26.6 | |||
| Unemployed | ||||||||||
| Male | * | * | * | * | * | * | * | |||
| Female | 4.2 | 5.4 | 5.5 | 7.0 | 5.2 | [3.7] | * | |||
| Total | 4.8 | 6.3 | 6.0 | 7.8 | 6.2 | 4.7 | [3.6] | |||
| Not in the labour force | ||||||||||
| Male | * | * | * | * | * | * | * | |||
| Female | 11.8 | 12.9 | 15.0 | 11.0 | 12.6 | 13.8 | 11.7 | |||
| Total | 12.9 | 13.8 | 16.1 | 12.3 | 13.5 | 14.8 | 12.7 | |||
| Total | ||||||||||
| Male | [3.1] | [3.7] | [3.3] | [4.0] | [3.8] | [3.7] | [3.9] | |||
| Female | 39.2 | 41.3 | 42.2 | 42.5 | 38.5 | 37.8 | 39.0 | |||
| Total | 42.4 | 45.0 | 45.4 | 46.5 | 42.3 | 41.5 | 42.8 | |||
| No child aged under 5, at least 1 child aged 5 to 14 and at least 1 child aged 15 or over | ||||||||||
| In employment | ||||||||||
| Male | * | * | * | * | * | * | * | |||
| Female | 8.1 | 8.4 | 10.2 | 10.2 | 8.7 | 11.0 | 10.5 | |||
| Total | 9.2 | 9.6 | 11.2 | 11.5 | 9.6 | 12.0 | 12.1 | |||
| Unemployed | ||||||||||
| Male | * | * | * | * | * | * | * | |||
| Female | * | * | * | [2.9] | * | * | * | |||
| Total | [2.2] | * | * | [3.2] | * | * | * | |||
| Not in the labour force | ||||||||||
| Male | * | * | * | * | * | * | * | |||
| Female | 6.5 | 7.5 | 8.9 | 7.8 | 7.4 | 7.4 | 9.3 | |||
| Total | 7.0 | 7.8 | 9.5 | 8.0 | 7.9 | 8.2 | 9.9 | |||
| Total | ||||||||||
| Male | * | * | * | * | * | * | * | |||
| Female | 16.5 | 17.6 | 20.9 | 21.0 | 17.5 | 20.3 | 20.9 | |||
| Total | 18.4 | 19.2 | 22.8 | 22.7 | 19.4 | 22.2 | 23.1 | |||
| All children aged 15 or over | ||||||||||
| In employment | ||||||||||
| Male | 8.2 | 7.5 | 6.8 | 7.8 | 8.7 | 7.8 | 9.0 | |||
| Female | 29.3 | 30.9 | 31.7 | 30.5 | 33.8 | 34.1 | 36.4 | |||
| Total | 37.5 | 38.4 | 38.5 | 38.3 | 42.5 | 41.8 | 45.5 | |||
| Unemployed | ||||||||||
| Male | * | * | * | * | * | * | * | |||
| Female | [3.3] | [3.4] | 3.5 | [4.4] | [3.6] | [4.2] | [3.2] | |||
| Total | 4.6 | 5.3 | 4.6 | 5.9 | 5.1 | 5.2 | [4.3] | |||
| Not in the labour force | ||||||||||
| Male | 9.3 | 9.8 | 10.5 | 9.9 | 11.1 | 9.7 | 9.7 | |||
| Female | 46.5 | 45.2 | 43.7 | 39.7 | 44.9 | 45.7 | 46.6 | |||
| Total | 55.8 | 55.1 | 54.2 | 49.6 | 56.0 | 55.4 | 56.3 | |||
| Total | ||||||||||
| Male | 18.8 | 19.2 | 18.3 | 19.2 | 21.2 | 18.5 | 19.8 | |||
| Female | 79.1 | 79.5 | 78.9 | 74.6 | 82.3 | 83.9 | 86.2 | |||
| Total | 97.9 | 98.8 | 97.3 | 93.8 | 103.6 | 102.5 | 106.0 | |||
| Total lone parents | ||||||||||
| In employment | ||||||||||
| Male | 11.4 | 11.5 | 10.4 | 11.8 | 12.9 | 12.1 | 14.3 | |||
| Female | 82.7 | 85.9 | 87.0 | 87.4 | 82.4 | 85.9 | 92.3 | |||
| Total | 94.2 | 97.4 | 97.4 | 99.2 | 95.3 | 98.0 | 106.6 | |||
| Unemployed | ||||||||||
| Male | [3.0] | [3.8] | [3.2] | [3.3] | [3.5] | * | * | |||
| Female | 14.9 | 17.3 | 18.2 | 20.4 | 14.7 | 14.3 | 10.8 | |||
| Total | 17.8 | 21.0 | 21.4 | 23.7 | 18.2 | 16.8 | 12.9 | |||
| Not in the labour force | ||||||||||
| Male | 11.4 | 11.8 | 12.8 | 11.7 | 13.1 | 12.0 | 11.5 | |||
| Female | 100.8 | 95.7 | 97.5 | 84.2 | 91.1 | 92.1 | 89.8 | |||
| Total | 112.2 | 107.5 | 110.3 | 95.9 | 104.2 | 104.2 | 101.3 | |||
| Total | ||||||||||
| Male | 25.8 | 27.0 | 26.4 | 26.7 | 29.4 | 26.7 | 27.9 | |||
| Female | 198.4 | 198.8 | 202.7 | 192.1 | 188.3 | 192.3 | 192.8 | |||
| Total | 224.2 | 225.9 | 229.1 | 218.8 | 217.7 | 219.0 | 220.7 | |||
| Total family units | ||||||||||
| In employment | ||||||||||
| Male | 716.3 | 706.2 | 704.0 | 723.6 | 739.9 | 761.4 | 763.8 | |||
| Female | 624.4 | 633.1 | 625.2 | 632.3 | 637.4 | 657.6 | 672.3 | |||
| Total | 1,340.7 | 1,339.3 | 1,329.2 | 1,355.9 | 1,377.3 | 1,419.0 | 1,436.1 | |||
| Unemployed | ||||||||||
| Male | 103.7 | 107.7 | 109.0 | 95.2 | 79.4 | 66.2 | 54.1 | |||
| Female | 55.2 | 63.9 | 67.1 | 70.4 | 54.5 | 48.6 | 43.0 | |||
| Total | 158.9 | 171.6 | 176.1 | 165.5 | 134.0 | 114.8 | 97.2 | |||
| Not in the labour force | ||||||||||
| Male | 254.2 | 266.0 | 273.8 | 268.3 | 263.8 | 262.0 | 262.5 | |||
| Female | 521.1 | 528.5 | 536.7 | 529.3 | 527.4 | 522.2 | 522.9 | |||
| Total | 775.3 | 794.5 | 810.4 | 797.6 | 791.2 | 784.3 | 785.4 | |||
| Total | ||||||||||
| Male | 1,074.2 | 1,079.9 | 1,086.8 | 1,087.0 | 1,083.2 | 1,089.7 | 1,080.4 | |||
| Female | 1,200.8 | 1,225.5 | 1,228.9 | 1,231.9 | 1,219.4 | 1,228.4 | 1,238.2 | |||
| Total | 2,275.0 | 2,305.4 | 2,315.7 | 2,319.0 | 2,302.5 | 2,318.1 | 2,318.6 | |||
| Note: For the purpose of this table, an adult member of a family unit is either a lone parent or a member of a couple. Never married persons (regardless of age) living with a parent or parents are defined as children provided those persons are themselves not part of a separate family unit. In addition users should note that the grossing factors assigned to each spouse within a family unit may differ. | ||||||||||
| Table 9 Employment rates1 of adult members of family units classified by composition of family unit and age of youngest child and employment rates of all other persons | |||||||||
| % | |||||||||
| Family unit and non-family unit type/Sex | Q2 10 | Q2 11 | Q2 12 | Q2 13 | Q2 14 | Q2 15 | Q2 16 | ||
| Adult members of family units without children | |||||||||
| Couple without children | |||||||||
| Male | 73.3 | 73.5 | 72.4 | 73.8 | 75.4 | 77.2 | 78.7 | ||
| Female | 66.2 | 65.1 | 63.8 | 63.9 | 64.4 | 65.9 | 67.8 | ||
| Total | 69.7 | 69.2 | 67.9 | 68.7 | 69.7 | 71.4 | 73.0 | ||
| Adult members of family units with children | |||||||||
| Couple with children | |||||||||
| Youngest child aged 0-5 | |||||||||
| Male | 79.8 | 77.6 | 79.2 | 80.7 | 84.6 | 87.1 | 89.0 | ||
| Female | 58.2 | 58.1 | 59.4 | 60.4 | 62.9 | 65.5 | 66.1 | ||
| Total | 69.3 | 68.0 | 69.6 | 70.7 | 73.9 | 76.5 | 77.6 | ||
| Youngest child aged 6-11 | |||||||||
| Male | 80.6 | 79.7 | 78.2 | 83.2 | 84.3 | 84.6 | 85.6 | ||
| Female | 60.2 | 58.8 | 57.9 | 58.8 | 62.0 | 61.0 | 63.9 | ||
| Total | 70.7 | 69.4 | 68.3 | 71.3 | 73.3 | 73.0 | 74.8 | ||
| Youngest child aged 12-17 | |||||||||
| Male | 77.4 | 79.2 | 76.3 | 79.8 | 82.4 | 85.7 | 85.1 | ||
| Female | 61.5 | 64.8 | 64.2 | 62.2 | 64.0 | 67.1 | 64.5 | ||
| Total | 69.6 | 72.0 | 70.3 | 71.0 | 73.2 | 76.4 | 74.8 | ||
| Youngest child aged 18 or greater | |||||||||
| Male | 71.0 | 69.6 | 68.9 | 73.4 | 74.6 | 76.6 | 78.0 | ||
| Female | 54.1 | 53.6 | 51.9 | 52.3 | 52.8 | 56.0 | 55.6 | ||
| Total | 62.3 | 61.4 | 60.1 | 62.3 | 63.2 | 65.9 | 66.3 | ||
| All children | |||||||||
| Male | 78.1 | 76.8 | 76.8 | 79.9 | 82.5 | 84.5 | 85.6 | ||
| Female | 58.4 | 58.5 | 58.5 | 58.9 | 61.0 | 63.0 | 63.3 | ||
| Total | 68.4 | 67.7 | 67.7 | 69.4 | 71.8 | 73.8 | 74.4 | ||
| Lone parent | |||||||||
| Youngest child aged 0-5 | |||||||||
| Male | * | [32.4] | [34.2] | * | * | * | * | ||
| Female | 34.8 | 39.0 | 38.5 | 41.1 | 38.3 | 41.1 | 44.6 | ||
| Total | 35.0 | 38.7 | 38.3 | 41.2 | 39.3 | 42.0 | 46.0 | ||
| Youngest child aged 6-11 | |||||||||
| Male | [50.1] | [61.0] | [48.0] | [55.6] | [47.6] | [37.9] | [60.3] | ||
| Female | 55.0 | 51.0 | 47.1 | 53.4 | 51.4 | 50.8 | 56.9 | ||
| Total | 54.6 | 51.6 | 47.1 | 53.5 | 51.1 | 49.7 | 57.2 | ||
| Youngest child aged 12-17 | |||||||||
| Male | 57.5 | 55.6 | 55.7 | 55.8 | 66.5 | [75.6] | [70.4] | ||
| Female | 60.8 | 59.8 | 61.1 | 62.6 | 61.6 | 61.7 | 62.4 | ||
| Total | 60.5 | 59.2 | 60.6 | 61.7 | 62.2 | 63.2 | 63.4 | ||
| Youngest child aged 18 or greater | |||||||||
| Male | 59.1 | 58.3 | 53.2 | 61.1 | 54.5 | 63.0 | 63.3 | ||
| Female | 54.7 | 53.4 | 56.2 | 53.6 | 58.4 | 59.0 | 59.4 | ||
| Total | 55.6 | 54.3 | 55.7 | 55.0 | 57.6 | 59.7 | 60.1 | ||
| All children | |||||||||
| Male | 55.5 | 54.6 | 50.0 | 57.0 | 56.7 | 59.9 | 66.2 | ||
| Female | 48.4 | 48.9 | 48.8 | 51.3 | 51.0 | 52.0 | 55.2 | ||
| Total | 49.1 | 49.5 | 48.9 | 51.9 | 51.7 | 52.8 | 56.4 | ||
| Total of all adult members of family units with children (couples with children and lone parents) | |||||||||
| Youngest child aged 0-5 | |||||||||
| Male | 79.6 | 77.2 | 78.8 | 80.5 | 84.3 | 86.8 | 88.9 | ||
| Female | 53.7 | 54.7 | 55.6 | 57.3 | 59.0 | 61.6 | 62.8 | ||
| Total | 65.7 | 65.1 | 66.4 | 68.1 | 70.9 | 73.4 | 74.9 | ||
| Youngest child aged 6-11 | |||||||||
| Male | 79.9 | 79.3 | 77.6 | 82.6 | 83.5 | 83.4 | 84.9 | ||
| Female | 59.0 | 56.8 | 55.2 | 57.5 | 59.7 | 58.7 | 62.4 | ||
| Total | 68.4 | 66.7 | 65.2 | 68.6 | 70.4 | 69.9 | 72.5 | ||
| Youngest child aged 12-17 | |||||||||
| Male | 76.8 | 78.1 | 75.6 | 78.7 | 81.8 | 85.4 | 84.5 | ||
| Female | 61.4 | 63.6 | 63.4 | 62.3 | 63.4 | 65.8 | 64.0 | ||
| Total | 68.3 | 70.1 | 68.8 | 69.6 | 71.6 | 74.4 | 73.1 | ||
| Youngest child aged 18 or greater | |||||||||
| Male | 70.0 | 68.8 | 67.8 | 72.4 | 72.8 | 75.7 | 76.9 | ||
| Female | 54.3 | 53.6 | 52.9 | 52.6 | 54.2 | 56.8 | 56.6 | ||
| Total | 61.2 | 60.2 | 59.4 | 61.1 | 62.2 | 64.9 | 65.2 | ||
| All children | |||||||||
| Male | 77.4 | 76.2 | 76.0 | 79.2 | 81.7 | 83.8 | 85.0 | ||
| Female | 56.3 | 56.4 | 56.4 | 57.3 | 59.0 | 60.7 | 61.6 | ||
| Total | 65.9 | 65.3 | 65.3 | 67.2 | 69.3 | 71.2 | 72.1 | ||
| Total of all adult members of all family units (couples without children, couples with children and lone parents) | |||||||||
| Male | 76.3 | 75.5 | 75.1 | 77.8 | 80.1 | 82.2 | 83.3 | ||
| Female | 58.7 | 58.5 | 58.1 | 58.9 | 60.3 | 61.9 | 63.1 | ||
| Total | 66.9 | 66.3 | 65.9 | 67.5 | 69.4 | 71.2 | 72.3 | ||
| Other persons | |||||||||
| Child members of family units | |||||||||
| Male | 35.4 | 34.2 | 33.6 | 35.5 | 35.5 | 39.9 | 42.4 | ||
| Female | 37.4 | 35.7 | 35.6 | 36.4 | 35.5 | 37.9 | 42.9 | ||
| Total | 36.3 | 34.9 | 34.5 | 35.9 | 35.5 | 39.0 | 42.6 | ||
| Single person households | |||||||||
| Male | 59.7 | 55.6 | 54.7 | 56.1 | 59.6 | 61.1 | 63.6 | ||
| Female | 64.8 | 66.4 | 64.5 | 64.2 | 62.6 | 64.2 | 64.1 | ||
| Total | 62.0 | 60.4 | 59.2 | 59.7 | 61.0 | 62.6 | 63.8 | ||
| All other persons not otherwise classified | |||||||||
| Male | 64.9 | 63.5 | 62.5 | 62.1 | 63.5 | 64.3 | 63.7 | ||
| Female | 71.6 | 71.4 | 68.7 | 69.2 | 64.9 | 60.8 | 63.2 | ||
| Total | 67.9 | 66.8 | 65.2 | 65.2 | 64.1 | 62.7 | 63.5 | ||
| Total of all other persons | |||||||||
| Male | 46.2 | 44.4 | 43.6 | 45.2 | 46.3 | 48.9 | 51.0 | ||
| Female | 50.4 | 49.0 | 48.6 | 49.1 | 47.8 | 48.1 | 51.6 | ||
| Total | 48.0 | 46.4 | 45.8 | 46.9 | 46.9 | 48.5 | 51.3 | ||
| Total of all persons | |||||||||
| Male | 63.9 | 62.8 | 62.4 | 64.6 | 66.3 | 68.7 | 69.9 | ||
| Female | 56.0 | 55.6 | 55.2 | 55.9 | 56.4 | 57.6 | 59.5 | ||
| Total | 60.0 | 59.2 | 58.8 | 60.2 | 61.3 | 63.1 | 64.7 | ||
| 1 Employment rates include persons aged 15-64 only | |||||||||
| Note: For the purpose of this table, an adult member of a family unit is either a lone parent or a member of a couple. Never married persons (regardless of age) living with a parent or parents are defined as children provided those persons are themselves not part of a separate family unit. In addition users should note that the grossing factors assigned to each spouse within a family unit may differ. | |||||||||
| Table 10 Employment rates1 of adult members of family units classified by composition of family unit and number of children and employment rates of all other persons | |||||||||
| % | |||||||||
| Family unit and non-family unit type/Sex | Q2 10 | Q2 11 | Q2 12 | Q2 13 | Q2 14 | Q2 15 | Q2 16 | ||
| Adult members of family units without children | |||||||||
| Couple without children | |||||||||
| Male | 73.3 | 73.5 | 72.4 | 73.8 | 75.4 | 77.2 | 78.7 | ||
| Female | 66.2 | 65.1 | 63.8 | 63.9 | 64.4 | 65.9 | 67.8 | ||
| Total | 69.7 | 69.2 | 67.9 | 68.7 | 69.7 | 71.4 | 73.0 | ||
| Adult members of family units with children | |||||||||
| Couple with children | |||||||||
| 1 child | |||||||||
| Male | 75.5 | 73.7 | 75.1 | 78.2 | 82.0 | 82.9 | 82.9 | ||
| Female | 62.6 | 62.8 | 61.9 | 63.0 | 62.7 | 66.6 | 65.0 | ||
| Total | 69.1 | 68.2 | 68.5 | 70.5 | 72.2 | 74.7 | 73.7 | ||
| 2 children | |||||||||
| Male | 79.9 | 79.5 | 78.6 | 82.3 | 84.1 | 86.8 | 87.5 | ||
| Female | 60.6 | 60.9 | 62.9 | 62.2 | 64.9 | 65.1 | 66.5 | ||
| Total | 70.4 | 70.2 | 70.9 | 72.3 | 74.6 | 76.0 | 77.0 | ||
| 3 or more children | |||||||||
| Male | 78.5 | 77.0 | 76.1 | 78.3 | 80.8 | 83.3 | 85.8 | ||
| Female | 50.2 | 50.2 | 48.9 | 49.7 | 54.2 | 56.1 | 57.4 | ||
| Total | 64.7 | 63.8 | 62.8 | 64.2 | 67.6 | 69.9 | 71.6 | ||
| All children | |||||||||
| Male | 78.1 | 76.8 | 76.8 | 79.9 | 82.5 | 84.5 | 85.6 | ||
| Female | 58.4 | 58.5 | 58.5 | 58.9 | 61.0 | 63.0 | 63.3 | ||
| Total | 68.4 | 67.7 | 67.7 | 69.4 | 71.8 | 73.8 | 74.4 | ||
| Lone parent | |||||||||
| 1 child | |||||||||
| Male | 57.0 | 47.0 | 47.0 | 52.9 | 55.2 | 58.8 | 65.3 | ||
| Female | 52.6 | 52.2 | 53.1 | 54.6 | 55.1 | 56.5 | 62.0 | ||
| Total | 53.1 | 51.6 | 52.4 | 54.4 | 55.2 | 56.8 | 62.4 | ||
| 2 children | |||||||||
| Male | 53.2 | 65.5 | 53.4 | 60.4 | 64.2 | 67.2 | 61.3 | ||
| Female | 46.3 | 50.1 | 46.0 | 51.1 | 50.6 | 50.9 | 54.1 | ||
| Total | 46.9 | 51.6 | 46.6 | 51.9 | 51.9 | 52.3 | 54.8 | ||
| 3 or more children | |||||||||
| Male | * | [65.3] | [59.4] | * | * | [52.5] | * | ||
| Female | 39.1 | 37.0 | 41.3 | 41.1 | 38.2 | 40.9 | 37.5 | ||
| Total | 40.0 | 39.0 | 42.5 | 43.4 | 39.2 | 42.0 | 41.2 | ||
| All children | |||||||||
| Male | 55.5 | 54.6 | 50.0 | 57.0 | 56.7 | 59.9 | 66.2 | ||
| Female | 48.4 | 48.9 | 48.8 | 51.3 | 51.0 | 52.0 | 55.2 | ||
| Total | 49.1 | 49.5 | 48.9 | 51.9 | 51.7 | 52.8 | 56.4 | ||
| Total of all adult members of family units with children (couples with children and lone parents) | |||||||||
| 1 child | |||||||||
| Male | 74.5 | 72.3 | 73.5 | 76.8 | 80.4 | 81.7 | 81.9 | ||
| Female | 59.6 | 59.6 | 59.1 | 60.4 | 60.4 | 63.7 | 64.1 | ||
| Total | 66.0 | 64.9 | 65.2 | 67.3 | 68.8 | 71.3 | 71.5 | ||
| 2 children | |||||||||
| Male | 79.4 | 79.1 | 78.2 | 81.9 | 83.8 | 86.4 | 86.9 | ||
| Female | 58.1 | 59.0 | 60.0 | 60.3 | 62.7 | 62.7 | 64.2 | ||
| Total | 68.1 | 68.3 | 68.5 | 70.3 | 72.6 | 73.6 | 74.6 | ||
| 3 or more children | |||||||||
| Male | 78.2 | 76.8 | 75.9 | 78.2 | 80.4 | 82.8 | 85.7 | ||
| Female | 48.5 | 48.3 | 47.8 | 48.5 | 52.2 | 54.1 | 54.8 | ||
| Total | 62.6 | 61.8 | 61.1 | 62.6 | 65.6 | 67.7 | 69.3 | ||
| All children | |||||||||
| Male | 77.4 | 76.2 | 76.0 | 79.2 | 81.7 | 83.8 | 85.0 | ||
| Female | 56.3 | 56.4 | 56.4 | 57.3 | 59.0 | 60.7 | 61.6 | ||
| Total | 65.9 | 65.3 | 65.3 | 67.2 | 69.3 | 71.2 | 72.1 | ||
| Total of all adult members of all family units (couples without children, couples with children and lone parents) | |||||||||
| Male | 76.3 | 75.5 | 75.1 | 77.8 | 80.1 | 82.2 | 83.3 | ||
| Female | 58.7 | 58.5 | 58.1 | 58.9 | 60.3 | 61.9 | 63.1 | ||
| Total | 66.9 | 66.3 | 65.9 | 67.5 | 69.4 | 71.2 | 72.3 | ||
| Other persons | |||||||||
| Child members of family units | |||||||||
| Male | 35.4 | 34.2 | 33.6 | 35.5 | 35.5 | 39.9 | 42.4 | ||
| Female | 37.4 | 35.7 | 35.6 | 36.4 | 35.5 | 37.9 | 42.9 | ||
| Total | 36.3 | 34.9 | 34.5 | 35.9 | 35.5 | 39.0 | 42.6 | ||
| Single person households | |||||||||
| Male | 59.7 | 55.6 | 54.7 | 56.1 | 59.6 | 61.1 | 63.6 | ||
| Female | 64.8 | 66.4 | 64.5 | 64.2 | 62.6 | 64.2 | 64.1 | ||
| Total | 62.0 | 60.4 | 59.2 | 59.7 | 61.0 | 62.6 | 63.8 | ||
| All other persons not otherwise classified | |||||||||
| Male | 64.9 | 63.5 | 62.5 | 62.1 | 63.5 | 64.3 | 63.7 | ||
| Female | 71.6 | 71.4 | 68.7 | 69.2 | 64.9 | 60.8 | 63.2 | ||
| Total | 67.9 | 66.8 | 65.2 | 65.2 | 64.1 | 62.7 | 63.5 | ||
| Total of all other persons | |||||||||
| Male | 46.2 | 44.4 | 43.6 | 45.2 | 46.3 | 48.9 | 51.0 | ||
| Female | 50.4 | 49.0 | 48.6 | 49.1 | 47.8 | 48.1 | 51.6 | ||
| Total | 48.0 | 46.4 | 45.8 | 46.9 | 46.9 | 48.5 | 51.3 | ||
| Total of all persons | |||||||||
| Male | 63.9 | 62.8 | 62.4 | 64.6 | 66.3 | 68.7 | 69.9 | ||
| Female | 56.0 | 55.6 | 55.2 | 55.9 | 56.4 | 57.6 | 59.5 | ||
| Total | 60.0 | 59.2 | 58.8 | 60.2 | 61.3 | 63.1 | 64.7 | ||
| 1 Employment rates include persons aged 15-64 only | |||||||||
| Note: For the purpose of this table, an adult member of a family unit is either a lone parent or a member of a couple. Never married persons (regardless of age) living with a parent or parents are defined as children provided those persons are themselves not part of a separate family unit. In addition users should note that the grossing factors assigned to each spouse within a family unit may differ. | |||||||||
| Table 11 Unemployment rates1 of adult members of family units classified by composition of family unit and age of youngest child and unemployment rates of all other persons | |||||||||
| % | |||||||||
| Family unit and non-family unit type/Sex | Q2 10 | Q2 11 | Q2 12 | Q2 13 | Q2 14 | Q2 15 | Q2 16 | ||
| Adult members of family units without children | |||||||||
| Couple without children | |||||||||
| Male | 10.7 | 10.8 | 10.6 | 9.8 | 8.7 | 7.3 | 5.4 | ||
| Female | 6.7 | 7.0 | 7.0 | 6.3 | 5.7 | 5.1 | 5.0 | ||
| Total | 8.8 | 9.0 | 9.0 | 8.2 | 7.3 | 6.3 | 5.2 | ||
| Adult members of family units with children | |||||||||
| Couple with children | |||||||||
| Youngest child aged 0-5 | |||||||||
| Male | 14.7 | 16.3 | 15.5 | 13.8 | 10.5 | 7.9 | 7.0 | ||
| Female | 9.0 | 9.3 | 10.6 | 10.3 | 7.3 | 5.9 | 5.2 | ||
| Total | 12.5 | 13.5 | 13.5 | 12.4 | 9.2 | 7.1 | 6.2 | ||
| Youngest child aged 6-11 | |||||||||
| Male | 13.6 | 13.7 | 14.8 | 10.5 | 9.3 | 9.7 | 8.0 | ||
| Female | 6.6 | 9.5 | 10.4 | 10.9 | 7.7 | 7.6 | 7.1 | ||
| Total | 10.8 | 12.0 | 13.0 | 10.7 | 8.6 | 8.9 | 7.6 | ||
| Youngest child aged 12-17 | |||||||||
| Male | 12.2 | 11.0 | 13.1 | 11.1 | 9.1 | 7.1 | 6.1 | ||
| Female | 6.0 | 5.8 | 5.5 | 7.6 | 6.5 | 5.7 | 5.3 | ||
| Total | 9.6 | 8.8 | 9.8 | 9.7 | 8.0 | 6.5 | 5.7 | ||
| Youngest child aged 18 or greater | |||||||||
| Male | 9.7 | 10.1 | 10.9 | 10.4 | 9.0 | 7.1 | 6.3 | ||
| Female | 3.7 | 6.6 | 5.9 | 6.4 | 6.6 | 3.9 | 3.7 | ||
| Total | 7.2 | 8.6 | 8.8 | 8.7 | 8.0 | 5.8 | 5.2 | ||
| All children | |||||||||
| Male | 13.3 | 13.9 | 14.2 | 12.1 | 9.8 | 8.1 | 6.9 | ||
| Female | 7.0 | 8.3 | 8.9 | 9.3 | 7.1 | 5.9 | 5.4 | ||
| Total | 10.8 | 11.6 | 12.1 | 10.9 | 8.7 | 7.2 | 6.3 | ||
| Lone parent | |||||||||
| Youngest child aged 0-5 | |||||||||
| Male | * | * | * | * | * | * | * | ||
| Female | 20.0 | 22.5 | 24.0 | 21.6 | 19.1 | 17.8 | 15.2 | ||
| Total | 21.1 | 24.0 | 26.4 | 22.9 | 19.5 | 18.1 | 14.9 | ||
| Youngest child aged 6-11 | |||||||||
| Male | [34.3] | * | * | * | * | * | * | ||
| Female | 18.5 | 20.0 | 21.5 | 23.6 | 19.3 | 16.6 | 12.5 | ||
| Total | 19.9 | 20.2 | 21.9 | 23.7 | 21.3 | 18.7 | 13.5 | ||
| Youngest child aged 12-17 | |||||||||
| Male | [19.8] | 27.0 | [18.1] | [26.3] | [20.2] | [7.8] | [8.3] | ||
| Female | 11.5 | 13.1 | 12.4 | 15.5 | 12.8 | 13.6 | 8.3 | ||
| Total | 12.4 | 15.3 | 13.0 | 17.0 | 13.8 | 12.9 | 8.3 | ||
| Youngest child aged 18 or greater | |||||||||
| Male | 12.8 | 18.5 | 13.4 | 13.1 | 16.1 | 13.3 | 11.8 | ||
| Female | 9.0 | 9.1 | 9.1 | 13.1 | 9.8 | 9.3 | 6.5 | ||
| Total | 9.9 | 11.3 | 10.0 | 13.1 | 11.2 | 10.1 | 7.6 | ||
| All children | |||||||||
| Male | 21.1 | 24.8 | 23.8 | 22.1 | 22.1 | 17.7 | 12.9 | ||
| Female | 15.3 | 16.7 | 17.3 | 18.9 | 15.2 | 14.3 | 10.5 | ||
| Total | 16.0 | 17.8 | 18.0 | 19.3 | 16.2 | 14.7 | 10.8 | ||
| Total of all adult members of family units with children (couples with children and lone parents) | |||||||||
| Youngest child aged 0-5 | |||||||||
| Male | 14.9 | 16.5 | 15.8 | 14.0 | 10.6 | 8.0 | 7.0 | ||
| Female | 10.5 | 11.2 | 12.6 | 11.7 | 8.6 | 7.3 | 6.4 | ||
| Total | 13.0 | 14.2 | 14.4 | 13.0 | 9.8 | 7.7 | 6.7 | ||
| Youngest child aged 6-11 | |||||||||
| Male | 14.0 | 13.9 | 14.9 | 10.8 | 9.9 | 10.3 | 8.3 | ||
| Female | 9.5 | 12.1 | 13.0 | 14.3 | 10.1 | 9.5 | 8.2 | ||
| Total | 11.9 | 13.1 | 14.0 | 12.4 | 10.0 | 9.9 | 8.2 | ||
| Youngest child aged 12-17 | |||||||||
| Male | 12.4 | 11.7 | 13.3 | 11.7 | 9.5 | 7.2 | 6.2 | ||
| Female | 7.3 | 7.5 | 7.2 | 9.7 | 8.0 | 7.6 | 6.0 | ||
| Total | 10.0 | 9.6 | 10.3 | 10.7 | 8.8 | 7.4 | 6.1 | ||
| Youngest child aged 18 or greater | |||||||||
| Male | 9.9 | 10.7 | 11.1 | 10.5 | 9.6 | 7.5 | 6.7 | ||
| Female | 5.0 | 7.2 | 6.8 | 8.1 | 7.5 | 5.3 | 4.5 | ||
| Total | 7.6 | 9.0 | 9.0 | 9.4 | 8.6 | 6.4 | 5.6 | ||
| All children | |||||||||
| Male | 13.4 | 14.2 | 14.5 | 12.3 | 10.1 | 8.3 | 7.1 | ||
| Female | 8.7 | 10.0 | 10.6 | 11.3 | 8.6 | 7.5 | 6.4 | ||
| Total | 11.3 | 12.2 | 12.7 | 11.9 | 9.4 | 7.9 | 6.8 | ||
| Total of all adult members of all family units (couples without children, couples with children and lone parents) | |||||||||
| Male | 12.7 | 13.3 | 13.5 | 11.7 | 9.8 | 8.0 | 6.7 | ||
| Female | 8.1 | 9.2 | 9.7 | 10.0 | 7.9 | 6.9 | 6.0 | ||
| Total | 10.6 | 11.4 | 11.7 | 10.9 | 8.9 | 7.5 | 6.4 | ||
| Other persons | |||||||||
| Child members of family units | |||||||||
| Male | 34.1 | 35.2 | 36.5 | 32.1 | 29.3 | 22.5 | 20.4 | ||
| Female | 20.3 | 22.2 | 21.8 | 22.9 | 20.5 | 16.5 | 13.3 | ||
| Total | 28.6 | 30.1 | 30.7 | 28.4 | 25.8 | 20.1 | 17.5 | ||
| Single person households | |||||||||
| Male | 18.2 | 21.3 | 21.4 | 20.9 | 15.8 | 14.7 | 13.5 | ||
| Female | 9.5 | 8.2 | 8.8 | 9.1 | 10.9 | 8.0 | 6.6 | ||
| Total | 14.3 | 15.5 | 15.6 | 15.7 | 13.6 | 11.6 | 10.6 | ||
| All other persons not otherwise classified | |||||||||
| Male | 16.8 | 16.9 | 18.8 | 15.9 | 15.0 | 11.5 | 10.5 | ||
| Female | 9.0 | 6.6 | 8.0 | 7.2 | 7.5 | 6.7 | 6.7 | ||
| Total | 13.4 | 12.6 | 14.1 | 12.1 | 11.8 | 9.4 | 8.9 | ||
| Total of all other persons | |||||||||
| Male | 25.9 | 27.3 | 28.4 | 25.3 | 22.1 | 17.9 | 16.3 | ||
| Female | 14.3 | 14.4 | 14.5 | 15.0 | 14.2 | 11.7 | 9.9 | ||
| Total | 21.0 | 22.0 | 22.6 | 20.9 | 18.8 | 15.3 | 13.6 | ||
| Total of all persons | |||||||||
| Male | 17.1 | 17.8 | 18.2 | 15.9 | 13.6 | 11.1 | 9.8 | ||
| Female | 10.0 | 10.6 | 11.1 | 11.4 | 9.7 | 8.2 | 7.1 | ||
| Total | 13.9 | 14.6 | 15.0 | 13.9 | 11.9 | 9.8 | 8.6 | ||
| 1 Unemployment rates include persons aged 15-74 only | |||||||||
| Note: For the purpose of this table, an adult member of a family unit is either a lone parent or a member of a couple. Never married persons (regardless of age) living with a parent or parents are defined as children provided those persons are themselves not part of a separate family unit. In addition users should note that the grossing factors assigned to each spouse within a family unit may differ. | |||||||||
| Table 12 Unemployment rates1 of adult members of family units classified by composition of family unit and number of children and unemployment rates of all other persons | |||||||||
| % | |||||||||
| Family unit and non-family unit type/Sex | Q2 10 | Q2 11 | Q2 12 | Q2 13 | Q2 14 | Q2 15 | Q2 16 | ||
| Adult members of family units without children | |||||||||
| Couple without children | |||||||||
| Male | 10.7 | 10.8 | 10.6 | 9.8 | 8.7 | 7.3 | 5.4 | ||
| Female | 6.7 | 7.0 | 7.0 | 6.3 | 5.7 | 5.1 | 5.0 | ||
| Total | 8.8 | 9.0 | 9.0 | 8.2 | 7.3 | 6.3 | 5.2 | ||
| Adult members of family units with children | |||||||||
| Couple with children | |||||||||
| 1 child | |||||||||
| Male | 13.7 | 14.7 | 13.2 | 11.6 | 9.2 | 8.1 | 7.0 | ||
| Female | 7.1 | 8.8 | 8.8 | 9.7 | 6.8 | 5.8 | 5.2 | ||
| Total | 10.9 | 12.1 | 11.2 | 10.7 | 8.2 | 7.1 | 6.2 | ||
| 2 children | |||||||||
| Male | 12.3 | 12.8 | 13.8 | 11.6 | 8.8 | 6.4 | 6.6 | ||
| Female | 7.3 | 7.7 | 8.6 | 8.3 | 7.3 | 5.7 | 5.2 | ||
| Total | 10.2 | 10.7 | 11.6 | 10.3 | 8.2 | 6.1 | 6.0 | ||
| 3 or more children | |||||||||
| Male | 14.1 | 14.4 | 16.0 | 13.3 | 11.8 | 10.2 | 7.3 | ||
| Female | 6.5 | 8.2 | 9.7 | 10.4 | 7.2 | 6.3 | 5.9 | ||
| Total | 11.4 | 12.1 | 13.7 | 12.2 | 10.0 | 8.7 | 6.7 | ||
| All children | |||||||||
| Male | 13.3 | 13.9 | 14.2 | 12.1 | 9.8 | 8.1 | 6.9 | ||
| Female | 7.0 | 8.3 | 8.9 | 9.3 | 7.1 | 5.9 | 5.4 | ||
| Total | 10.8 | 11.6 | 12.1 | 10.9 | 8.7 | 7.2 | 6.3 | ||
| Lone parent household | |||||||||
| 1 child | |||||||||
| Male | 22.5 | 31.2 | 27.7 | 25.7 | 24.9 | 23.8 | 12.8 | ||
| Female | 13.4 | 17.6 | 18.0 | 18.4 | 15.3 | 14.2 | 8.3 | ||
| Total | 14.7 | 19.3 | 19.2 | 19.4 | 16.7 | 15.5 | 9.0 | ||
| 2 children | |||||||||
| Male | [12.6] | 17.9 | [19.5] | [17] | [9.7] | [7.6] | [19.3] | ||
| Female | 16.3 | 15.2 | 16.9 | 18.1 | 15.3 | 14.9 | 15.1 | ||
| Total | 15.9 | 15.6 | 17.1 | 18.0 | 14.7 | 14.1 | 15.6 | ||
| 3 or more children | |||||||||
| Male | * | * | * | * | * | * | * | ||
| Female | 20.2 | 16.4 | 15.5 | 22.8 | 14.7 | 13.6 | 7.1 | ||
| Total | 21.1 | 16.0 | 15.2 | 21.9 | 16.9 | 13.1 | 5.9 | ||
| All children | |||||||||
| Male | 21.1 | 24.8 | 23.8 | 22.1 | 22.1 | 17.7 | 12.9 | ||
| Female | 15.3 | 16.7 | 17.3 | 18.9 | 15.2 | 14.3 | 10.5 | ||
| Total | 16.0 | 17.8 | 18.0 | 19.3 | 16.2 | 14.7 | 10.8 | ||
| Total of all adult members of family units with children (couples with children and lone parents) | |||||||||
| 1 child | |||||||||
| Male | 14.1 | 15.5 | 13.8 | 12.2 | 10.0 | 8.8 | 7.3 | ||
| Female | 8.9 | 11.4 | 11.6 | 12.3 | 9.3 | 8.1 | 6.1 | ||
| Total | 11.5 | 13.4 | 12.7 | 12.3 | 9.7 | 8.5 | 6.7 | ||
| 2 children | |||||||||
| Male | 12.3 | 12.9 | 13.8 | 11.7 | 8.8 | 6.5 | 6.9 | ||
| Female | 8.6 | 8.9 | 9.8 | 9.9 | 8.4 | 7.1 | 6.9 | ||
| Total | 10.7 | 11.1 | 12.0 | 10.9 | 8.6 | 6.7 | 6.9 | ||
| 3 or more children | |||||||||
| Male | 14.2 | 14.4 | 15.9 | 13.4 | 12.0 | 10.2 | 7.2 | ||
| Female | 8.4 | 9.2 | 10.5 | 12.0 | 8.0 | 7.1 | 6.0 | ||
| Total | 12.0 | 12.3 | 13.8 | 12.8 | 10.3 | 8.9 | 6.7 | ||
| All children | |||||||||
| Male | 13.4 | 14.2 | 14.5 | 12.3 | 10.1 | 8.3 | 7.1 | ||
| Female | 8.7 | 10.0 | 10.6 | 11.3 | 8.6 | 7.5 | 6.4 | ||
| Total | 11.3 | 12.2 | 12.7 | 11.9 | 9.4 | 7.9 | 6.8 | ||
| Total of all adult members of all family units (couples without children, couples with children and lone parents) | |||||||||
| Male | 12.7 | 13.3 | 13.5 | 11.7 | 9.8 | 8.0 | 6.7 | ||
| Female | 8.1 | 9.2 | 9.7 | 10.0 | 7.9 | 6.9 | 6.0 | ||
| Total | 10.6 | 11.4 | 11.7 | 10.9 | 8.9 | 7.5 | 6.4 | ||
| Other persons | |||||||||
| Child members of family units | |||||||||
| Male | 34.1 | 35.2 | 36.5 | 32.1 | 29.3 | 22.5 | 20.4 | ||
| Female | 20.3 | 22.2 | 21.8 | 22.9 | 20.5 | 16.5 | 13.3 | ||
| Total | 28.6 | 30.1 | 30.7 | 28.4 | 25.8 | 20.1 | 17.5 | ||
| Single person households | |||||||||
| Male | 18.2 | 21.3 | 21.4 | 20.9 | 15.8 | 14.7 | 13.5 | ||
| Female | 9.5 | 8.2 | 8.8 | 9.1 | 10.9 | 8.0 | 6.6 | ||
| Total | 14.3 | 15.5 | 15.6 | 15.7 | 13.6 | 11.6 | 10.6 | ||
| All other persons not otherwise classified | |||||||||
| Male | 16.8 | 16.9 | 18.8 | 15.9 | 15.0 | 11.5 | 10.5 | ||
| Female | 9.0 | 6.6 | 8.0 | 7.2 | 7.5 | 6.7 | 6.7 | ||
| Total | 13.4 | 12.6 | 14.1 | 12.1 | 11.8 | 9.4 | 8.9 | ||
| Total of all other persons | |||||||||
| Male | 25.9 | 27.3 | 28.4 | 25.3 | 22.1 | 17.9 | 16.3 | ||
| Female | 14.3 | 14.4 | 14.5 | 15.0 | 14.2 | 11.7 | 9.9 | ||
| Total | 21.0 | 22.0 | 22.6 | 20.9 | 18.8 | 15.3 | 13.6 | ||
| Total of all persons | |||||||||
| Male | 17.1 | 17.8 | 18.2 | 15.9 | 13.6 | 11.1 | 9.8 | ||
| Female | 10.0 | 10.6 | 11.1 | 11.4 | 9.7 | 8.2 | 7.1 | ||
| Total | 13.9 | 14.6 | 15.0 | 13.9 | 11.9 | 9.8 | 8.6 | ||
| 1 Unemployment rates include persons aged 15-74 only | |||||||||
| Note: For the purpose of this table, an adult member of a family unit is either a lone parent or a member of a couple. Never married persons (regardless of age) living with a parent or parents are defined as children provided those persons are themselves not part of a separate family unit. In addition users should note that the grossing factors assigned to each spouse within a family unit may differ. | |||||||||
| Table 13 Participation rates of adult members of family units classified by composition of family unit and age of youngest child and participation rates of all other persons | |||||||||
| % | |||||||||
| Family unit and non-family unit type/Sex | Q2 10 | Q2 11 | Q2 12 | Q2 13 | Q2 14 | Q2 15 | Q2 16 | ||
| Adult members of family units without children | |||||||||
| Couple without children | |||||||||
| Male | 58.8 | 58.1 | 55.9 | 55.3 | 56.0 | 55.8 | 56.0 | ||
| Female | 52.5 | 51.1 | 48.4 | 47.0 | 47.5 | 47.2 | 48.6 | ||
| Total | 55.7 | 54.7 | 52.2 | 51.2 | 51.8 | 51.5 | 52.3 | ||
| Adult members of family units with children | |||||||||
| Couple with children | |||||||||
| Youngest child aged 0-5 | |||||||||
| Male | 93.6 | 92.7 | 93.8 | 93.6 | 94.5 | 94.5 | 95.6 | ||
| Female | 63.9 | 64.1 | 66.5 | 67.3 | 67.8 | 69.6 | 69.8 | ||
| Total | 79.1 | 78.6 | 80.5 | 80.7 | 81.4 | 82.3 | 82.8 | ||
| Youngest child aged 6-11 | |||||||||
| Male | 93.1 | 92.3 | 91.5 | 92.9 | 92.8 | 93.4 | 92.9 | ||
| Female | 64.4 | 64.9 | 64.6 | 66.1 | 67.1 | 66.0 | 68.8 | ||
| Total | 79.2 | 78.8 | 78.4 | 79.7 | 80.2 | 80.0 | 80.9 | ||
| Youngest child aged 12-17 | |||||||||
| Male | 87.8 | 88.2 | 87.3 | 88.6 | 90.3 | 91.2 | 89.9 | ||
| Female | 65.5 | 68.7 | 67.8 | 67.2 | 68.3 | 71.1 | 68.0 | ||
| Total | 76.8 | 78.6 | 77.7 | 78.0 | 79.4 | 81.3 | 79.0 | ||
| Youngest child aged 18 or greater | |||||||||
| Male | 66.7 | 64.6 | 64.9 | 67.9 | 66.6 | 67.9 | 68.1 | ||
| Female | 49.4 | 48.9 | 47.3 | 48.6 | 47.9 | 50.1 | 48.3 | ||
| Total | 58.2 | 56.8 | 56.2 | 58.2 | 57.3 | 59.0 | 58.2 | ||
| All children | |||||||||
| Male | 86.9 | 85.7 | 86.3 | 87.4 | 87.6 | 88.0 | 87.8 | ||
| Female | 61.2 | 61.6 | 62.2 | 63.1 | 63.5 | 64.8 | 64.4 | ||
| Total | 74.3 | 73.8 | 74.5 | 75.4 | 75.7 | 76.6 | 76.2 | ||
| Lone parent household | |||||||||
| Youngest child aged 0-5 | |||||||||
| Male | * | [66.7] | [80.3] | * | * | * | * | ||
| Female | 43.4 | 50.3 | 50.7 | 52.4 | 47.3 | 49.9 | 52.6 | ||
| Total | 44.3 | 50.9 | 52.0 | 53.4 | 48.9 | 51.2 | 54.1 | ||
| Youngest child aged 6-11 | |||||||||
| Male | [76.2] | [78.1] | [65.3] | [73.0] | [76.7] | [63.0] | [77.9] | ||
| Female | 67.4 | 63.8 | 60.0 | 69.9 | 63.7 | 60.9 | 64.9 | ||
| Total | 68.1 | 64.7 | 60.3 | 70.1 | 64.8 | 61.1 | 66.1 | ||
| Youngest child aged 12-17 | |||||||||
| Male | 71.2 | 74.1 | 68.3 | 74.2 | 78.6 | [80.5] | [73.8] | ||
| Female | 68.7 | 68.7 | 69.8 | 74.1 | 70.4 | 71.4 | 68.0 | ||
| Total | 69.0 | 69.5 | 69.7 | 74.1 | 71.4 | 72.4 | 68.8 | ||
| Youngest child aged 18 or greater | |||||||||
| Male | 46.2 | 45.5 | 39.4 | 44.0 | 42.3 | 43.0 | 46.0 | ||
| Female | 34.4 | 37.7 | 37.6 | 39.1 | 38.3 | 38.5 | 41.0 | ||
| Total | 36.8 | 39.2 | 38.0 | 40.2 | 39.1 | 39.4 | 42.0 | ||
| All children | |||||||||
| Male | 55.8 | 56.3 | 51.5 | 56.3 | 55.6 | 55.1 | 58.7 | ||
| Female | 49.2 | 51.9 | 51.9 | 56.1 | 51.6 | 52.1 | 53.4 | ||
| Total | 50.0 | 52.4 | 51.8 | 56.2 | 52.1 | 52.4 | 54.1 | ||
| Total of all adult members of family units with children (couples with children and lone parents) | |||||||||
| Youngest child aged 0-5 | |||||||||
| Male | 93.5 | 92.5 | 93.7 | 93.6 | 94.4 | 94.3 | 95.6 | ||
| Female | 60.0 | 61.7 | 63.6 | 64.9 | 64.6 | 66.5 | 67.1 | ||
| Total | 75.5 | 75.9 | 77.6 | 78.3 | 78.5 | 79.5 | 80.3 | ||
| Youngest child aged 6-11 | |||||||||
| Male | 92.7 | 92.0 | 91.0 | 92.4 | 92.4 | 92.7 | 92.5 | ||
| Female | 65.1 | 64.6 | 63.4 | 67.0 | 66.4 | 64.9 | 68.0 | ||
| Total | 77.6 | 76.7 | 75.8 | 78.3 | 78.2 | 77.5 | 78.9 | ||
| Youngest child aged 12-17 | |||||||||
| Male | 87.2 | 87.6 | 86.5 | 87.9 | 89.8 | 90.8 | 89.2 | ||
| Female | 66.2 | 68.7 | 68.3 | 68.8 | 68.8 | 71.2 | 68.0 | ||
| Total | 75.8 | 77.2 | 76.4 | 77.4 | 78.2 | 80.0 | 77.4 | ||
| Youngest child aged 18 or greater | |||||||||
| Male | 64.6 | 62.7 | 62.2 | 65.4 | 63.8 | 65.4 | 65.9 | ||
| Female | 44.6 | 45.4 | 44.3 | 45.8 | 44.8 | 46.4 | 45.9 | ||
| Total | 53.4 | 53.0 | 52.1 | 54.4 | 53.1 | 54.7 | 54.5 | ||
| All children | |||||||||
| Male | 85.7 | 84.6 | 85.0 | 86.2 | 86.2 | 86.8 | 86.6 | ||
| Female | 58.4 | 59.3 | 59.8 | 61.5 | 60.8 | 62.0 | 61.9 | ||
| Total | 70.8 | 70.7 | 71.2 | 72.7 | 72.4 | 73.2 | 73.0 | ||
| Total of all adult members of all family units (couples without children, couples with children and lone parents) | |||||||||
| Male | 76.3 | 75.4 | 74.8 | 75.3 | 75.6 | 76.0 | 75.7 | ||
| Female | 56.6 | 56.9 | 56.3 | 57.0 | 56.7 | 57.5 | 57.8 | ||
| Total | 65.9 | 65.5 | 65.0 | 65.6 | 65.6 | 66.2 | 66.1 | ||
| Other persons | |||||||||
| Child members of family units | |||||||||
| Male | 53.7 | 52.9 | 52.9 | 52.3 | 50.2 | 51.4 | 53.3 | ||
| Female | 46.9 | 45.8 | 45.5 | 47.2 | 44.7 | 45.3 | 49.4 | ||
| Total | 50.8 | 49.9 | 49.7 | 50.1 | 47.8 | 48.8 | 51.6 | ||
| Single person households | |||||||||
| Male | 53.8 | 52.9 | 51.4 | 53.4 | 52.0 | 52.2 | 52.5 | ||
| Female | 36.2 | 35.1 | 35.8 | 35.5 | 35.1 | 34.6 | 34.2 | ||
| Total | 44.2 | 43.2 | 42.9 | 43.8 | 42.7 | 42.6 | 42.7 | ||
| All other persons not otherwise classified | |||||||||
| Male | 73.2 | 71.6 | 71.3 | 68.7 | 69.3 | 66.9 | 65.9 | ||
| Female | 65.7 | 62.0 | 60.9 | 60.4 | 58.3 | 53.8 | 56.0 | ||
| Total | 69.7 | 67.2 | 66.4 | 64.8 | 64.2 | 60.6 | 61.3 | ||
| Total of all other persons | |||||||||
| Male | 57.8 | 56.9 | 56.4 | 56.0 | 54.9 | 54.8 | 55.6 | ||
| Female | 47.3 | 45.6 | 45.5 | 45.9 | 44.4 | 43.4 | 45.2 | ||
| Total | 52.8 | 51.6 | 51.3 | 51.2 | 49.9 | 49.4 | 50.8 | ||
| Total of all persons | |||||||||
| Male | 69.0 | 68.1 | 67.8 | 67.9 | 67.7 | 67.9 | 67.8 | ||
| Female | 53.4 | 53.2 | 52.8 | 53.4 | 52.6 | 52.8 | 53.6 | ||
| Total | 61.1 | 60.5 | 60.1 | 60.5 | 60.0 | 60.2 | 60.6 | ||
| Note: For the purpose of this table, an adult member of a family unit is either a lone parent or a member of a couple. Never married persons (regardless of age) living with a parent or parents are defined as children provided those persons are themselves not part of a separate family unit. In addition users should note that the grossing factors assigned to each spouse within a family unit may differ. | |||||||||
| Table 14 Participation rates of adult members of family units classified by composition of family unit and number of children and participation rates of all other persons | |||||||||
| % | |||||||||
| Family unit and non-family unit type/Sex | Q2 10 | Q2 11 | Q2 12 | Q2 13 | Q2 14 | Q2 15 | Q2 16 | ||
| Adult members of family units without children | |||||||||
| Couple without children | |||||||||
| Male | 58.8 | 58.1 | 55.9 | 55.3 | 56.0 | 55.8 | 56.0 | ||
| Female | 52.5 | 51.1 | 48.4 | 47.0 | 47.5 | 47.2 | 48.6 | ||
| Total | 55.7 | 54.7 | 52.2 | 51.2 | 51.8 | 51.5 | 52.3 | ||
| Adult members of family units with children | |||||||||
| Couple with children | |||||||||
| 1 child | |||||||||
| Male | 80.9 | 78.9 | 78.7 | 80.5 | 81.4 | 81.4 | 79.7 | ||
| Female | 63.3 | 63.4 | 62.6 | 64.8 | 61.9 | 65.2 | 62.0 | ||
| Total | 72.3 | 71.3 | 70.8 | 72.7 | 71.7 | 73.4 | 70.9 | ||
| 2 children | |||||||||
| Male | 89.6 | 89.3 | 90.2 | 91.6 | 90.8 | 90.9 | 91.8 | ||
| Female | 64.6 | 65.1 | 68.1 | 67.2 | 68.9 | 68.3 | 69.2 | ||
| Total | 77.4 | 77.3 | 79.3 | 79.6 | 80.0 | 79.8 | 80.6 | ||
| 3 or more children | |||||||||
| Male | 90.8 | 89.4 | 89.8 | 89.9 | 90.6 | 92.2 | 92.3 | ||
| Female | 53.5 | 54.6 | 54.0 | 55.2 | 58.1 | 59.7 | 60.9 | ||
| Total | 72.7 | 72.3 | 72.3 | 72.8 | 74.6 | 76.2 | 76.7 | ||
| All children | |||||||||
| Male | 86.9 | 85.7 | 86.3 | 87.4 | 87.6 | 88.0 | 87.8 | ||
| Female | 61.2 | 61.6 | 62.2 | 63.1 | 63.5 | 64.8 | 64.4 | ||
| Total | 74.3 | 73.8 | 74.5 | 75.4 | 75.7 | 76.6 | 76.2 | ||
| Lone parent household | |||||||||
| 1 child | |||||||||
| Male | 52.4 | 48.9 | 48.4 | 51.2 | 53.4 | 52.8 | 54.3 | ||
| Female | 48.7 | 52.0 | 52.9 | 55.5 | 51.9 | 51.6 | 53.7 | ||
| Total | 49.2 | 51.6 | 52.3 | 54.9 | 52.1 | 51.8 | 53.8 | ||
| 2 children | |||||||||
| Male | 57.5 | 70.4 | 55.4 | 61.8 | 58.0 | 60.9 | 62.5 | ||
| Female | 51.2 | 56.2 | 52.1 | 59.2 | 55.6 | 55.9 | 59.7 | ||
| Total | 51.8 | 57.8 | 52.5 | 59.4 | 55.8 | 56.4 | 60.1 | ||
| 3 or more children | |||||||||
| Male | [76.4] | [69.3] | [63.8] | [79.5] | [65.2] | [55.8] | * | ||
| Female | 47.7 | 43.7 | 48.2 | 52.8 | 43.4 | 46.8 | 39.7 | ||
| Total | 49.7 | 45.8 | 49.3 | 55.0 | 45.5 | 47.8 | 43.0 | ||
| All children | |||||||||
| Male | 55.8 | 56.3 | 51.5 | 56.3 | 55.6 | 55.1 | 58.7 | ||
| Female | 49.2 | 51.9 | 51.9 | 56.1 | 51.6 | 52.1 | 53.4 | ||
| Total | 50.0 | 52.4 | 51.8 | 56.2 | 52.1 | 52.4 | 54.1 | ||
| Total of all adult members of family units with children (couples with children and lone parents) | |||||||||
| 1 child | |||||||||
| Male | 78.9 | 76.8 | 76.5 | 78.3 | 79.1 | 79.4 | 77.9 | ||
| Female | 58.4 | 59.7 | 59.3 | 61.8 | 58.5 | 60.8 | 59.3 | ||
| Total | 67.1 | 67.0 | 66.6 | 68.8 | 67.3 | 68.7 | 67.2 | ||
| 2 children | |||||||||
| Male | 88.9 | 88.8 | 89.4 | 91.0 | 90.0 | 90.2 | 91.0 | ||
| Female | 62.2 | 63.5 | 65.2 | 65.8 | 66.8 | 66.1 | 67.4 | ||
| Total | 74.7 | 75.2 | 76.5 | 77.5 | 77.7 | 77.3 | 78.2 | ||
| 3 or more children | |||||||||
| Male | 90.6 | 89.2 | 89.4 | 89.7 | 90.2 | 91.5 | 92.0 | ||
| Female | 52.6 | 53.0 | 53.1 | 54.9 | 56.2 | 57.9 | 58.1 | ||
| Total | 70.7 | 70.1 | 70.3 | 71.5 | 72.4 | 73.9 | 74.1 | ||
| All children | |||||||||
| Male | 85.7 | 84.6 | 85.0 | 86.2 | 86.2 | 86.8 | 86.6 | ||
| Female | 58.4 | 59.3 | 59.8 | 61.5 | 60.8 | 62.0 | 61.9 | ||
| Total | 70.8 | 70.7 | 71.2 | 72.7 | 72.4 | 73.2 | 73.0 | ||
| Total of all adult members of all family units (couples without children, couples with children and lone parents) | |||||||||
| Male | 76.3 | 75.4 | 74.8 | 75.3 | 75.6 | 76.0 | 75.7 | ||
| Female | 56.6 | 56.9 | 56.3 | 57.0 | 56.7 | 57.5 | 57.8 | ||
| Total | 65.9 | 65.5 | 65.0 | 65.6 | 65.6 | 66.2 | 66.1 | ||
| Other persons | |||||||||
| Child members of family units | |||||||||
| Male | 53.7 | 52.9 | 52.9 | 52.3 | 50.2 | 51.4 | 53.3 | ||
| Female | 46.9 | 45.8 | 45.5 | 47.2 | 44.7 | 45.3 | 49.4 | ||
| Total | 50.8 | 49.9 | 49.7 | 50.1 | 47.8 | 48.8 | 51.6 | ||
| Single person households | |||||||||
| Male | 53.8 | 52.9 | 51.4 | 53.4 | 52.0 | 52.2 | 52.5 | ||
| Female | 36.2 | 35.1 | 35.8 | 35.5 | 35.1 | 34.6 | 34.2 | ||
| Total | 44.2 | 43.2 | 42.9 | 43.8 | 42.7 | 42.6 | 42.7 | ||
| All other persons not otherwise classified | |||||||||
| Male | 73.2 | 71.6 | 71.3 | 68.7 | 69.3 | 66.9 | 65.9 | ||
| Female | 65.7 | 62.0 | 60.9 | 60.4 | 58.3 | 53.8 | 56.0 | ||
| Total | 69.7 | 67.2 | 66.4 | 64.8 | 64.2 | 60.6 | 61.3 | ||
| Total of all other persons | |||||||||
| Male | 57.8 | 56.9 | 56.4 | 56.0 | 54.9 | 54.8 | 55.6 | ||
| Female | 47.3 | 45.6 | 45.5 | 45.9 | 44.4 | 43.4 | 45.2 | ||
| Total | 52.8 | 51.6 | 51.3 | 51.2 | 49.9 | 49.4 | 50.8 | ||
| Total of all persons | |||||||||
| Male | 69.0 | 68.1 | 67.8 | 67.9 | 67.7 | 67.9 | 67.8 | ||
| Female | 53.4 | 53.2 | 52.8 | 53.4 | 52.6 | 52.8 | 53.6 | ||
| Total | 61.1 | 60.5 | 60.1 | 60.5 | 60.0 | 60.2 | 60.6 | ||
| Note: For the purpose of this table, an adult member of a family unit is either a lone parent or a member of a couple. Never married persons (regardless of age) living with a parent or parents are defined as children provided those persons are themselves not part of a separate family unit. In addition users should note that the grossing factors assigned to each spouse within a family unit may differ. | |||||||||
| Table 15 Duration of unemployment of adult members of family units classified by composition of family unit and sex | ||||||||||
| '000 | ||||||||||
| Family unit type/Duration of unemployment/Sex | Q2 10 | Q2 11 | Q2 12 | Q2 13 | Q2 14 | Q2 15 | Q2 16 | |||
| Couple without children | ||||||||||
| Less than 1 year | ||||||||||
| Male | 12.7 | 9.6 | 8.3 | 7.0 | 5.9 | 5.1 | [4.3] | |||
| Female | 8.4 | 7.0 | 6.0 | 5.4 | 5.1 | [3.8] | [4.5] | |||
| Total | 21.1 | 16.6 | 14.4 | 12.4 | 11.0 | 8.9 | 8.8 | |||
| 1 year or over | ||||||||||
| Male | 10.4 | 13.2 | 13.8 | 13.4 | 12.1 | 10.1 | 6.9 | |||
| Female | 4.2 | 6.0 | 6.4 | 5.7 | 4.9 | 5.1 | [4.3] | |||
| Total | 14.6 | 19.2 | 20.3 | 19.1 | 17.0 | 15.2 | 11.2 | |||
| Not stated | ||||||||||
| Male | * | * | * | * | * | * | * | |||
| Female | * | * | * | * | * | * | * | |||
| Total | * | * | * | * | * | * | * | |||
| Total | ||||||||||
| Male | 23.3 | 23.3 | 22.3 | 20.4 | 18.2 | 15.2 | 11.5 | |||
| Female | 12.7 | 13.1 | 12.6 | 11.2 | 10.2 | 8.9 | 9.3 | |||
| Total | 36.0 | 36.3 | 34.9 | 31.6 | 28.4 | 24.2 | 20.8 | |||
| Couple with children | ||||||||||
| Less than 1 year | ||||||||||
| Male | 37.0 | 28.2 | 21.9 | 20.5 | 18.3 | 14.2 | 13.4 | |||
| Female | 17.0 | 15.3 | 16.1 | 18.4 | 13.5 | 12.6 | 14.2 | |||
| Total | 54.0 | 43.5 | 38.0 | 39.0 | 31.7 | 26.9 | 27.6 | |||
| 1 year or over | ||||||||||
| Male | 40.2 | 52.1 | 61.2 | 50.3 | 38.9 | 33.0 | 25.7 | |||
| Female | 10.6 | 18.0 | 19.8 | 20.2 | 16.1 | 12.8 | 8.7 | |||
| Total | 50.8 | 70.1 | 81.1 | 70.5 | 55.0 | 45.8 | 34.4 | |||
| Not stated | ||||||||||
| Male | * | * | * | * | * | * | * | |||
| Female | * | * | * | * | * | * | * | |||
| Total | * | * | * | * | * | * | * | |||
| Total | ||||||||||
| Male | 77.5 | 80.6 | 83.5 | 71.5 | 57.7 | 48.4 | 40.5 | |||
| Female | 27.6 | 33.6 | 36.3 | 38.8 | 29.7 | 25.4 | 23.0 | |||
| Total | 105.1 | 114.2 | 119.8 | 110.3 | 87.4 | 73.8 | 63.5 | |||
| Lone parent | ||||||||||
| Less than 1 year | ||||||||||
| Male | * | * | * | * | * | * | * | |||
| Female | 8.6 | 8.1 | 8.3 | 9.3 | 6.3 | 6.6 | [4.4] | |||
| Total | 9.5 | 8.9 | 9.6 | 9.8 | 7.1 | 7.2 | [5.0] | |||
| 1 year or over | ||||||||||
| Male | * | [3.0] | * | [2.7] | * | * | * | |||
| Female | 6.2 | 8.9 | 9.7 | 11.1 | 8.2 | 7.6 | 6.1 | |||
| Total | 8.2 | 11.9 | 11.7 | 13.9 | 10.7 | 9.6 | 7.5 | |||
| Not stated | ||||||||||
| Male | * | * | * | * | * | * | * | |||
| Female | * | * | * | * | * | * | * | |||
| Total | * | * | * | * | * | * | * | |||
| Total | ||||||||||
| Male | [3.0] | [3.8] | [3.2] | [3.3] | [3.5] | * | * | |||
| Female | 14.9 | 17.3 | 18.2 | 20.4 | 14.7 | 14.3 | 10.8 | |||
| Total | 17.8 | 21.0 | 21.4 | 23.7 | 18.2 | 16.8 | 12.9 | |||
| All family units | ||||||||||
| Less than 1 year | ||||||||||
| Male | 50.7 | 38.6 | 31.5 | 28.1 | 25.1 | 19.9 | 18.3 | |||
| Female | 34.0 | 30.4 | 30.4 | 33.1 | 24.8 | 23.0 | 23.1 | |||
| Total | 84.7 | 69.0 | 61.9 | 61.2 | 49.9 | 42.9 | 41.4 | |||
| 1 year or over | ||||||||||
| Male | 52.6 | 68.3 | 77.0 | 66.4 | 53.4 | 45.0 | 34.0 | |||
| Female | 21.0 | 32.9 | 36.0 | 37.0 | 29.2 | 25.5 | 19.1 | |||
| Total | 73.6 | 101.2 | 113.0 | 103.5 | 82.6 | 70.5 | 53.1 | |||
| Not stated | ||||||||||
| Male | * | * | * | * | * | * | * | |||
| Female | * | * | * | * | * | * | * | |||
| Total | * | * | * | * | * | * | * | |||
| Total | ||||||||||
| Male | 103.7 | 107.7 | 109.0 | 95.2 | 79.4 | 66.2 | 54.1 | |||
| Female | 55.2 | 63.9 | 67.1 | 70.4 | 54.5 | 48.6 | 43.0 | |||
| Total | 158.9 | 171.6 | 176.1 | 165.5 | 134.0 | 114.8 | 97.2 | |||
| Note: For the purpose of this table, an adult member of a family unit is either a lone parent or a member of a couple. Never married persons (regardless of age) living with a parent or parents are defined as children provided those persons are themselves not part of a separate family unit. In addition users should note that the grossing factors assigned to each spouse within a family unit may differ. | ||||||||||
Purpose of Survey
The Quarterly National Household Survey (QNHS) began in September 1997, replacing the annual April Labour Force Survey (LFS). The purpose of the survey is the production of quarterly labour force estimates and occasional reports on special social topics. The survey meets the requirements of Council Regulation (EC) No. 577/98, adopted in March 1998, which requires the introduction of quarterly labour force surveys in EU member states.
Reference Period
Information is collected continuously throughout the year from households surveyed each week in each quarter. Up to and including the fourth quarter of 2008 the QNHS operated on a seasonal quarter basis since its establishment in Q4 1997. As of the first quarter of 2009 the Quarterly National Household Survey (QNHS) is now undertaken on a calendar quarter basis.
The reference quarters for survey results are:
Q1 - January to March, Q2 - April to June, Q3 - July to September and Q4 - October to December.
Data Collection
Information is collected on tablet computers, using computer-assisted personal interview (CAPI) software.
Sample Design
A two-stage sample design is used. A new sample was introduced in Q4 2012 following the 2011 Census of Population. The sample frame of households is clustered into blocks (small areas) with each block containing a minimum of 60 occupied households on the night of the 2011 Census of Population. The sample frame is stratified using administrative county and population density. In the first stage 1,300 blocks are selected using Probability Proportional to Size (PPS) sampling and in the second stage 20 households are selected using Simple Random Sampling (SRS). This ensures that each household in the sample frame has an equal probability of selection and results in a total quarterly sample of 26,000 households. The actual achieved sample varies over time depending on the level of response.
The number of valid responding households in Q2 2016, the most recent quarter for which data is included in this release, was 16,420.
Households are asked to take part in the survey for five consecutive quarters and are then replaced by other households in the same block. Thus, one fifth of the households in the survey are replaced each quarter and the QNHS sample involves an overlap of 80% between consecutive quarters and 20% between the same quarter in consecutive years. As the new sample based on the 2011 Census of Population was introduced incrementally across each quarter from Q4 2012 to Q4 2013, the new sample is fully effective from Q4 2013.
The survey results are weighted to agree with population estimates broken down by age, sex and region and are also calibrated to nationality control totals. The population estimates for April of each year are published in a separate release.
Estimated number of households
The average grossing factor of all members of a household is used to calculate the number of households. As a result, the number of households should be treated as indicative only.
Family unit coding
For the purpose of the data in this release it can be noted that an adult member of a family unit is either a lone parent or a member of a couple. Never married persons (regardless of age) living with a parent or parents are defined as children provided those persons are themselves not part of a separate family unit. In addition users should note that the adjustment factors assigned to each spouse within a family unit may differ.
A family unit itself consists of either:
1. a married couple, or
2. a married couple and one or more of their never-married children, or
3. one parent and one or more of his or her never-married children, or
4. a couple living together (with never-married children, if any) who are not married to each other, where it is clear that the couple form a “de facto” family unit.
Households may contain more than one family unit or may contain a family together with other persons not in a family unit as defined above.
Jobless Households
The Quarterly National Household Survey is the official source of data for the jobless household indicator.
The indicator "People aged 18 - 59 years living in jobless households" is calculated as the share of persons aged 18 - 59 who are living in households where no one is in employment. Students aged 18 - 24 who live in households composed solely of students (persons who have indicated that their Principal Economic Status is Student) of the same age class are not included. The indicator "People aged 0 - 17 years living in jobless households" is calculated as the share of persons aged 0 - 17 who are living in households where no one is in employment.
Comparison to Census of Population results
The data in this release is not directly comparable to the results from the Census of Population. Both sources are collected in different ways and this can lead to differences in estimates between the two sources. In addition, as noted above, the QNHS is a voluntary sample survey, while the Census of Population is a mandatory survey of the entire population. In addition, the Census of Population is a self-completed paper questionnaire whereas a face to face interviewer asks the QNHS questions using computer-assisted personal interview (CAPI) and that may lead to differences in understanding and interpreting the questions.
Statistical significance
All estimates based on sample surveys are subject to error, some of which is measurable. Where an estimate is statistically significantly different from another estimate it means that we can be 95% confident that differences between those two estimates are not due to sampling error.
Usual residence and de facto population concepts
Up to and including Q1 2006 the annual population estimates were calculated using the de facto definition of population (i.e. all persons present in the State). From Q2 2006 onwards a new concept of usual residence has been used, i.e. all persons usually resident and present in the state plus absent persons who are usually resident in Ireland but are temporarily away from home and outside the State.
ILO Labour Force Classification
The primary classification used for the QNHS results is the ILO (International Labour Office) labour force classification. Labour Force Survey data on this basis have been published since 1988. The ILO classification distinguishes the following main subgroups of the population aged 15 or over:
In Employment: Persons who worked in the week before the survey for one hour or more for payment or profit, including work on the family farm or business and all persons who had a job but were not at work because of illness, holidays etc. in the week.
Unemployed: Persons aged 15 to 74 who, in the week before the survey, were without work and available for work within the next two weeks, and had taken specific steps, in the preceding four weeks, to find work.
Inactive Population (not in labour force): All other persons.
The labour force comprises persons employed plus unemployed.
Participation, Employment and Unemployment Rates
The rates given in this release are based on the ILO classification. The Participation Rate is the number of persons in the labour force expressed as a percentage of the total population aged 15 or over. The Employment Rate is the number of employed persons aged 15 to 64 expressed as a percentage of the total population aged 15 to 64. The Unemployment Rate is the number of unemployed persons aged 15 to 74 expressed as a percentage of the total labour force aged 15-74.
Duration of Unemployment
The duration of unemployment is the length of time since a person last had a job or began looking for work, whichever is more recent. The long-term unemployment rate is the number of persons unemployed for one year or more expressed as a percentage of the total labour force aged 15 to 74 years.
NUTS2 and NUTS3 regions
The regional classifications in this release are based on the NUTS (Nomenclature of Territorial Units) classification used by Eurostat. The NUTS3 regions correspond to the eight Regional Authorities established under the Local Government Act, 1991 (Regional Authorities) (Establishment) Order, 1993, which came into operation on 1 January 1994. The NUTS2 regions, which were proposed by Government and agreed by Eurostat in 1999, are groupings of the NUTS3 regions. The composition of the regions is set out below.
| Border, Midland and Western NUTS2 Region | Southern and Eastern NUTS2 Region | ||
| Border |
Cavan |
Dublin | Dublin City |
| Donegal | Dun Laoghaire-Rathdown | ||
| Leitrim | Fingal | ||
| Louth | South Dublin | ||
| Monaghan | |||
| Sligo | Mid-East | Kildare | |
| Meath | |||
| Midland | Laois | Wicklow | |
| Longford | |||
| Offaly | Mid-West | Clare | |
| Westmeath | Limerick City | ||
| Limerick County | |||
| West | Galway City | North Tipperary | |
| Galway County | |||
| Mayo | South-East | Carlow | |
| Roscommon | Kilkenny | ||
| South Tipperary | |||
| Waterford City | |||
| Waterford County | |||
| Wexford | |||
| South-West | Cork City | ||
| Cork County | |||
| Kerry | |||
Reliability of Estimates Presented
Estimates for number of persons where there are less than 30 persons in a cell are too small to be considered reliable. These estimates are presented with an asterisk (*) in the relevant tables.
Where there are 30-49 persons in a cell, estimates are considered to have a wider margin of error and should be treated with caution. These cells are presented with parentheses [ ].
In the case of rates, these limits apply to the denominator used in generating the rate. In the case of annual changes, both the current year and the preceding year are taken into account when deciding whether the estimate should be suppressed or flagged as having a wider margin of error.
Calculation of Rates and Estimates of Change
Rates and estimates of change presented in this release are calculated from whole unrounded numbers. Due to rounding, these may differ from the rates and estimates of change calculated from the rounded volumes presented in the tables.
Interpretation of volume and rate changes
The overall change in the number of people employed, unemployed, in the labour force and not in the labour force is a function both of changes in the population as well as changes in the proportion of people with that status. Therefore, in interpreting changes in the volume of persons who are employed, unemployed etc, both changes in population and changes in the relevant rates should be considered.
In recent years there has been a natural decline in the number of people in younger age groups arising from the falling number of births through the 1980’s until 1994 when a low of 48,255 births was recorded (compared with 74,278 in 2009). For example there were 326,030 people born in Ireland between 1982 and 1986 and, all other things being equal, these people would have been in the 20-24 age group in 2006. However between 1986 and 1990 there were nearly 50,000 fewer births which would create a natural decrease in the 20-24 age group of close to 50,000 between 2006 and 2010.
In addition to natural changes in population, net migration has been a significant feature of population change in Ireland in recent years and net migration has also been most heavily concentrated in younger age groups. Evidence shows that migration is also most heavily concentrated in the 20-24 and 25-34 age groups. As a result of both natural decrease and net outward migration, the population of persons in the younger age groups has fallen and this should be borne in mind when considering the changes in the number of people in these age groups who are employed, unemployed and in the labour force.
Main QNHS release and data series
The quarterly QNHS release can be accessed through the CSO website and is available, along with other additional series, at the link below:
http://www.cso.ie/shorturl.aspx/435
Labour market data can also be accessed from Statbank, the CSO’s main data dissemination service which can be accessed through the CSO website at the link below:
http://www.cso.ie/shorturl.aspx/78
Participating Households
The Central Statistics Office wishes to thank the participating households for their co-operation in agreeing to take part in the survey and for facilitating the collection of the relevant data.
 Hide Background Notes
Scan the QR code below to view this release online or go to
http://www.cso.ie/en/releasesandpublications/er/qnhs-fu/qnhshouseholdsandfamilyunitsq22016/
 Hide Table 1 Proportion of persons in jobless households by NUTS2 and NUTS3 regions, age and gender