
This release has been compiled during the COVID-19 crisis. The results contained in this release reflect some of the economic impacts of the COVID-19 situation. For further information see Information Note - Implications of COVID-19 on Planning Permissions Q1 2021
| Number of dwelling units granted planning permission in Quarter 1 of 2020 and 2021 | |||
| Houses | Apartments | Total | |
| Quarter 1 2020 | 5,091 | 9,041 | 14,132 |
| Quarter 1 2021 | 3,089 | 3,874 | 6,963 |
| % change | -39.3% | -57.2% | -50.7% |
The number of dwelling units granted planning permission in the first quarter of 2021 was 6,963, of which 3,874 were apartments and 3,089 were houses. The number of apartment units approved decreased by 57.2% in the year since the first quarter of 2020. There was an annual decrease of 39.3% in houses approved in the current quarter, resulting in a total annual decrease in dwelling units approved of 50.7%. See Headline Table and Table 5.
The number of planning permissions granted for new dwellings increased by 13.1%, while the number of dwelling units approved decreased in the year to quarter 1 2021. This was largely due to the decline in the number of Strategic Housing Development (SHD) dwelling units approved, with SHD apartment units down 62.0% and SHD housing units down 92.5%. When interpreting this data users are advised to note that SHD planning permissions can have a significant impact on the number of dwelling units approved. See Table 2, Figure 5 and Table 7.
The first quarter figures also show that:
| X-axis label | Houses | Private flats/apartments |
|---|---|---|
| Q12006 | 16454 | 6070 |
| Q22006 | 15014 | 4083 |
| Q32006 | 15486 | 5397 |
| Q42006 | 13054 | 3197 |
| Q12007 | 15654 | 4884 |
| Q22007 | 18201 | 5787 |
| Q32007 | 15838 | 6300 |
| Q42007 | 13135 | 4598 |
| Q12008 | 13301 | 5281 |
| Q22008 | 12598 | 7344 |
| Q32008 | 11532 | 3761 |
| Q42008 | 10375 | 3392 |
| Q12009 | 10256 | 3921 |
| Q22009 | 7739 | 5092 |
| Q32009 | 5362 | 3222 |
| Q42009 | 3457 | 1507 |
| Q12010 | 3585 | 1925 |
| Q22010 | 3043 | 2335 |
| Q32010 | 2817 | 1824 |
| Q42010 | 2159 | 790 |
| Q12011 | 3075 | 592 |
| Q22011 | 2599 | 711 |
| Q32011 | 1887 | 625 |
| Q42011 | 1537 | 619 |
| Q12012 | 1263 | 92 |
| Q22012 | 1166 | 240 |
| Q32012 | 1540 | 98 |
| Q42012 | 1420 | 431 |
| Q12013 | 1860 | 448 |
| Q22013 | 1496 | 430 |
| Q32013 | 1252 | 157 |
| Q42013 | 1394 | 162 |
| Q12014 | 1446 | 158 |
| Q22014 | 1492 | 114 |
| Q32014 | 1783 | 361 |
| Q42014 | 1905 | 152 |
| Q12015 | 2514 | 699 |
| Q22015 | 2637 | 473 |
| Q32015 | 2345 | 359 |
| Q42015 | 2754 | 1263 |
| Q12016 | 2534 | 557 |
| Q22016 | 2340 | 801 |
| Q32016 | 4199 | 1190 |
| Q42016 | 3245 | 1084 |
| Q12017 | 3754 | 896 |
| Q22017 | 3630 | 823 |
| Q32017 | 3764 | 975 |
| Q42017 | 4292 | 2642 |
| Q12018 | 5758 | 1867 |
| Q22018 | 4951 | 1826 |
| Q32018 | 4879 | 3139 |
| Q42018 | 4376 | 2306 |
| Q12019 | 4901 | 2592 |
| Q22019 | 4936 | 4630 |
| Q32019 | 4934 | 5174 |
| Q42019 | 4899 | 7195 |
| Q12020 | 5091 | 9041 |
| Q22020 | 3063 | 4208 |
| Q32020 | 5728 | 7871 |
| Q42020 | 4432 | 5104 |
| Q12021 | 3089 | 3874 |
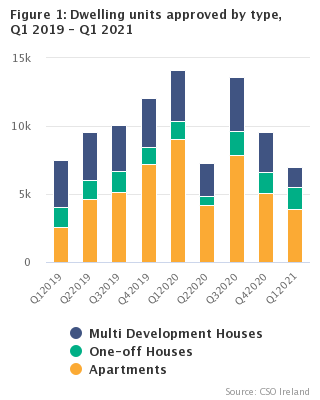
In quarter 3 of 2019, for the first time, more apartments than houses were granted planning permission, a trend which has continued up to the current quarter. In the first quarter of 2021, apartments granted planning permissions accounted for 55.6% of approvals granted for total dwelling units. See Figure 2 and Table 1 & Table 5.
| Table 1 Summary of planning permissions granted for new dwelling units, Q1 2019 - Q1 2021 | |||||||||||||
| Period | Multi- Development Houses | Annual % change | One-off houses | Annual % change | All Houses | Annual % change | Apartments | Annual % change | Total Dwellings (All Houses & Apartments) | Annual % change | |||
| 2019 | Q 1 | 3,445 | -21.1% | 1,456 | 4.7% | 4,901 | -14.9% | 2,592 | 38.8% | 7,493 | -1.7% | ||
| Q 21 | 3,549 | -2.4% | 1,387 | 5.5% | 4,936 | -0.3% | 4,630 | 153.6% | 9,566 | 41.2% | |||
| Q 31 | 3,401 | -1.8% | 1,514 | 6.9% | 4,915 | 0.7% | 5,174 | 64.8% | 10,089 | 25.8% | |||
| Q 41 | 3,634 | 20.5% | 1,265 | -6.9% | 4,899 | 12.0% | 7,195 | 212.0% | 12,094 | 81.0% | |||
| Year | 14,029 | -3.1% | 5,622 | 2.6% | 19,651 | -1.6% | 19,591 | 114.4% | 39,242 | 34.8% | |||
| 2020 | Q 11 | 3,736 | 8.4% | 1,355 | -6.9% | 5,091 | 3.9% | 9,041 | 248.8% | 14,132 | 88.6% | ||
| Q 21 | 2,394 | -32.5% | 669 | -51.8% | 3,063 | -37.9% | 4,208 | -9.1% | 7,271 | -24.0% | |||
| Q 31 | 3,974 | 16.8% | 1,754 | 15.9% | 5,728 | 16.5% | 7,871 | 52.1% | 13,599 | 34.8% | |||
| Q 4 | 2,918 | -19.7% | 1,514 | 19.7% | 4,432 | -9.5% | 5,104 | -29.1% | 9,536 | -21.2% | |||
| Year | 13,022 | -7.2% | 5,292 | -5.9% | 18,314 | -6.8% | 26,224 | 33.9% | 44,538 | 13.5% | |||
| 2021 | Q 1 | 1,428 | -61.8% | 1,661 | 22.6% | 3,089 | -39.3% | 3,874 | -57.2% | 6,963 | -50.7% | ||
| 1 Revised due to additional information. | |||||||||||||
A total of 7,511 planning permissions were granted for all developments in the current quarter. Of these permissions, 53.2% were for new constructions, 29.2% for extensions and 17.6% for alterations and conversions. See Table 2 and Figure 3a.
| For long labels below use to display on multiple lines | Type |
|---|---|
| New constructions | 53.2 |
| Extensions | 29.2 |
| Alterations and conversions | 17.6 |
| X-axis label | New constructions | Extensions | Alterations and conversions |
|---|---|---|---|
| 2019 Q1 | 3866 | 1924 | 1153 |
| 2019 Q2 | 3848 | 1969 | 1224 |
| 2019 Q3 | 4303 | 2125 | 1293 |
| 2019 Q4 | 3526 | 1611 | 1049 |
| 2020 Q1 | 3790 | 1736 | 1123 |
| 2020 Q2 | 1961 | 874 | 554 |
| 2020 Q3 | 4753 | 2370 | 1419 |
| 2020 Q4 | 4010 | 1860 | 1147 |
| 2021 Q1 | 3995 | 2191 | 1325 |
There were 7,511 planning permissions granted for all developments in quarter 1 of 2021. This compares with 6,649 permissions in the first quarter of 2020, an increase of 13.0%. There was an increase of 26.2% in planning permissions granted for extensions, 18.0% for alterations and conversions and 5.4% for new constructions when compared to quarter 1 2020. See Table 2 and Figure 3b.
| Table 2 Summary of planning permissions granted, Q1 2013 - Q1 2021 | |||||||||||
| Number of Permissions | Total Floor Area (000 square metres)3 | ||||||||||
| Period | New Construction Dwellings | New Construction Other | Extensions | Alterations and Conversions | Total | New Construction Dwellings | New Construction Other | Extensions | Total2 | ||
| 2013 | Q 1 | 862 | 785 | 1,296 | 332 | 3,275 | 394 | 366 | 169 | 930 | |
| Q 2 | 772 | 754 | 1,489 | 353 | 3,368 | 333 | 331 | 170 | 834 | ||
| Q 3 | 931 | 904 | 1,665 | 375 | 3,875 | 282 | 312 | 229 | 823 | ||
| Q 4 | 751 | 988 | 1,245 | 399 | 3,383 | 295 | 297 | 159 | 751 | ||
| Year | 3,316 | 3,431 | 5,695 | 1,459 | 13,901 | 1,305 | 1,306 | 727 | 3,338 | ||
| 2014 | Q 1 | 891 | 1,006 | 1,396 | 540 | 3,833 | 336 | 229 | 180 | 744 | |
| Q 2 | 875 | 1,091 | 1,590 | 593 | 4,149 | 296 | 242 | 174 | 712 | ||
| Q 3 | 962 | 1,183 | 1,705 | 478 | 4,328 | 366 | 379 | 228 | 974 | ||
| Q 4 | 878 | 1,019 | 1,261 | 346 | 3,504 | 368 | 214 | 172 | 754 | ||
| Year | 3,606 | 4,299 | 5,952 | 1,957 | 15,814 | 1,366 | 1,064 | 754 | 3,184 | ||
| 2015 | Q 1 | 1,066 | 1,046 | 1,454 | 335 | 3,901 | 525 | 243 | 206 | 973 | |
| Q 2 | 991 | 1,021 | 1,663 | 372 | 4,047 | 527 | 321 | 216 | 1,065 | ||
| Q 3 | 1,128 | 1,492 | 1,942 | 447 | 5,009 | 494 | 568 | 293 | 1,354 | ||
| Q 4 | 1,084 | 1,565 | 1,413 | 408 | 4,470 | 601 | 687 | 180 | 1,468 | ||
| Year | 4,269 | 5,124 | 6,472 | 1,562 | 17,427 | 2,147 | 1,819 | 895 | 4,861 | ||
| 2016 | Q 1 | 1,169 | 1,695 | 1,680 | 370 | 4,914 | 502 | 522 | 256 | 1,280 | |
| Q 2 | 1,203 | 1,758 | 1,849 | 426 | 5,236 | 554 | 460 | 231 | 1,245 | ||
| Q 31 | 1,401 | 1,973 | 2,198 | 551 | 6,123 | 802 | 629 | 262 | 1,693 | ||
| Q 4 | 1,341 | 1,517 | 1,510 | 455 | 4,823 | 684 | 450 | 191 | 1,325 | ||
| Year | 5,114 | 6,943 | 7,237 | 1,802 | 21,096 | 2,542 | 2,061 | 940 | 5,543 | ||
| 2017 | Q 1 | 1,523 | 1,906 | 1,767 | 763 | 5,959 | 760 | 421 | 279 | 1,461 | |
| Q 2 | 1,484 | 2,090 | 1,904 | 801 | 6,279 | 698 | 531 | 227 | 1,455 | ||
| Q 3 | 1,670 | 2,046 | 2,166 | 1,002 | 6,884 | 761 | 447 | 302 | 1,510 | ||
| Q 4 | 1,591 | 1,899 | 1,600 | 871 | 5,961 | 962 | 418 | 213 | 1,593 | ||
| Year | 6,268 | 7,941 | 7,437 | 3,437 | 25,083 | 3,181 | 1,817 | 1,021 | 6,019 | ||
| 2018 | Q 11 | 1,711 | 1,769 | 1,658 | 872 | 6,010 | 1,146 | 571 | 220 | 1,938 | |
| Q 2 | 1,639 | 2,085 | 2,059 | 1,040 | 6,823 | 996 | 606 | 255 | 1,857 | ||
| Q 3 | 1,813 | 2,257 | 2,223 | 1,147 | 7,440 | 1,097 | 653 | 260 | 2,010 | ||
| Q 4 | 1,678 | 1,883 | 1,750 | 989 | 6,300 | 908 | 494 | 270 | 1,672 | ||
| Year | 6,841 | 7,994 | 7,690 | 4,048 | 26,573 | 4,147 | 2,324 | 1,006 | 7,477 | ||
| 2019 | Q 1 | 1,823 | 2,043 | 1,924 | 1,153 | 6,943 | 1,036 | 607 | 204 | 1,847 | |
| Q 21 | 1,772 | 2,076 | 1,969 | 1,224 | 7,041 | 1,219 | 652 | 232 | 2,103 | ||
| Q 31 | 1,918 | 2,385 | 2,125 | 1,293 | 7,721 | 1,198 | 808 | 266 | 2,272 | ||
| Q 41 | 1,596 | 1,930 | 1,611 | 1,049 | 6,186 | 1,362 | 511 | 222 | 2,095 | ||
| Year | 7,109 | 8,434 | 7,629 | 4,719 | 27,891 | 4,815 | 2,577 | 925 | 8,317 | ||
| 2020 | Q 11 | 1,735 | 2,055 | 1,736 | 1,123 | 6,649 | 1,476 | 808 | 219 | 2,503 | |
| Q 21 | 869 | 1,092 | 874 | 554 | 3,389 | 751 | 323 | 99 | 1,173 | ||
| Q 31 | 2,197 | 2,556 | 2,370 | 1,419 | 8,542 | 1,511 | 718 | 308 | 2,537 | ||
| Q 4 | 1,842 | 2,168 | 1,860 | 1,147 | 7,017 | 1,144 | 721 | 193 | 2,058 | ||
| Year | 6,643 | 7,871 | 6,840 | 4,243 | 25,597 | 4,882 | 2,570 | 819 | 8,271 | ||
| 2021 | Q 1 | 1,963 | 2,032 | 2,191 | 1,325 | 7,511 | 864 | 626 | 220 | 1,711 | |
| 1 Revised due to additional information. | |||||||||||
| 2 For categories where floor area is a relevant measure. | |||||||||||
| 3 Rounding issues may occur. | |||||||||||
Planning permission was granted for 3,874 new apartments in the first quarter of 2021.
The region with the highest proportion of these permissions at 79.3 % was Dublin with 3,073 approvals, followed by the Mid-East (8.4%) with 327 approvals. The Eastern and Midland Region (made up of Dublin, the Mid-East and the Midland regions) accounted for 3,451 permissions, 89.1% of all apartment units granted planning. The Southern Region (made up of the Mid-West, South East and South West regions) accounted for 7.3% of permissions compared to just 3.6% for the Northern and Western Region (Border and West). See Table 6 and Figure 4a.
There were 3,089 housing units granted planning permission in the current quarter. The county with highest proportion of these permissions was Cork at 13.6% with 421 approvals, followed by Meath (9.4%) with 289 approvals and Galway at 9.0%, with 278 planning permissions granted. Leitrim with 12 approvals accounted for the lowest proportion of permissions. See Table 8 and Figure 4b.
| X-axis label | Non-Strategic Housing Development units | Strategic Housing Development units |
|---|---|---|
| 2020 Q1 - Apartment units | 1750 | 7291 |
| 2020 Q1 - Multi-development house units | 1799 | 1937 |
| 2020 Q2 - Apartment units | 662 | 3546 |
| 2020 Q2 - Multi-development house units | 1377 | 1017 |
| 2020 Q3 - Apartment units | 1494 | 6377 |
| 2020 Q3 - Multi-development house units | 2125 | 1849 |
| 2020 Q4 - Apartment units | 2329 | 2775 |
| 2020 Q4 - Multi-development house units | 1812 | 1106 |
| 2021 Q1 - Apartment units | 1100 | 2774 |
| 2021 Q1 - Multi-development house units | 1282 | 146 |
Dwelling units granted by type of application - SHD and non-SHD applications
The Strategic Housing Development process is where applications for developments of at least 100 residential units or 200 plus student bed spaces can be made directly to An Bord Pleanála.
In the first quarter of 2021, the number of SHD apartment units approved declined by 62.0% when compared with the first quarter of 2020. Similarly, the number of SHD housing units approved declined by 92.5%. SHD apartment units accounted for 71.6% of all apartment units granted planning permission, with standard applications accounting for the remaining 28.4%. In the same period, 1,428 multi-development housing units were granted planning permission, 146 or 10.2% were Strategic Housing Development (SHD) applications compared to 1,282 or 89.8% standard applications. See Table 7 and Figure 5.
| Table 3 Summary of Planning Permissions granted, Q1 2021, classified by region, county and type of development | ||||||||||
| Number of Permissions | Total Floor Area (000 square metres)3 | |||||||||
| Planning Region and County | New Construction Dwellings | New Construction Other | Extensions | Alterations and Conversions | Total | New Construction Dwellings | New Construction Other | Extensions | Total1 | |
| Northern and Western | 551 | 431 | 383 | 169 | 1,534 | 161 | 103 | 53 | 316 | |
| Border | 277 | 252 | 202 | 91 | 822 | 71 | 65 | 32 | 168 | |
| Cavan | 43 | 41 | 37 | 17 | 138 | 11 | 18 | 8 | 38 | |
| Donegal | 154 | 115 | 108 | 42 | 419 | 38 | 14 | 12 | 64 | |
| Leitrim | 11 | 17 | 16 | 9 | 53 | 4 | 1 | 2 | 7 | |
| Monaghan | 54 | 55 | 27 | 14 | 150 | 13 | 26 | 3 | 42 | |
| Sligo | 15 | 24 | 14 | 9 | 62 | 4 | 6 | 7 | 17 | |
| West | 274 | 179 | 181 | 78 | 712 | 90 | 38 | 21 | 149 | |
| Galway City | 15 | 12 | 36 | 32 | 95 | 4 | 1 | 3 | 8 | |
| Galway2 | 139 | 89 | 72 | 24 | 324 | 56 | 19 | 5 | 81 | |
| Mayo | 79 | 41 | 57 | 10 | 187 | 19 | 13 | 10 | 42 | |
| Roscommon | 41 | 37 | 16 | 12 | 106 | 10 | 5 | 2 | 17 | |
| Southern | 774 | 799 | 739 | 413 | 2,725 | 253 | 130 | 85 | 468 | |
| Mid-West | 207 | 206 | 198 | 81 | 692 | 67 | 62 | 25 | 154 | |
| Clare | 62 | 41 | 49 | 22 | 174 | 22 | 10 | 4 | 36 | |
| Limerick | 83 | 78 | 79 | 24 | 264 | 27 | 33 | 14 | 74 | |
| Tipperary | 62 | 87 | 70 | 35 | 254 | 18 | 19 | 8 | 45 | |
| South-East | 259 | 183 | 206 | 110 | 758 | 82 | 27 | 19 | 129 | |
| Carlow | 30 | 29 | 28 | 13 | 100 | 7 | 1 | 5 | 14 | |
| Kilkenny | 50 | 67 | 40 | 25 | 182 | 19 | 14 | 3 | 36 | |
| Waterford | 40 | 41 | 69 | 38 | 188 | 9 | 5 | 7 | 21 | |
| Wexford | 139 | 46 | 69 | 34 | 288 | 47 | 7 | 5 | 58 | |
| South-West | 308 | 410 | 335 | 222 | 1,275 | 104 | 41 | 40 | 185 | |
| Cork City | 23 | 39 | 52 | 37 | 151 | 10 | 2 | 3 | 15 | |
| Cork2 | 208 | 252 | 202 | 136 | 798 | 75 | 28 | 26 | 128 | |
| Kerry | 77 | 119 | 81 | 49 | 326 | 19 | 11 | 12 | 42 | |
| Eastern and Midland | 638 | 802 | 1,069 | 743 | 3,252 | 450 | 394 | 82 | 926 | |
| Dublin | 156 | 421 | 704 | 537 | 1,818 | 254 | 173 | 42 | 468 | |
| Dublin City | 61 | 209 | 273 | 260 | 803 | 109 | 82 | 16 | 208 | |
| Dun Laoghaire- Rathdown | 38 | 78 | 139 | 85 | 340 | 82 | 9 | 9 | 100 | |
| Fingal | 38 | 87 | 168 | 120 | 413 | 52 | 65 | 10 | 127 | |
| South Dublin | 19 | 47 | 124 | 72 | 262 | 10 | 16 | 7 | 33 | |
| Mid-East | 339 | 232 | 265 | 144 | 980 | 144 | 192 | 27 | 363 | |
| Louth | 59 | 36 | 42 | 22 | 159 | 17 | 32 | 3 | 52 | |
| Kildare | 45 | 72 | 85 | 44 | 246 | 26 | 13 | 9 | 48 | |
| Meath | 162 | 80 | 70 | 36 | 348 | 56 | 12 | 10 | 77 | |
| Wicklow | 73 | 44 | 68 | 42 | 227 | 45 | 135 | 5 | 185 | |
| Midland | 143 | 149 | 100 | 62 | 454 | 53 | 28 | 14 | 95 | |
| Laois | 36 | 32 | 26 | 14 | 108 | 20 | 10 | 3 | 33 | |
| Longford | 20 | 30 | 23 | 16 | 89 | 5 | 4 | 6 | 16 | |
| Offaly | 45 | 41 | 23 | 16 | 125 | 12 | 6 | 2 | 20 | |
| Westmeath | 42 | 46 | 28 | 16 | 132 | 16 | 8 | 3 | 27 | |
| State | 1,963 | 2,032 | 2,191 | 1,325 | 7,511 | 864 | 626 | 220 | 1,711 | |
| 1 For categories where floor area is a relevant measure | ||||||||||
| 2 Excluding cities | ||||||||||
| 3 Rounding issues may occur | ||||||||||
| Table 4(a) Number of Planning Permissions granted, Q1 2021, classified by region, type of development and functional category | |||||||||
| Functional Category | |||||||||
| Type of Development and Planning Region | Dwellings | Commercial Buildings | Buildings for Agriculture | Industrial Buildings | Govt-, Health and Education | Other Buildings for Social Use | Civil Eng. | Other | Total |
| NEW CONSTRUCTIONS | |||||||||
| Northern and Western | 551 | 17 | 100 | 17 | 10 | 11 | 111 | 165 | 982 |
| Border | 277 | 6 | 61 | 13 | 3 | 6 | 77 | 86 | 529 |
| West | 274 | 11 | 39 | 4 | 7 | 5 | 34 | 79 | 453 |
| Southern | 774 | 30 | 128 | 27 | 7 | 8 | 251 | 348 | 1,573 |
| Mid-West | 207 | 11 | 50 | 7 | 3 | 1 | 60 | 74 | 413 |
| South-East | 259 | 5 | 32 | 3 | - | 3 | 55 | 85 | 442 |
| South West | 308 | 14 | 46 | 17 | 4 | 4 | 136 | 189 | 718 |
| Eastern and Midland | 638 | 52 | 58 | 28 | 13 | 13 | 160 | 478 | 1,440 |
| Dublin | 156 | 28 | 3 | 16 | 9 | 10 | 57 | 298 | 577 |
| Mid-East | 339 | 19 | 25 | 7 | 3 | 2 | 61 | 115 | 571 |
| Midland | 143 | 5 | 30 | 5 | 1 | 1 | 42 | 65 | 292 |
| State | 1,963 | 99 | 286 | 72 | 30 | 32 | 522 | 991 | 3,995 |
| EXTENSIONS | |||||||||
| Northern and Western | 319 | 17 | 9 | 13 | 19 | 6 | - | - | 383 |
| Border | 160 | 9 | 8 | 12 | 9 | 4 | - | - | 202 |
| West | 159 | 8 | 1 | 1 | 10 | 2 | - | - | 181 |
| Southern | 632 | 23 | 18 | 20 | 34 | 12 | - | - | 739 |
| Mid-West | 169 | 7 | 3 | 5 | 12 | 2 | - | - | 198 |
| South-East | 177 | 4 | 8 | 4 | 10 | 3 | - | - | 206 |
| South West | 286 | 12 | 7 | 11 | 12 | 7 | - | - | 335 |
| Eastern and Midland | 978 | 23 | 11 | 15 | 37 | 5 | - | - | 1,069 |
| Dublin | 660 | 12 | 3 | 7 | 21 | 1 | - | - | 704 |
| Mid-East | 237 | 6 | 4 | 6 | 11 | 1 | - | - | 265 |
| Midland | 81 | 5 | 4 | 2 | 5 | 3 | - | - | 100 |
| State | 1,929 | 63 | 38 | 48 | 90 | 23 | - | - | 2,191 |
| ALTERATIONS and CONVERSIONS | |||||||||
| Northern and Western | 108 | 30 | 2 | 5 | 12 | 12 | - | - | 169 |
| Border | 54 | 14 | 1 | 3 | 10 | 9 | - | - | 91 |
| West | 54 | 16 | 1 | 2 | 2 | 3 | - | - | 78 |
| Southern | 291 | 70 | 4 | 8 | 22 | 18 | - | - | 413 |
| Mid-West | 46 | 20 | - | 2 | 7 | 6 | - | - | 81 |
| South-East | 78 | 16 | - | 2 | 6 | 8 | - | - | 110 |
| South West | 167 | 34 | 4 | 4 | 9 | 4 | - | - | 222 |
| Eastern and Midland | 565 | 91 | 2 | 12 | 54 | 19 | - | - | 743 |
| Dublin | 425 | 59 | - | 6 | 37 | 10 | - | - | 537 |
| Mid-East | 101 | 21 | 2 | 6 | 9 | 5 | - | - | 144 |
| Midland | 39 | 11 | - | - | 8 | 4 | - | - | 62 |
| State | 964 | 191 | 8 | 25 | 88 | 49 | - | - | 1,325 |
| ALL DEVELOPMENTS | |||||||||
| Northern and Western | 978 | 64 | 111 | 35 | 41 | 29 | 111 | 165 | 1,534 |
| Border | 491 | 29 | 70 | 28 | 22 | 19 | 77 | 86 | 822 |
| West | 487 | 35 | 41 | 7 | 19 | 10 | 34 | 79 | 712 |
| Southern | 1,697 | 123 | 150 | 55 | 63 | 38 | 251 | 348 | 2,725 |
| Mid-West | 422 | 38 | 53 | 14 | 22 | 9 | 60 | 74 | 692 |
| South-East | 514 | 25 | 40 | 9 | 16 | 14 | 55 | 85 | 758 |
| South-West | 761 | 60 | 57 | 32 | 25 | 15 | 136 | 189 | 1,275 |
| Eastern and Midland | 2,181 | 166 | 71 | 55 | 104 | 37 | 160 | 478 | 3,252 |
| Dublin | 1,241 | 99 | 6 | 29 | 67 | 21 | 57 | 298 | 1,818 |
| Mid-East | 677 | 46 | 31 | 19 | 23 | 8 | 61 | 115 | 980 |
| Midland | 263 | 21 | 34 | 7 | 14 | 8 | 42 | 65 | 454 |
| State | 4,856 | 353 | 332 | 145 | 208 | 104 | 522 | 991 | 7,511 |
| - No permissions | |||||||||
| Table 4(b) Total Floor Area Planned (000 square metres)2 in new construction and extensions, Q1 2021, classified by region and functional category | |||||||
| Functional Category | |||||||
| Type of Development and Planning Region | Dwellings | Commercial Buildings | Buildings for Agriculture | Industrial Buildings | Govt., Health and Education | Other Buildings for Social Use | Total1 |
| NEW CONSTRUCTIONS | |||||||
| Northern and Western | 161 | 15 | 62 | 15 | 5 | 5 | 264 |
| Border | 71 | 3 | 43 | 15 | 1 | 3 | 135 |
| West | 90 | 12 | 19 | 0 | 4 | 2 | 128 |
| Southern | 253 | 33 | 72 | 12 | 13 | 1 | 383 |
| Mid-West | 67 | 18 | 29 | 4 | 12 | 0 | 129 |
| South-East | 82 | 8 | 15 | 3 | - | 0 | 110 |
| South West | 104 | 7 | 27 | 5 | 1 | 1 | 145 |
| Eastern and Midland | 450 | 206 | 55 | 81 | 39 | 13 | 844 |
| Dublin | 254 | 66 | 11 | 51 | 35 | 11 | 427 |
| Mid-East | 144 | 137 | 23 | 28 | 3 | 2 | 336 |
| Midland | 53 | 3 | 21 | 3 | 1 | 0 | 81 |
| State | 864 | 254 | 188 | 109 | 56 | 19 | 1,490 |
| EXTENSIONS | |||||||
| Northern and Western | 24 | 7 | 5 | 7 | 8 | 1 | 53 |
| Border | 11 | 1 | 5 | 7 | 7 | 1 | 32 |
| West | 13 | 6 | 0 | 0 | 1 | 0 | 21 |
| Southern | 40 | 8 | 11 | 9 | 16 | 2 | 85 |
| Mid-West | 10 | 2 | 1 | 2 | 11 | 0 | 25 |
| South-East | 11 | 2 | 2 | 1 | 2 | 0 | 19 |
| South West | 18 | 5 | 7 | 6 | 3 | 1 | 40 |
| Eastern and Midland | 53 | 3 | 3 | 5 | 17 | 1 | 82 |
| Dublin | 30 | 2 | 1 | 2 | 7 | 0 | 42 |
| Mid-East | 16 | 1 | 1 | 2 | 7 | 0 | 27 |
| Midland | 7 | 1 | 1 | 1 | 4 | 1 | 14 |
| State | 116 | 19 | 19 | 21 | 41 | 4 | 220 |
| TOTAL NEW CONSTRUCTIONS and EXTENSIONS | |||||||
| Northern and Western | 185 | 22 | 67 | 22 | 13 | 7 | 316 |
| Border | 82 | 4 | 48 | 22 | 8 | 4 | 168 |
| West | 103 | 19 | 19 | 1 | 5 | 2 | 149 |
| Southern | 293 | 41 | 82 | 21 | 28 | 3 | 468 |
| Mid-West | 77 | 19 | 30 | 6 | 23 | 0 | 154 |
| South-East | 94 | 10 | 18 | 5 | 2 | 1 | 129 |
| South West | 122 | 12 | 35 | 11 | 4 | 2 | 185 |
| Eastern and Midland | 503 | 209 | 58 | 86 | 56 | 14 | 926 |
| Dublin | 283 | 68 | 11 | 53 | 42 | 11 | 468 |
| Mid-East | 160 | 138 | 25 | 29 | 9 | 2 | 363 |
| Midland | 60 | 4 | 22 | 4 | 5 | 1 | 95 |
| State | 980 | 273 | 208 | 129 | 97 | 23 | 1,711 |
| 1 For categories where floor area is a relevant measure | |||||||
| 2 Rounding issues may occur | |||||||
| NOTE: 0 implies less than 500 sq.m | |||||||
| Table 5 Summary of planning permissions granted for new houses and apartments, Q1 2013 - Q1 2021 | ||||||||||||||||||||
| Multi-Development Houses | One-Off Houses | All Houses | Apartments | |||||||||||||||||
| Period | Number of Permissions | Number of Units | Floor Area (000 m2) | Average Floor Area per Unit (m2) | Number of Permissions | Number of Units | Floor Area (000 m2) | Average Floor Area per Unit (m2) | Number of Permissions | Number of Units | Floor Area (000 m2) | Average Floor Area per Unit (m2) | Number of Permissions | Number of Units | Floor Area (000 m2) | Average Floor Area per Unit (m2) | ||||
| 2013 | Q1 | 45 | 1,087 | 155 | 142.6 | 773 | 773 | 190 | 246.2 | 818 | 1,860 | 345 | 185.7 | 40 | 448 | 46 | 102.1 | |||
| Q2 | 43 | 812 | 109 | 134.5 | 684 | 684 | 171 | 249.6 | 727 | 1,496 | 280 | 187.1 | 40 | 430 | 50 | 116.9 | ||||
| Q3 | 45 | 433 | 63 | 146.6 | 819 | 819 | 203 | 247.5 | 864 | 1,252 | 266 | 212.6 | 64 | 157 | 12 | 76.6 | ||||
| Q4 | 54 | 754 | 109 | 144.1 | 640 | 640 | 161 | 252.0 | 694 | 1,394 | 270 | 193.6 | 53 | 162 | 15 | 93.6 | ||||
| Year | 187 | 3,086 | 436 | 141.4 | 2,916 | 2,916 | 725 | 248.6 | 3,103 | 6,002 | 1,161 | 193.5 | 197 | 1,197 | 123 | 103.0 | ||||
| 2014 | Q1 | 61 | 672 | 106 | 157.3 | 774 | 774 | 190 | 245.7 | 835 | 1,446 | 296 | 204.6 | 49 | 158 | 15 | 96.9 | |||
| Q2 | 57 | 740 | 99 | 133.2 | 752 | 752 | 185 | 245.9 | 809 | 1,492 | 283 | 190.0 | 63 | 114 | 10 | 84.9 | ||||
| Q3 | 66 | 962 | 134 | 138.9 | 821 | 821 | 197 | 239.6 | 887 | 1,783 | 330 | 185.2 | 65 | 361 | 31 | 86.9 | ||||
| Q4 | 55 | 1,156 | 166 | 143.2 | 749 | 749 | 186 | 248.3 | 804 | 1,905 | 352 | 184.5 | 69 | 152 | 13 | 85.3 | ||||
| Year | 239 | 3,530 | 503 | 142.6 | 3,096 | 3,096 | 758 | 244.8 | 3,335 | 6,626 | 1,261 | 190.3 | 246 | 785 | 69 | 88.3 | ||||
| 2015 | Q1 | 69 | 1,606 | 232 | 144.3 | 908 | 908 | 222 | 244.8 | 977 | 2,514 | 454 | 180.6 | 82 | 699 | 68 | 97.2 | |||
| Q2 | 92 | 1,816 | 277 | 152.5 | 821 | 821 | 198 | 241.0 | 913 | 2,637 | 475 | 180.0 | 73 | 473 | 47 | 99.7 | ||||
| Q3 | 86 | 1,395 | 189 | 135.2 | 950 | 950 | 230 | 242.4 | 1,036 | 2,345 | 419 | 178.6 | 85 | 359 | 32 | 89.2 | ||||
| Q4 | 82 | 1,841 | 259 | 140.5 | 913 | 913 | 222 | 243.5 | 995 | 2,754 | 481 | 174.7 | 86 | 1,263 | 119 | 94.2 | ||||
| Year | 329 | 6,658 | 956 | 143.6 | 3,592 | 3,592 | 873 | 243.0 | 3,921 | 10,250 | 1,829 | 178.4 | 326 | 2,794 | 266 | 95.2 | ||||
| 2016 | Q1 | 94 | 1,556 | 209 | 134.2 | 978 | 978 | 236 | 241.8 | 1,072 | 2,534 | 445 | 175.7 | 90 | 557 | 50 | 90.1 | |||
| Q2 | 100 | 1,350 | 188 | 139.0 | 990 | 990 | 234 | 236.6 | 1,090 | 2,340 | 422 | 180.3 | 107 | 801 | 71 | 88.0 | ||||
| Q31 | 143 | 3,070 | 411 | 133.9 | 1,129 | 1,129 | 269 | 238.3 | 1,272 | 4,199 | 680 | 161.9 | 125 | 1,190 | 106 | 89.1 | ||||
| Q4 | 101 | 2,112 | 281 | 133.3 | 1,133 | 1,133 | 278 | 245.4 | 1,234 | 3,245 | 559 | 172.4 | 102 | 1,084 | 104 | 96.4 | ||||
| Year | 438 | 8,088 | 1,089 | 134.6 | 4,230 | 4,230 | 1,018 | 240.6 | 4,668 | 12,318 | 2,106 | 171.0 | 424 | 3,632 | 331 | 91.1 | ||||
| 2017 | Q1 | 114 | 2,481 | 341 | 137.6 | 1,273 | 1,273 | 308 | 242.1 | 1,387 | 3,754 | 650 | 173.1 | 126 | 896 | 83 | 93.1 | |||
| Q2 | 121 | 2,382 | 310 | 130.0 | 1,248 | 1,248 | 302 | 241.8 | 1,369 | 3,630 | 611 | 168.4 | 107 | 823 | 70 | 84.8 | ||||
| Q3 | 134 | 2,382 | 302 | 126.8 | 1,382 | 1,382 | 329 | 237.8 | 1,516 | 3,764 | 631 | 167.6 | 146 | 975 | 90 | 91.9 | ||||
| Q4 | 132 | 2,970 | 404 | 135.9 | 1,322 | 1,322 | 315 | 238.3 | 1,454 | 4,292 | 719 | 167.4 | 131 | 2,642 | 215 | 81.5 | ||||
| Year | 501 | 10,215 | 1,357 | 132.8 | 5,225 | 5,225 | 1,254 | 239.9 | 5,726 | 15,440 | 2,610 | 169.1 | 510 | 5,336 | 458 | 85.9 | ||||
| 2018 | Q11 | 146 | 4,367 | 555 | 127.1 | 1,391 | 1,391 | 331 | 238.0 | 1,537 | 5,758 | 886 | 153.9 | 161 | 1,867 | 159 | 85.2 | |||
| Q2 | 149 | 3,636 | 482 | 132.6 | 1,315 | 1,315 | 312 | 237.1 | 1,464 | 4,951 | 794 | 160.4 | 161 | 1,826 | 166 | 91.0 | ||||
| Q3 | 177 | 3,463 | 442 | 127.6 | 1,416 | 1,416 | 335 | 236.9 | 1,593 | 4,879 | 777 | 159.3 | 211 | 3,139 | 278 | 88.7 | ||||
| Q4 | 150 | 3,017 | 385 | 127.7 | 1,359 | 1,359 | 323 | 237.4 | 1,509 | 4,376 | 708 | 161.8 | 160 | 2,306 | 190 | 82.2 | ||||
| Year | 622 | 14,483 | 1,864 | 128.7 | 5,481 | 5,481 | 1,301 | 237.3 | 6,103 | 19,964 | 3,165 | 158.5 | 693 | 9,138 | 793 | 86.8 | ||||
| 2019 | Q1 | 158 | 3,445 | 446 | 129.5 | 1,456 | 1,456 | 340 | 233.7 | 1,614 | 4,901 | 786 | 160.4 | 196 | 2,592 | 226 | 87.1 | |||
| Q21 | 169 | 3,549 | 461 | 129.8 | 1,387 | 1,387 | 320 | 230.7 | 1,556 | 4,936 | 781 | 158.2 | 202 | 4,630 | 386 | 83.5 | ||||
| Q31 | 168 | 3,401 | 434 | 127.8 | 1,514 | 1,514 | 355 | 234.5 | 1,682 | 4,915 | 790 | 160.6 | 226 | 5,174 | 398 | 76.9 | ||||
| Q41 | 150 | 3,634 | 450 | 123.7 | 1,265 | 1,265 | 296 | 234.2 | 1,415 | 4,899 | 746 | 152.2 | 170 | 7,195 | 565 | 78.5 | ||||
| Year | 645 | 14,029 | 1,791 | 127.7 | 5,622 | 5,622 | 1,312 | 233.3 | 6,267 | 19,651 | 3,102 | 157.9 | 794 | 19,591 | 1,575 | 80.4 | ||||
| 2020 | Q11 | 172 | 3,736 | 465 | 124.4 | 1,355 | 1,355 | 311 | 229.6 | 1,527 | 5,091 | 776 | 152.4 | 191 | 9,041 | 680 | 75.2 | |||
| Q21 | 92 | 2,394 | 284 | 118.5 | 669 | 669 | 157 | 234.3 | 761 | 3,063 | 440 | 143.8 | 102 | 4,208 | 300 | 71.2 | ||||
| Q31 | 162 | 3,974 | 475 | 119.5 | 1,754 | 1,754 | 414 | 235.8 | 1,916 | 5,728 | 889 | 155.1 | 268 | 7,871 | 584 | 74.2 | ||||
| Q4 | 129 | 2,918 | 333 | 114.0 | 1,514 | 1,514 | 363 | 239.5 | 1,643 | 4,432 | 695 | 156.9 | 187 | 5,104 | 403 | 78.9 | ||||
| Year | 555 | 13,022 | 1,556 | 119.5 | 5,292 | 5,292 | 1,244 | 235.1 | 5,847 | 18,314 | 2,800 | 152.9 | 748 | 26,224 | 1,966 | 75.0 | ||||
| 2021 | Q1 | 104 | 1,428 | 175 | 122.8 | 1,661 | 1,661 | 400 | 240.7 | 1,765 | 3,089 | 575 | 186.2 | 193 | 3,874 | 274 | 70.8 | |||
| 1 Revised due to additional information. | ||||||||||||||||||||
| Table 6 Planning permissions granted for apartment units in Q1 2020 - Q1 2021, classified by region | ||||||
| Q1 2020 | Q2 2020 | Q3 2020 | Q4 2020 | 2020 | Q1 2021 | |
| Region | units | units | units | units | units | units |
| Dublin1 | 7,367 | 3,377 | 5,102 | 3,516 | 19,362 | 3,073 |
| Mid-East | 1,031 | 231 | 1,812 | 442 | 3,516 | 327 |
| Midlands | 59 | 99 | 96 | 267 | 521 | 51 |
| Mid-West | 88 | 38 | 38 | 304 | 468 | 49 |
| South-East | 82 | 33 | 215 | 279 | 609 | 61 |
| South-West | 283 | 326 | 414 | 223 | 1,246 | 174 |
| Border | 20 | 23 | 79 | 39 | 161 | 5 |
| West | 111 | 81 | 115 | 34 | 341 | 134 |
| Total1 | 9,041 | 4,208 | 7,871 | 5,104 | 26,224 | 3,874 |
| 1 Q1 2020 - Q3 2020 revised due to additional information. | ||||||
| Table 7 Planning permissions granted for apartment, multi-development and total house units by type of application, Q1 2019 - Q1 2021 | ||||||||||
| Apartment units | Multi-development house units | Total house units2 | ||||||||
| Period | SHD | Non-SHD | Total | SHD | Non-SHD | Total | SHD | Non-SHD | Total | |
| 2019 | Q1 | 801 | 1,791 | 2,592 | 288 | 3,157 | 3,445 | 288 | 4,613 | 4,901 |
| Q21 | 2,376 | 2,254 | 4,630 | 1,160 | 2,389 | 3,549 | 1,160 | 3,776 | 4,936 | |
| Q31 | 3,212 | 1,962 | 5,174 | 659 | 2,742 | 3,401 | 659 | 4,256 | 4,915 | |
| Q41 | 5,883 | 1,312 | 7,195 | 1,839 | 1,795 | 3,634 | 1,839 | 3,060 | 4,899 | |
| Year | 12,272 | 7,319 | 19,591 | 3,946 | 10,083 | 14,029 | 3,946 | 15,705 | 19,651 | |
| 2020 | Q11 | 7,291 | 1,750 | 9,041 | 1,937 | 1,799 | 3,736 | 1,938 | 3,153 | 5,091 |
| Q21 | 3,546 | 662 | 4,208 | 1,017 | 1,377 | 2,394 | 1,017 | 2,046 | 3,063 | |
| Q31 | 6,377 | 1,494 | 7,871 | 1,849 | 2,125 | 3,974 | 1,849 | 3,879 | 5,728 | |
| Q4 | 2,775 | 2,329 | 5,104 | 1,106 | 1,812 | 2,918 | 1,106 | 3,326 | 4,432 | |
| Year | 19,989 | 6,235 | 26,224 | 5,909 | 7,113 | 13,022 | 5,910 | 12,404 | 18,314 | |
| 2021 | Q1 | 2,774 | 1,100 | 3,874 | 146 | 1,282 | 1,428 | 146 | 2,943 | 3,089 |
| 1 Revised due to additional information. | ||||||||||
| 2 Total house units is a combination of multi-development and one off houses. | ||||||||||
| Planning permissions granted for Strategic Housing Development (SHD) applications may be annulled by the high court. The CSO will revise figures in the fourth quarter publication of the relevant year, if this occurs. | ||||||||||
| Table 8 Number of units for which planning permissions granted by county, Q1 2021 | |||||
| County | All Houses | Apartments | Total Dwellings | ||
| Carlow | 35 | 7 | 42 | ||
| Cavan | 42 | 1 | 43 | ||
| Clare | 118 | 11 | 129 | ||
| Cork | 421 | 153 | 574 | ||
| Donegal | 158 | 3 | 161 | ||
| Dublin | 197 | 3,073 | 3,270 | ||
| Galway | 278 | 106 | 384 | ||
| Kerry | 75 | 21 | 96 | ||
| Kildare | 153 | 17 | 170 | ||
| Kilkenny | 115 | 4 | 119 | ||
| Laois | 96 | 40 | 136 | ||
| Leitrim | 12 | - | 12 | ||
| Limerick | 114 | 29 | 143 | ||
| Longford | 22 | - | 22 | ||
| Louth | 66 | 36 | 102 | ||
| Mayo | 75 | 16 | 91 | ||
| Meath | 289 | 60 | 349 | ||
| Monaghan | 53 | 1 | 54 | ||
| Offaly | 43 | 2 | 45 | ||
| Roscommon | 40 | 12 | 52 | ||
| Sligo | 15 | - | 15 | ||
| Tipperary | 96 | 9 | 105 | ||
| Waterford | 39 | 1 | 40 | ||
| Westmeath | 95 | 9 | 104 | ||
| Wexford | 238 | 49 | 287 | ||
| Wicklow | 204 | 214 | 418 | ||
| Total | 3,089 | 3,874 | 6,963 | ||
| - No permissions | |||||
Details of the scope and background of this series were given in the March 1973 Statistical Bulletin. The Planning and Development Acts 1963 - 2000, imposes certain requirements on builders, developers and all other persons who propose to build or develop and specifies that a planning permission must be obtained from the relevant Planning Authority.
Local authority building (including housing) is exempt in the case where construction takes place in the Authorities’ own area. Therefore, works undertaken by a local authority outside its functional area come within the scope of the Acts, and need planning permission. Planning permission is also needed for development by the State, except where the consultation procedures provided for in the Local Government (Planning and Development) Act, 1993 obtain (e.g. national security, public safety or order, the administration of justice etc). This series only provides coverage where development is subject to the requirement to obtain planning permission.
This series is also available using the interactive tables in PxStat on the CSO website.
Planning permissions are classified by type of development, local authority district and by regional authority. A distinction is made between residential and non-residential building and civil engineering.
1 New Development.
2 Extension.
3 Alteration & Renovation - No floor areas required (FA = 0).
4 Conversion / Change of Use - No floor areas required (FA = 0).
| Floor Area Edit Limits | |||
| Category (CAT) |
New Development | Extensions | |
| Range Floor Area (m2) |
Range Floor Area (m2) |
||
| 101 |
One-Off Houses |
65 - 372 | 1 - 150 |
| 102 |
Apartments & Granny Flat |
19 - 100 | 1 - 100 |
| 104 |
Communal Dwellings |
1 - 2,500 | 1 - 2,500 |
| 105 |
Multi Development Houses |
65 - 372 | 1 - 150 |
| 201 |
Agricultural & Fisheries |
1 - 2,000 | 1 - 1,000 |
| 202 |
Mining & Energy |
1 - 300 | 1 - 300 |
| 203 |
Industry & Manufacturing |
1 - 5,000 | 1 - 2,000 |
| 204 |
Hotels & Restaurants |
1 - 4,000 | 1 - 1,500 |
| 205 |
Transport Infrastructure |
1 - 2,000 | 1 - 750 |
| 206 |
Trade & Economic |
1 - 5,000 | 1 - 1,500 |
| 207 |
Public Administration |
1 - 4,000 | 1 - 1,000 |
| 208 |
Health & Welfare |
1 - 4,000 | 1 - 1,000 |
| 209 |
Entertainment & Recreation |
1 - 4,000 | 1 - 1,000 |
| 210 |
Education & Science |
1 - 4,000 | 1 - 1,000 |
| 211 |
Religious & Funerary |
1 - 2,000 | 1 - 500 |
| 212 |
Other Non-Residential |
1 - 250 | 1 - 250 |
| 213 |
Offices & Administration |
1 - 4,000 | 1 - 1,000 |
| 214 |
Crèches |
1 - 2,000 | 0 - 750 |
| Category (CAT) 301 - 401 | New Development (only) Floor Area (m2) Always 0 | |
|---|---|---|
| 301 |
Construction of Roads |
0 |
| 302 |
Constuction of Railways |
0 |
| 303 |
Civil Engineering Works – Specialised |
0 |
| 304 |
Hydraulic Engineering |
0 |
| 305 |
Water & Sewerage |
0 |
| 306 |
Land Reclamation & Drainage |
0 |
| 307 |
Electrical & Telecommunication Infrastructure |
0 |
| 308 |
Pipelines |
0 |
| 309 |
Civil Engineering Works – General |
0 |
| 401 |
General & Miscellaneous |
0 |
Only final grants of permission or approvals are covered, i.e. only works which involve construction. The following permissions are excluded since they do not entail construction per se:
As the figures for floor area have been rounded there may be slight discrepancies between the sum of the constituent items and the totals shown.
Estimates are included where complete details of floor area size are not available.
The regional classifications in this release are based on the NUTS (Nomenclature of Territorial Units for Statistics) classification used by Eurostat. The classification was drawn up by Eurostat in order to define territorial units for the production of regional statistics across the European Union. In 2003, the EU Member States, the European Parliament and the Commission established the NUTS regions within a legal framework (Regulation (EC) No 1059/2003).
Revisions were made to the NUTS boundaries in 2016 and were given legal status under Commission Regulation (EU) 2016/2066 amending annexes to NUTS Regulation 1059/2003. Under this revision the NUTS 2 Regions comprise the Regional Assemblies established under the Local Government Act 1991 (Regional Assemblies) (Establishment) Order 2014 (SI No. 573 of 2014). The NUTS 3 Regions are groupings of 31 administrative counties, and nest into the NUTS 2 Regions.
| Nuts 2 Region | Nuts 2 Region | Nuts 2 Region | |||
| Northern and Western | Southern | Eastern and Midland | |||
| Nuts 3 Region | Nuts 3 Region | Nuts 3 Region | |||
| Border | Cavan | Mid-West | Clare | Dublin | Dublin |
| Donegal | Limerick | Dun Laoghaire-Rathdown | |||
| Leitrim | Tipperary | Fingal | |||
| Monaghan | South Dublin | ||||
| Sligo | |||||
| West | Galway City | South-East | Carlow | Mid-East | Louth |
| Galway County | Kilkenny | Kildare | |||
| Mayo | Waterford | Meath | |||
| Roscommon | Wexford | Wicklow | |||
| South-West | Cork City | Midland | Laois | ||
| Cork County | Longford | ||||
| Kerry | Offaly | ||||
| Westmeath |
Planning applications for housing developments of more than 100 residential units and 200 plus student bed spaces can now be made directly to An Bord Pleanála. New legislation which allows for this type of application was enacted on 19th December 2016 and the associated regulations come in to effect on 3rd July 2017. This new type of application has been introduced as part of Rebuilding Ireland to speed up the planning application process and accelerate delivery of larger housing and student accommodation proposals. For more information see An Bord Pleanala website
There are differences (due to coverage, timing, definitions and other factors) between the planning permissions statistics produced by the CSO and those of the Department of Housing, Planning, Community and Local Government (DHPCLG), resulting in different but complementary sets of data aimed at meeting the needs of different users.
The planning permissions statistics produced by the DHPCLG focus on the overall process of the planning permissions system. For example, it provides data for each planning authority on invalid applications received, applications for outline and full permission, decisions to grant /refuse permission, decisions issued within the statutory eight week period, decisions deferred. Percentages for decisions are provided.
By contrast, the planning permissions statistics published by the CSO provide a detailed breakdown of certain outputs of the planning process (number of planning permissions granted with the number of units, functional description, and their floor areas). Only final grants of permission for works which involve construction are covered. Refusals, retentions and outline permissions, for example, are excluded. See under the heading Coverage above for a full list of exclusions.
The example of an application for a shopping centre with a car park illustrates how different approaches can result in a different total for the number of planning permissions granted. The CSO statistics include a breakdown into types of planning permission received and would therefore treat the case as an application for two permissions, one for a shopping centre and one for a car park. Where the statistics compiled do not involve such a breakdown, as is the case with the DHPCLG, the application would be treated as one for a single permission.
The purpose of the CSO Planning Permissions Statistics is to provide a short-term indicator on construction. It aims to provide data enabling some prediction of or insight into the amount of building activity about to take place in the State.
 Hide Background Notes
Scan the QR code below to view this release online or go to
http://www.cso.ie/en/releasesandpublications/er/pp/planningpermissionsquarter12021/
 Show Table 1 Summary of planning permissions granted for new dwelling units, Q1 2019 - Q1 2021
 Hide Table 1 Summary of planning permissions granted for new dwelling units, Q1 2019 - Q1 2021