
| Year ending | |||
| April 2015 | April 2016 | ||
| Immigration | 69,300 | 79,300 | |
| Emigration | 80,900 | 76,200 | |
| Net migration | -11,600 | 3,100 | |
| of which Irish nationals | -23,200 | -10,700 | |
| Natural increase | 37,400 | 35,300 | |
| Population change | 25,800 | 38,400 | |
| Population | 4,635,400 | 4,673,700 | |
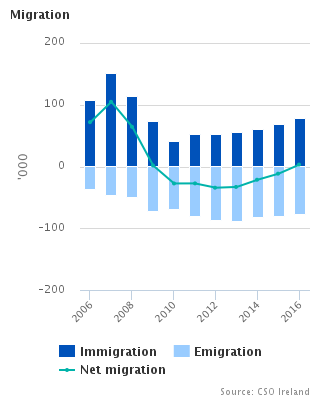
The number of immigrants to the State in the year to April 2016 is estimated to have increased by almost 15% from 69,300 to 79,300, while the number of emigrants declined over the same period, from 80,900 to 76,200. These combined changes have resulted in a return to net inward migration for Ireland (+3,100) for the first time since 2009.
Irish nationals continue to experience net outward migration, although at a much lower level than in the previous year, falling from 23,200 to 10,700, while net inward migration among non-Irish nationals grew for the fourth year in a row, from 11,600 to 13,800. See table 2.
The number of births in the period was 65,200 while the number of deaths was 30,000, resulting in a natural increase of the population of 35,300. See table 1.
The combined effect of natural increase and positive net migration resulted in an overall increase in the population of 38,400 bringing the population estimate to 4.67 million in April 2016. See table 1.
|
Preliminary results from the 2016 Census of Population showed a population of 4.76million persons using the de-facto definition of population, i.e. all persons present in the State on Census night. This differs by 84,000 from the population estimates contained in this release which have been compiled using the usual residence concept. It is planned to revise these current usual residence estimates for the years 2012 to 2016 (i.e. the period over which this differential arose) following a thorough analysis of the final detailed Census results when they become available in 2017. See background notes for more information. |
Other main features of the 2016 figures are:
| Table 1 Components of the annual population change, 1987 - 2016 | ||||||||
| Year ending April | Components of Population change | |||||||
| Births | Deaths | Natural increase | Immigrants | Emigrants | Net migration | Population change | Population | |
| '000 | ||||||||
| 1987 | 61.2 | 32.2 | 29.0 | 17.2 | 40.2 | -23.0 | 5.9 | 3,546.5 |
| 1988 | 57.8 | 31.6 | 26.2 | 19.2 | 61.1 | -41.9 | -15.8 | 3,530.7 |
| 1989 | 53.6 | 31.0 | 22.6 | 26.7 | 70.6 | -43.9 | -21.2 | 3,509.5 |
| 1990 | 51.9 | 32.8 | 19.1 | 33.3 | 56.3 | -22.9 | -3.7 | 3,505.8 |
| 1991 | 53.1 | 31.1 | 22.0 | 33.3 | 35.3 | -2.0 | 19.9 | 3,525.7 |
| 1992 | 52.8 | 31.4 | 21.4 | 40.7 | 33.4 | 7.4 | 28.8 | 3,554.5 |
| 1993 | 50.4 | 30.4 | 20.0 | 34.7 | 35.1 | -0.4 | 19.6 | 3,574.1 |
| 1994 | 49.1 | 32.6 | 16.6 | 30.1 | 34.8 | -4.7 | 11.8 | 3,585.9 |
| 1995 | 48.4 | 31.2 | 17.2 | 31.2 | 33.1 | -1.9 | 15.4 | 3,601.3 |
| 1996 | 48.8 | 32.0 | 16.7 | 39.2 | 31.2 | 8.0 | 24.8 | 3,626.1 |
| 1997 | 50.7 | 31.7 | 19.0 | 44.5 | 25.3 | 19.2 | 38.2 | 3,664.3 |
| 1998 | 52.7 | 31.2 | 21.5 | 46.0 | 28.6 | 17.4 | 38.8 | 3,703.1 |
| 1999 | 53.7 | 32.4 | 21.2 | 48.9 | 31.5 | 17.3 | 38.5 | 3,741.6 |
| 2000 | 54.0 | 32.1 | 21.8 | 52.6 | 26.6 | 26.0 | 47.9 | 3,789.5 |
| 2001 | 55.1 | 30.2 | 24.8 | 59.0 | 26.2 | 32.8 | 57.7 | 3,847.2 |
| 2002 | 58.1 | 29.3 | 28.8 | 66.9 | 25.6 | 41.3 | 70.0 | 3,917.2 |
| 2003 | 60.8 | 28.9 | 31.9 | 60.0 | 29.3 | 30.7 | 62.6 | 3,979.9 |
| 2004 | 62.0 | 28.6 | 33.3 | 58.5 | 26.5 | 32.0 | 65.3 | 4,045.2 |
| 2005 | 61.4 | 27.9 | 33.5 | 84.6 | 29.4 | 55.1 | 88.6 | 4,133.8 |
| 2006 1 | 61.2 | 27.0 | 34.2 | 107.8 | 36.0 | 71.8 | 106.0 | 4,232.9 |
| 2007 | 66.6 | 28.4 | 38.2 | 151.1 | 46.3 | 104.8 | 142.9 | 4,375.8 |
| 2008 | 73.0 | 28.0 | 44.9 | 113.5 | 49.2 | 64.3 | 109.2 | 4,485.1 |
| 2009 | 75.3 | 28.6 | 46.7 | 73.7 | 72.0 | 1.6 | 48.3 | 4,533.4 |
| 2010 | 77.2 | 28.4 | 48.8 | 41.8 | 69.2 | -27.5 | 21.4 | 4,554.8 |
| 2011 | 75.1 | 27.7 | 47.5 | 53.3 | 80.6 | -27.4 | 20.1 | 4,574.9 |
| 2012 2 | 74.0 | 29.2 | 44.9 | 52.7 | 87.1 | -34.4 | 10.5 | 4,585.4 |
| 2013 2 | 70.5 | 29.7 | 40.8 | 55.9 | 89.0 | -33.1 | 7.7 | 4,593.1 |
| 2014 2 | 67.7 | 29.8 | 37.9 | 60.6 | 81.9 | -21.4 | 16.5 | 4,609.6 |
| 2015 2 | 67.0 | 29.6 | 37.4 | 69.3 | 80.9 | -11.6 | 25.8 | 4,635.4 |
| 2016 2 | 65.2 | 30.0 | 35.3 | 79.3 | 76.2 | 3.1 | 38.4 | 4,673.7 |
| 1 Up to and including 2005, the annual population estimates are on a de facto basis. From 2006 onwards the concept of usual residence is used. | ||||||||
| 2 Preliminary. | ||||||||
| Table 2 Estimated Migration classified by Sex and Nationality, 2011 - 2016 | ||||||||||||||||||
| Year ending April / Nationality | Immigrants | Emigrants | Net Migration | |||||||||||||||
| 2011 1 | 2012 2 | 2013 2 | 2014 2 | 2015 2 | 2016 2 | 2011 1 | 2012 2 | 2013 2 | 2014 2 | 2015 2 | 2016 2 | 2011 1 | 2012 2 | 2013 2 | 2014 2 | 2015 2 | 2016 2 | |
| '000 | ||||||||||||||||||
| Persons | ||||||||||||||||||
| Irish | 19.6 | 20.6 | 15.7 | 11.6 | 12.1 | 21.1 | 42.0 | 46.5 | 50.9 | 40.7 | 35.3 | 31.8 | -22.4 | -26.0 | -35.2 | -29.2 | -23.2 | -10.7 |
| UK | 4.1 | 2.2 | 4.9 | 4.9 | 5.0 | 4.5 | 4.6 | 3.5 | 3.9 | 2.7 | 3.8 | 2.6 | -0.5 | -1.2 | 1.0 | 2.2 | 1.3 | 1.8 |
| Rest of EU153 | 7.1 | 7.2 | 7.4 | 8.7 | 8.9 | 10.0 | 10.2 | 11.2 | 9.9 | 14.0 | 15.6 | 10.3 | -3.1 | -4.0 | -2.5 | -5.3 | -6.7 | -0.4 |
| EU134 | 10.1 | 10.4 | 10.9 | 10.0 | 12.8 | 12.0 | 13.9 | 14.8 | 14.0 | 10.1 | 8.5 | 12.9 | -3.8 | -4.4 | -3.2 | -0.2 | 4.3 | -1.0 |
| Rest of world | 12.4 | 12.4 | 17.1 | 25.5 | 30.4 | 31.8 | 9.9 | 11.1 | 10.3 | 14.4 | 17.7 | 18.5 | 2.5 | 1.4 | 6.8 | 11.2 | 12.7 | 13.3 |
| Total persons | 53.3 | 52.7 | 55.9 | 60.6 | 69.3 | 79.3 | 80.6 | 87.1 | 89.0 | 81.9 | 80.9 | 76.2 | -27.4 | -34.4 | -33.1 | -21.4 | -11.6 | 3.1 |
| Males | ||||||||||||||||||
| Irish | 9.9 | 11.7 | 9.3 | 5.5 | 6.3 | 10.9 | 24.5 | 26.0 | 27.1 | 22.7 | 18.8 | 15.9 | -14.6 | -14.2 | -17.8 | -17.3 | -12.5 | -5.0 |
| UK | 2.2 | 1.1 | 2.4 | 2.0 | 2.2 | 1.9 | 1.8 | 2.0 | 2.0 | 1.6 | 2.5 | 1.3 | 0.4 | -0.9 | 0.4 | 0.4 | -0.3 | 0.6 |
| Rest of EU153 | 3.4 | 2.4 | 2.7 | 4.3 | 3.5 | 6.0 | 3.7 | 5.0 | 2.6 | 5.7 | 5.3 | 4.5 | -0.3 | -2.7 | 0.0 | -1.4 | -1.7 | 1.5 |
| EU134 | 4.6 | 4.9 | 5.3 | 4.8 | 6.5 | 5.7 | 6.8 | 8.4 | 7.0 | 6.1 | 6.4 | 7.2 | -2.2 | -3.5 | -1.7 | -1.3 | 0.1 | -1.5 |
| Rest of world | 5.9 | 4.9 | 8.5 | 11.6 | 14.2 | 14.1 | 5.1 | 7.5 | 6.2 | 5.9 | 9.3 | 6.9 | 0.8 | -2.6 | 2.3 | 5.7 | 4.9 | 7.2 |
| Total males | 26.0 | 25.0 | 28.2 | 28.2 | 32.7 | 38.7 | 41.9 | 48.9 | 44.9 | 42.0 | 42.2 | 35.9 | -15.8 | -23.9 | -16.7 | -13.8 | -9.5 | 2.8 |
| Females | ||||||||||||||||||
| Irish | 9.7 | 8.8 | 6.3 | 6.1 | 5.8 | 10.2 | 17.5 | 20.6 | 23.8 | 18.0 | 16.5 | 15.9 | -7.8 | -11.8 | -17.4 | -11.9 | -10.7 | -5.7 |
| UK | 1.9 | 1.1 | 2.5 | 2.9 | 2.8 | 2.5 | 2.8 | 1.5 | 1.9 | 1.1 | 1.3 | 1.3 | -0.9 | -0.4 | 0.6 | 1.8 | 1.5 | 1.2 |
| Rest of EU153 | 3.7 | 4.8 | 4.7 | 4.3 | 5.4 | 3.9 | 6.6 | 6.2 | 7.2 | 8.3 | 10.4 | 5.8 | -2.9 | -1.4 | -2.5 | -4.0 | -5.0 | -1.9 |
| EU134 | 5.5 | 5.5 | 5.6 | 5.2 | 6.3 | 6.2 | 7.1 | 6.4 | 7.0 | 4.0 | 2.2 | 5.7 | -1.6 | -0.9 | -1.5 | 1.1 | 4.2 | 0.5 |
| Rest of world | 6.5 | 7.6 | 8.6 | 13.9 | 16.2 | 17.7 | 4.8 | 3.6 | 4.1 | 8.5 | 8.4 | 11.6 | 1.7 | 4.0 | 4.5 | 5.4 | 7.8 | 6.1 |
| Total females | 27.2 | 27.8 | 27.7 | 32.4 | 36.6 | 40.6 | 38.8 | 38.2 | 44.0 | 39.9 | 38.7 | 40.3 | -11.5 | -10.5 | -16.4 | -7.6 | -2.1 | 0.3 |
| 1 Census of Population. | ||||||||||||||||||
| 2 Preliminary. | ||||||||||||||||||
| 3 Rest of EU 15: countries before enlargement on 1 May 2004, (i.e. Austria, Belgium, Denmark, Finland, France, Germany, Greece, Italy, Luxembourg, Netherlands, Spain, Sweden, Portugal). | ||||||||||||||||||
| 4 EU13: defined as 10 countries that joined the EU on 1 May 2004 (i.e. Cyprus, Czech Republic, Estonia, Hungary, Latvia, Lithuania, Malta, Poland, Slovakia, Slovenia), along with Bulgaria and Romania who joined on 1 January 2007 and Croatia who joined on the 1 July 2013. | ||||||||||||||||||
| Table 3 Estimated Migration classified by Sex and Country of Origin/Destination, 2011 - 2016 | ||||||||||||||||||
| Year ending April / Origin/Destination | Immigrants | Emigrants | Net Migration | |||||||||||||||
| 2011 1 | 2012 2 | 2013 2 | 2014 2 | 2015 2 | 2016 2 | 2011 1 | 2012 2 | 2013 2 | 2014 2 | 2015 2 | 2016 2 | 2011 1 | 2012 2 | 2013 2 | 2014 2 | 2015 2 | 2016 2 | |
| '000 | ||||||||||||||||||
| Persons | ||||||||||||||||||
| UK | 11.9 | 8.4 | 9.7 | 9.7 | 10.4 | 13.8 | 20.0 | 19.0 | 21.9 | 17.9 | 19.2 | 16.6 | -8.1 | -10.5 | -12.2 | -8.2 | -8.7 | -2.8 |
| Rest of EU 153 | 9.7 | 10.2 | 10.3 | 11.2 | 10.8 | 12.3 | 13.9 | 14.4 | 11.5 | 16.2 | 15.3 | 16.0 | -4.2 | -4.2 | -1.2 | -5.0 | -4.5 | -3.7 |
| EU 134 | 9.8 | 9.3 | 11.8 | 9.8 | 13.4 | 10.7 | 10.4 | 9.6 | 14.2 | 8.7 | 6.8 | 10.7 | -0.5 | -0.3 | -2.4 | 1.1 | 6.5 | 0.0 |
| Australia | 4.5 | 4.9 | 5.3 | 3.6 | 2.9 | 5.5 | 13.4 | 18.2 | 15.4 | 10.0 | 7.5 | 6.2 | -9.0 | -13.3 | -10.1 | -6.4 | -4.7 | -0.7 |
| Canada | 1.3 | 1.6 | 1.1 | 1.2 | 1.6 | 2.5 | 2.1 | 3.0 | 5.3 | 4.7 | 7.7 | 3.9 | -0.9 | -1.4 | -4.2 | -3.5 | -6.1 | -1.4 |
| USA | 3.3 | 4.9 | 3.6 | 2.6 | 2.2 | 4.7 | 4.7 | 8.6 | 6.2 | 6.9 | 5.9 | 6.6 | -1.4 | -3.6 | -2.6 | -4.2 | -3.7 | -1.9 |
| Rest of world | 12.9 | 13.4 | 14.1 | 22.4 | 28.0 | 29.7 | 16.2 | 14.4 | 14.4 | 17.5 | 18.4 | 16.4 | -3.3 | -1.0 | -0.4 | 5.0 | 9.5 | 13.3 |
| Total persons | 53.3 | 52.7 | 55.9 | 60.6 | 69.3 | 79.3 | 80.6 | 87.1 | 89.0 | 81.9 | 80.9 | 76.2 | -27.4 | -34.4 | -33.1 | -21.4 | -11.6 | 3.1 |
| Males | ||||||||||||||||||
| UK | 5.9 | 4.5 | 6.1 | 3.9 | 5.4 | 7.6 | 11.1 | 10.8 | 11.5 | 9.3 | 9.0 | 8.8 | -5.2 | -6.3 | -5.4 | -5.4 | -3.5 | -1.2 |
| Rest of EU 153 | 4.7 | 3.7 | 5.1 | 5.3 | 4.5 | 7.2 | 7.0 | 7.1 | 4.4 | 7.2 | 5.5 | 6.6 | -2.4 | -3.3 | 0.7 | -2.0 | -1.0 | 0.6 |
| EU 134 | 4.5 | 4.8 | 5.1 | 4.7 | 6.2 | 5.2 | 4.9 | 5.0 | 7.5 | 5.3 | 4.4 | 5.0 | -0.4 | -0.2 | -2.5 | -0.5 | 1.8 | 0.2 |
| Australia | 2.2 | 2.8 | 3.4 | 1.6 | 1.5 | 3.0 | 7.4 | 10.9 | 7.7 | 4.8 | 3.8 | 2.9 | -5.1 | -8.1 | -4.3 | -3.2 | -2.3 | 0.1 |
| Canada | 0.7 | 0.9 | 0.4 | 0.6 | 0.4 | 1.5 | 1.1 | 1.9 | 2.6 | 3.3 | 5.6 | 2.0 | -0.5 | -1.0 | -2.2 | -2.6 | -5.1 | -0.5 |
| USA | 1.5 | 2.5 | 1.3 | 0.8 | 0.9 | 2.0 | 2.6 | 4.7 | 3.3 | 3.3 | 2.7 | 3.3 | -1.1 | -2.2 | -2.0 | -2.5 | -1.8 | -1.3 |
| Rest of world | 6.5 | 5.8 | 6.8 | 11.3 | 13.8 | 12.2 | 7.7 | 8.6 | 7.9 | 8.9 | 11.2 | 7.4 | -1.3 | -2.8 | -1.1 | 2.4 | 2.6 | 4.8 |
| Total males | 26.0 | 25.0 | 28.2 | 28.2 | 32.7 | 38.7 | 41.9 | 48.9 | 44.9 | 42.0 | 42.2 | 35.9 | -15.8 | -23.9 | -16.7 | -13.8 | -9.5 | 2.8 |
| Females | ||||||||||||||||||
| UK | 6.0 | 4.0 | 3.5 | 5.9 | 5.0 | 6.2 | 8.9 | 8.2 | 10.4 | 8.7 | 10.2 | 7.8 | -3.0 | -4.2 | -6.8 | -2.8 | -5.2 | -1.6 |
| Rest of EU 153 | 5.0 | 6.5 | 5.3 | 5.9 | 6.4 | 5.2 | 6.8 | 7.3 | 7.1 | 9.0 | 9.8 | 9.4 | -1.8 | -0.8 | -1.9 | -3.1 | -3.4 | -4.2 |
| EU 134 | 5.3 | 4.5 | 6.7 | 5.1 | 7.2 | 5.5 | 5.4 | 4.6 | 6.7 | 3.4 | 2.5 | 5.7 | -0.2 | -0.1 | 0.1 | 1.6 | 4.7 | -0.2 |
| Australia | 2.2 | 2.1 | 1.9 | 2.0 | 1.4 | 2.6 | 6.0 | 7.4 | 7.7 | 5.2 | 3.7 | 3.2 | -3.8 | -5.2 | -5.8 | -3.3 | -2.3 | -0.6 |
| Canada | 0.6 | 0.7 | 0.7 | 0.6 | 1.1 | 1.0 | 1.0 | 1.1 | 2.8 | 1.4 | 2.1 | 2.0 | -0.4 | -0.4 | -2.0 | -0.9 | -1.0 | -1.0 |
| USA | 1.7 | 2.4 | 2.3 | 1.9 | 1.3 | 2.7 | 2.1 | 3.9 | 2.9 | 3.6 | 3.2 | 3.3 | -0.3 | -1.5 | -0.6 | -1.7 | -1.9 | -0.6 |
| Rest of world | 6.5 | 7.6 | 7.2 | 11.2 | 14.2 | 17.5 | 8.5 | 5.8 | 6.5 | 8.6 | 7.2 | 9.0 | -2.0 | 1.8 | 0.7 | 2.6 | 7.0 | 8.5 |
| Total females | 27.2 | 27.8 | 27.7 | 32.4 | 36.6 | 40.6 | 38.8 | 38.2 | 44.0 | 39.9 | 38.7 | 40.3 | -11.5 | -10.5 | -16.4 | -7.6 | -2.1 | 0.3 |
| 1 Census of Population. | ||||||||||||||||||
| 2 Preliminary. | ||||||||||||||||||
| 3 Rest of EU 15: countries before enlargement on 1 May 2004, (i.e. Austria, Belgium, Denmark, Finland, France, Germany, Greece, Italy, Luxembourg, Netherlands, Spain, Sweden, Portugal). | ||||||||||||||||||
| 4 EU13: defined as 10 countries that joined the EU on 1 May 2004 (i.e. Cyprus, Czech Republic, Estonia, Hungary, Latvia, Lithuania, Malta, Poland, Slovakia, Slovenia), along with Bulgaria and Romania who joined on 1 January 2007 and Croatia who joined on the 1 July 2013. | ||||||||||||||||||
| Table 4 Estimated Migration classified by Sex and Age Group, 2011 - 2016 | ||||||||||||||||||
| Year ending April / Age | Immigrants | Emigrants | Net Migration | |||||||||||||||
| 2011 1 | 2012 2 | 2013 2 | 2014 2 | 2015 2 | 2016 2 | 2011 1 | 2012 2 | 2013 2 | 2014 2 | 2015 2 | 2016 2 | 2011 1 | 2012 2 | 2013 2 | 2014 2 | 2015 2 | 2016 2 | |
| '000 | ||||||||||||||||||
| Persons | ||||||||||||||||||
| 0 - 14 | 6.1 | 7.9 | 9.3 | 7.8 | 12.8 | 12.4 | 5.3 | 4.9 | 6.8 | 6.0 | 5.4 | 6.3 | 0.9 | 2.9 | 2.5 | 1.8 | 7.4 | 6.2 |
| 15 - 24 | 14.6 | 14.6 | 12.9 | 15.9 | 14.7 | 19.7 | 34.5 | 35.8 | 34.8 | 33.5 | 30.4 | 31.7 | -19.9 | -21.3 | -21.8 | -17.6 | -15.7 | -12.0 |
| 25 - 44 | 26.9 | 25.6 | 28.6 | 33.0 | 36.7 | 41.4 | 31.3 | 39.5 | 41.0 | 37.6 | 39.7 | 33.3 | -4.4 | -13.9 | -12.5 | -4.6 | -3.0 | 8.2 |
| 45 - 64 | 4.3 | 4.1 | 4.6 | 2.8 | 4.0 | 4.3 | 6.1 | 5.6 | 5.7 | 3.4 | 4.5 | 3.9 | -1.8 | -1.5 | -1.0 | -0.6 | -0.5 | 0.4 |
| 65 and over | 1.3 | 0.6 | 0.4 | 1.1 | 1.1 | 1.4 | 3.4 | 1.2 | 0.7 | 1.5 | 0.8 | 1.1 | -2.1 | -0.6 | -0.3 | -0.4 | 0.2 | 0.3 |
| Total persons | 53.3 | 52.7 | 55.9 | 60.6 | 69.3 | 79.3 | 80.6 | 87.1 | 89.0 | 81.9 | 80.9 | 76.2 | -27.4 | -34.4 | -33.1 | -21.4 | -11.6 | 3.1 |
| Males | ||||||||||||||||||
| 0 - 14 | 3.1 | 3.2 | 3.9 | 3.0 | 6.5 | 5.3 | 2.5 | 2.3 | 3.9 | 2.2 | 2.9 | 3.0 | 0.6 | 0.9 | 0.0 | 0.8 | 3.6 | 2.3 |
| 15 - 24 | 6.4 | 6.0 | 6.3 | 6.8 | 4.9 | 8.7 | 15.9 | 17.4 | 15.1 | 15.8 | 13.2 | 14.5 | -9.5 | -11.4 | -8.8 | -9.0 | -8.3 | -5.8 |
| 25 - 44 | 13.6 | 13.3 | 15.4 | 16.9 | 18.8 | 21.7 | 17.9 | 24.7 | 22.5 | 22.3 | 22.1 | 16.0 | -4.4 | -11.4 | -7.1 | -5.4 | -3.3 | 5.7 |
| 45 - 64 | 2.2 | 1.9 | 2.4 | 1.1 | 2.0 | 2.2 | 3.1 | 3.8 | 3.1 | 1.4 | 3.5 | 1.9 | -0.9 | -1.9 | -0.7 | -0.2 | -1.4 | 0.3 |
| 65 and over | 0.7 | 0.5 | 0.1 | 0.4 | 0.4 | 0.7 | 2.4 | 0.6 | 0.4 | 0.4 | 0.6 | 0.6 | -1.8 | -0.1 | -0.2 | -0.1 | -0.2 | 0.2 |
| Total males | 26.0 | 25.0 | 28.2 | 28.2 | 32.7 | 38.7 | 41.9 | 48.9 | 44.9 | 42.0 | 42.2 | 35.9 | -15.8 | -23.9 | -16.7 | -13.8 | -9.5 | 2.8 |
| Females | ||||||||||||||||||
| 0 - 14 | 3.0 | 4.6 | 5.4 | 4.8 | 6.3 | 7.1 | 2.7 | 2.6 | 2.9 | 3.8 | 2.6 | 3.3 | 0.2 | 2.0 | 2.4 | 0.9 | 3.7 | 3.8 |
| 15 - 24 | 8.2 | 8.6 | 6.6 | 9.1 | 9.8 | 11.0 | 18.6 | 18.4 | 19.6 | 17.7 | 17.3 | 17.2 | -10.5 | -9.9 | -13.0 | -8.6 | -7.5 | -6.2 |
| 25 - 44 | 13.3 | 12.3 | 13.2 | 16.1 | 17.9 | 19.7 | 13.3 | 14.8 | 18.5 | 15.3 | 17.6 | 17.3 | 0.0 | -2.5 | -5.4 | 0.8 | 0.3 | 2.4 |
| 45 - 64 | 2.1 | 2.2 | 2.2 | 1.7 | 1.9 | 2.2 | 3.1 | 1.8 | 2.6 | 2.0 | 1.0 | 2.1 | -1.0 | 0.5 | -0.3 | -0.4 | 0.9 | 0.1 |
| 65 and over | 0.7 | 0.1 | 0.3 | 0.7 | 0.6 | 0.7 | 1.0 | 0.6 | 0.4 | 1.1 | 0.2 | 0.5 | -0.3 | -0.5 | -0.1 | -0.3 | 0.4 | 0.1 |
| Total females | 27.2 | 27.8 | 27.7 | 32.4 | 36.6 | 40.6 | 38.8 | 38.2 | 44.0 | 39.9 | 38.7 | 40.3 | -11.5 | -10.5 | -16.4 | -7.6 | -2.1 | 0.3 |
| 1 Census of Population. | ||||||||||||||||||
| 2 Preliminary. | ||||||||||||||||||
| Table 5 Estimated Migration (aged 15 and over) classified by Sex and Education Attainment, 2011 - 2016 | ||||||||||||||||||
| Year ending April / Education Attainment | Immigrants | Emigrants | Net Migration | |||||||||||||||
| 20111 | 20122 | 20132 | 20142 | 20152 | 20162 | 20111 | 20122 | 20132 | 20142 | 20152 | 20162 | 20111 | 20122 | 20132 | 20142 | 20152 | 20162 | |
| '000 | ||||||||||||||||||
| Persons | ||||||||||||||||||
| Higher secondary and below | 17.3 | 14.2 | 14.6 | 13.4 | 15.1 | 18.6 | 30.1 | 31.5 | 37.7 | 27.6 | 25.9 | 25.1 | -12.8 | -17.3 | -23.1 | -14.3 | -10.8 | -6.5 |
| Post leaving cert3 | 5.3 | 3.2 | 2.1 | 3.5 | 2.3 | 4.1 | 6.2 | 6.8 | 6.7 | 6.3 | 4.3 | 4.5 | -0.9 | -3.6 | -4.6 | -2.8 | -2.0 | -0.4 |
| Third level4 | 22.4 | 25.0 | 27.1 | 30.9 | 31.7 | 38.2 | 35.8 | 39.0 | 35.0 | 35.3 | 39.8 | 32.0 | -13.4 | -14.1 | -7.9 | -4.4 | -8.1 | 6.2 |
| Not stated | 2.1 | 2.4 | 2.9 | 5.1 | 7.3 | 6.1 | 3.3 | 4.8 | 2.9 | 6.7 | 5.4 | 8.5 | -1.2 | -2.4 | 0.0 | -1.6 | 1.9 | -2.4 |
| Total persons | 47.1 | 44.9 | 46.6 | 52.8 | 56.5 | 66.9 | 75.4 | 82.2 | 82.2 | 75.9 | 75.4 | 70.0 | -28.2 | -37.3 | -35.6 | -23.1 | -19.0 | -3.1 |
| Males | ||||||||||||||||||
| Higher secondary and below | 8.9 | 8.5 | 7.9 | 6.8 | 7.7 | 10.6 | 15.7 | 17.6 | 18.3 | 15.8 | 14.1 | 13.4 | -6.8 | -9.1 | -10.4 | -9.0 | -6.4 | -2.8 |
| Post leaving cert3 | 2.9 | 2.0 | 1.0 | 1.9 | 0.8 | 2.3 | 4.0 | 5.7 | 4.2 | 3.6 | 3.2 | 2.4 | -1.1 | -3.7 | -3.2 | -1.7 | -2.4 | -0.1 |
| Third level4 | 10.0 | 10.3 | 14.5 | 14.3 | 14.4 | 17.4 | 17.4 | 20.6 | 16.7 | 17.4 | 18.9 | 14.0 | -7.4 | -10.3 | -2.2 | -3.1 | -4.6 | 3.4 |
| Not stated | 1.1 | 0.9 | 0.8 | 2.2 | 3.3 | 3.1 | 2.2 | 2.6 | 1.9 | 3.1 | 3.0 | 3.1 | -1.1 | -1.7 | -1.1 | -0.9 | 0.3 | -0.1 |
| Total males | 22.9 | 21.7 | 24.3 | 25.2 | 26.2 | 33.4 | 39.3 | 46.5 | 41.1 | 39.8 | 39.3 | 33.0 | -16.5 | -24.8 | -16.8 | -14.6 | -13.1 | 0.4 |
| Females | ||||||||||||||||||
| Higher secondary and below | 8.4 | 5.8 | 6.6 | 6.5 | 7.4 | 8.0 | 14.4 | 13.9 | 19.3 | 11.8 | 11.8 | 11.6 | -6.0 | -8.1 | -12.7 | -5.3 | -4.4 | -3.7 |
| Post leaving cert3 | 2.4 | 1.2 | 1.0 | 1.6 | 1.5 | 1.8 | 2.2 | 1.1 | 2.4 | 2.7 | 1.1 | 2.1 | 0.2 | 0.1 | -1.4 | -1.2 | 0.4 | -0.3 |
| Third level4 | 12.4 | 14.6 | 12.6 | 16.6 | 17.4 | 20.7 | 18.4 | 18.4 | 18.3 | 18.0 | 20.9 | 17.9 | -6.0 | -3.8 | -5.8 | -1.3 | -3.5 | 2.8 |
| Not stated | 1.1 | 1.5 | 2.1 | 2.9 | 4.0 | 3.0 | 1.1 | 2.2 | 1.0 | 3.6 | 2.4 | 5.4 | -0.1 | -0.7 | 1.1 | -0.7 | 1.6 | -2.3 |
| Total females | 24.3 | 23.2 | 22.3 | 27.6 | 30.3 | 33.5 | 36.0 | 35.6 | 41.1 | 36.1 | 36.2 | 37.0 | -11.8 | -12.5 | -18.8 | -8.5 | -5.9 | -3.5 |
| 1 Census of Population. | ||||||||||||||||||
| 2 Preliminary. | ||||||||||||||||||
| 3 Technical or Vocational, Advanced Certificate or Diploma. | ||||||||||||||||||
| 4 Third level degree or above. | ||||||||||||||||||
| Table 6 Estimated Migration (aged 15 and over) classified by Sex and Principal Economic Status1, 2011 - 2016 | ||||||||||||||||||
| Year ending April / Principal Economic Status | Immigrants | Emigrants | Net Migration | |||||||||||||||
| 2011 1 | 2012 2 | 2013 2 | 2014 2 | 2015 2 | 2016 2 | 2011 1 | 2012 2 | 2013 2 | 2014 2 | 2015 2 | 2016 2 | 2011 1 | 2012 2 | 2013 2 | 2014 2 | 2015 2 | 2016 2 | |
| '000 | ||||||||||||||||||
| Persons | ||||||||||||||||||
| At work | 23.2 | 21.2 | 22.2 | 22.6 | 27.4 | 33.3 | 36.2 | 38.5 | 36.5 | 28.9 | 36.3 | 29.4 | -13.0 | -17.3 | -14.3 | -6.3 | -8.9 | 3.9 |
| Unemployed | 9.7 | 9.3 | 7.5 | 6.8 | 5.8 | 6.2 | 15.2 | 18.6 | 17.2 | 12.3 | 10.3 | 7.3 | -5.5 | -9.3 | -9.8 | -5.5 | -4.5 | -1.0 |
| Student | 9.0 | 7.3 | 11.0 | 16.2 | 14.8 | 18.8 | 17.6 | 19.5 | 20.2 | 29.0 | 22.5 | 24.9 | -8.6 | -12.3 | -9.2 | -12.8 | -7.7 | -6.1 |
| Other | 5.2 | 7.1 | 6.0 | 7.3 | 8.5 | 8.6 | 6.5 | 5.5 | 8.3 | 5.7 | 6.3 | 8.4 | -1.2 | 1.5 | -2.3 | 1.6 | 2.1 | 0.1 |
| Total persons | 47.1 | 44.9 | 46.6 | 52.8 | 56.5 | 66.9 | 75.4 | 82.2 | 82.2 | 75.9 | 75.4 | 70.0 | -28.2 | -37.3 | -35.6 | -23.1 | -19.0 | -3.1 |
| Males | ||||||||||||||||||
| At work | 11.9 | 11.1 | 12.8 | 12.2 | 13.7 | 18.9 | 18.3 | 21.1 | 18.4 | 14.5 | 21.0 | 15.4 | -6.4 | -10.0 | -5.7 | -2.3 | -7.3 | 3.5 |
| Unemployed | 5.2 | 5.4 | 4.8 | 3.0 | 3.6 | 4.0 | 10.9 | 13.5 | 12.0 | 8.0 | 6.6 | 4.1 | -5.7 | -8.0 | -7.2 | -5.0 | -3.0 | -0.2 |
| Student | 4.2 | 3.2 | 6.0 | 8.5 | 7.2 | 8.9 | 8.4 | 10.1 | 8.5 | 14.9 | 10.3 | 11.9 | -4.2 | -6.9 | -2.5 | -6.4 | -3.1 | -2.9 |
| Other | 1.6 | 2.0 | 0.7 | 1.5 | 1.6 | 1.7 | 1.7 | 1.9 | 2.2 | 2.5 | 1.3 | 1.6 | -0.2 | 0.1 | -1.5 | -0.9 | 0.3 | 0.1 |
| Total males | 22.9 | 21.7 | 24.3 | 25.2 | 26.2 | 33.4 | 39.3 | 46.5 | 41.1 | 39.8 | 39.3 | 33.0 | -16.5 | -24.8 | -16.8 | -14.6 | -13.1 | 0.4 |
| Females | ||||||||||||||||||
| At work | 11.3 | 10.1 | 9.4 | 10.3 | 13.6 | 14.4 | 17.9 | 17.4 | 18.1 | 14.4 | 15.2 | 14.0 | -6.6 | -7.2 | -8.7 | -4.1 | -1.6 | 0.4 |
| Unemployed | 4.5 | 3.9 | 2.7 | 3.8 | 2.2 | 2.3 | 4.3 | 5.2 | 5.3 | 4.3 | 3.7 | 3.1 | 0.2 | -1.3 | -2.6 | -0.5 | -1.5 | -0.9 |
| Student | 4.8 | 4.1 | 4.9 | 7.7 | 7.6 | 9.9 | 9.1 | 9.5 | 11.6 | 14.1 | 12.2 | 13.0 | -4.4 | -5.4 | -6.7 | -6.4 | -4.6 | -3.1 |
| Other | 3.7 | 5.1 | 5.3 | 5.7 | 6.8 | 6.9 | 4.7 | 3.6 | 6.1 | 3.2 | 5.0 | 6.8 | -1.1 | 1.4 | -0.8 | 2.5 | 1.8 | 0.1 |
| Total females | 24.3 | 23.2 | 22.3 | 27.6 | 30.3 | 33.5 | 36.0 | 35.6 | 41.1 | 36.1 | 36.2 | 37.0 | -11.8 | -12.5 | -18.8 | -8.5 | -5.9 | -3.5 |
| 1 As a person's principal economic status can change over the course of the year, for immigrants this refers to their current status, while for emigrants it is their status in the period prior to departure. | ||||||||||||||||||
| 2 Census of Population. | ||||||||||||||||||
| 3 Preliminary. | ||||||||||||||||||
| Table 7 Estimated Population classified by Sex and Age Group, 2011 - 2016 | ||||||
| Sex and Age Group | Persons in April of each year | |||||
| 2011 1 | 2012 2 | 2013 2 | 2014 2 | 2015 2 | 2016 2 | |
| '000 | ||||||
| Persons | ||||||
| 0 - 4 years | 356.0 | 364.6 | 365.7 | 362.6 | 360.9 | 355.6 |
| 5 - 9 " | 319.6 | 324.8 | 333.1 | 341.9 | 352.4 | 363.2 |
| 10 - 14 " | 301.0 | 305.4 | 308.9 | 311.4 | 316.1 | 320.5 |
| 15 - 19 " | 281.0 | 275.7 | 274.5 | 279.1 | 283.2 | 288.1 |
| 20 - 24 " | 298.6 | 277.7 | 258.8 | 244.3 | 233.5 | 226.8 |
| 25 - 29 " | 362.9 | 341.2 | 320.0 | 305.0 | 290.4 | 282.4 |
| 30 - 34 " | 393.4 | 392.3 | 387.5 | 378.1 | 363.9 | 351.2 |
| 35 - 39 " | 363.1 | 364.3 | 363.8 | 366.6 | 371.5 | 378.7 |
| 40 - 44 " | 329.3 | 335.7 | 342.8 | 348.1 | 351.8 | 354.5 |
| 45 - 49 " | 304.1 | 308.1 | 312.1 | 314.9 | 319.5 | 326.3 |
| 50 - 54 " | 273.7 | 278.2 | 283.1 | 289.6 | 295.8 | 299.6 |
| 55 - 59 " | 243.4 | 248.0 | 251.1 | 255.3 | 259.9 | 266.7 |
| 60 - 64 " | 217.1 | 220.0 | 223.6 | 226.4 | 230.7 | 234.6 |
| 65 - 69 " | 172.1 | 181.5 | 189.4 | 196.3 | 202.6 | 206.6 |
| 70 - 74 " | 130.1 | 132.7 | 138.2 | 143.3 | 149.4 | 158.6 |
| 75 - 79 " | 101.4 | 103.6 | 105.8 | 108.3 | 111.1 | 113.1 |
| 80 - 84 " | 69.8 | 71.0 | 72.6 | 74.9 | 76.9 | 78.8 |
| 85 years and over | 58.2 | 60.5 | 62.1 | 63.8 | 66.0 | 68.4 |
| Total persons | 4,574.9 | 4,585.4 | 4,593.1 | 4,609.6 | 4,635.4 | 4,673.7 |
| Males | ||||||
| 0 - 4 years | 182.0 | 186.0 | 186.3 | 184.6 | 184.5 | 181.9 |
| 5 - 9 " | 163.5 | 166.1 | 169.9 | 174.4 | 179.0 | 183.8 |
| 10 - 14 " | 154.5 | 156.4 | 157.7 | 159.0 | 161.5 | 163.4 |
| 15 - 19 " | 143.7 | 141.3 | 141.3 | 144.0 | 146.1 | 148.0 |
| 20 - 24 " | 148.6 | 138.6 | 131.9 | 124.7 | 119.5 | 117.2 |
| 25 - 29 " | 175.1 | 163.5 | 154.1 | 146.2 | 140.6 | 139.3 |
| 30 - 34 " | 194.9 | 191.3 | 187.1 | 181.2 | 172.8 | 166.5 |
| 35 - 39 " | 181.9 | 181.5 | 180.4 | 180.6 | 181.6 | 184.6 |
| 40 - 44 " | 165.9 | 168.5 | 171.6 | 173.6 | 174.6 | 175.7 |
| 45 - 49 " | 151.3 | 153.1 | 155.5 | 157.5 | 159.6 | 163.2 |
| 50 - 54 " | 136.7 | 138.2 | 140.6 | 143.5 | 146.1 | 148.1 |
| 55 - 59 " | 121.8 | 123.6 | 124.8 | 126.9 | 128.9 | 132.2 |
| 60 - 64 " | 109.2 | 110.0 | 111.3 | 112.5 | 114.3 | 115.9 |
| 65 - 69 " | 85.6 | 90.6 | 94.6 | 97.9 | 100.4 | 102.3 |
| 70 - 74 " | 62.9 | 64.4 | 67.2 | 70.0 | 73.0 | 77.6 |
| 75 - 79 " | 46.3 | 47.6 | 48.8 | 50.2 | 51.9 | 53.0 |
| 80 - 84 " | 28.3 | 29.4 | 30.6 | 32.0 | 33.1 | 34.1 |
| 85 years and over | 18.4 | 19.4 | 20.1 | 21.0 | 22.2 | 23.7 |
| Total males | 2,270.5 | 2,269.6 | 2,273.8 | 2,279.7 | 2,289.5 | 2,310.5 |
| Females | ||||||
| 0 - 4 years | 174.1 | 178.6 | 179.4 | 177.9 | 176.4 | 173.7 |
| 5 - 9 " | 156.2 | 158.7 | 163.2 | 167.4 | 173.4 | 179.4 |
| 10 - 14 " | 146.6 | 149.0 | 151.1 | 152.4 | 154.6 | 157.1 |
| 15 - 19 " | 137.4 | 134.4 | 133.2 | 135.1 | 137.1 | 140.1 |
| 20 - 24 " | 149.9 | 139.2 | 126.9 | 119.6 | 114.0 | 109.6 |
| 25 - 29 " | 187.8 | 177.7 | 165.9 | 158.8 | 149.8 | 143.2 |
| 30 - 34 " | 198.5 | 201.0 | 200.4 | 196.9 | 191.0 | 184.6 |
| 35 - 39 " | 181.2 | 182.9 | 183.4 | 186.0 | 189.9 | 194.1 |
| 40 - 44 " | 163.4 | 167.1 | 171.1 | 174.4 | 177.2 | 178.8 |
| 45 - 49 " | 152.9 | 155.0 | 156.6 | 157.4 | 159.8 | 163.1 |
| 50 - 54 " | 137.1 | 140.0 | 142.5 | 146.1 | 149.7 | 151.6 |
| 55 - 59 " | 121.6 | 124.3 | 126.3 | 128.4 | 131.0 | 134.5 |
| 60 - 64 " | 107.9 | 109.9 | 112.3 | 113.9 | 116.4 | 118.7 |
| 65 - 69 " | 86.5 | 90.9 | 94.9 | 98.4 | 102.2 | 104.3 |
| 70 - 74 " | 67.2 | 68.3 | 71.0 | 73.4 | 76.4 | 81.0 |
| 75 - 79 " | 55.0 | 55.9 | 57.0 | 58.1 | 59.2 | 60.1 |
| 80 - 84 " | 41.5 | 41.6 | 42.0 | 42.9 | 43.8 | 44.7 |
| 85 years and over | 39.8 | 41.1 | 41.9 | 42.8 | 43.8 | 44.7 |
| Total females | 2,304.4 | 2,315.8 | 2,319.3 | 2,329.9 | 2,345.8 | 2,363.3 |
| 1 Census of Population. | ||||||
| 2 Preliminary. | ||||||
| Table 8 Estimated Population classified by Sex, Age Group and Regional Authority Area, April 20161 | |||||||||
| Sex and Age Group | State | Border | Dublin | Mid-East | Midland | Mid-West | South-East | South-West | West |
| '000 | |||||||||
| Persons | |||||||||
| 0 - 4 years | 355.6 | 37.7 | 105.7 | 44.7 | 22.2 | 27.3 | 36.0 | 49.2 | 32.8 |
| 5 - 9 " | 363.2 | 41.1 | 93.3 | 50.9 | 24.7 | 29.2 | 39.5 | 51.0 | 33.6 |
| 10 - 14 " | 320.5 | 37.3 | 78.4 | 43.3 | 22.3 | 26.6 | 36.5 | 45.2 | 31.0 |
| 15 - 19 " | 288.1 | 32.5 | 70.3 | 37.7 | 20.4 | 24.9 | 33.6 | 41.1 | 27.6 |
| 20 - 24 " | 226.8 | 20.4 | 63.6 | 27.0 | 15.6 | 18.0 | 27.9 | 34.7 | 19.6 |
| 25 - 29 " | 282.4 | 22.2 | 102.5 | 30.6 | 16.0 | 19.9 | 28.3 | 40.0 | 23.0 |
| 30 - 34 " | 351.2 | 28.4 | 131.2 | 38.3 | 19.6 | 25.1 | 33.0 | 46.5 | 29.0 |
| 35 - 39 " | 378.7 | 36.3 | 122.1 | 46.4 | 22.5 | 27.2 | 38.1 | 53.3 | 32.7 |
| 40 - 44 " | 354.5 | 36.3 | 101.0 | 46.1 | 22.5 | 27.6 | 37.1 | 51.2 | 32.7 |
| 45 - 49 " | 326.3 | 36.5 | 87.0 | 41.2 | 20.8 | 26.6 | 36.1 | 47.5 | 30.7 |
| 50 - 54 " | 299.6 | 34.2 | 78.2 | 35.7 | 18.9 | 25.1 | 34.0 | 44.8 | 28.8 |
| 55 - 59 " | 266.7 | 30.6 | 69.6 | 29.7 | 16.5 | 23.0 | 30.4 | 40.1 | 26.8 |
| 60 - 64 " | 234.6 | 27.5 | 59.7 | 25.3 | 14.4 | 20.7 | 26.9 | 35.4 | 24.7 |
| 65 - 69 " | 206.6 | 24.6 | 52.5 | 22.0 | 12.3 | 18.7 | 24.0 | 31.0 | 21.5 |
| 70 - 74 " | 158.6 | 19.0 | 40.5 | 16.3 | 9.5 | 14.2 | 18.6 | 24.1 | 16.3 |
| 75 - 79 " | 113.1 | 13.3 | 30.7 | 10.5 | 6.6 | 9.9 | 13.3 | 17.2 | 11.6 |
| 80 - 84 " | 78.8 | 9.5 | 21.4 | 6.7 | 4.7 | 6.7 | 9.1 | 12.2 | 8.4 |
| 85 years and over | 68.4 | 8.6 | 18.0 | 6.1 | 4.0 | 5.5 | 7.7 | 10.4 | 8.0 |
| Total persons | 4,673.7 | 496.1 | 1,325.7 | 558.6 | 293.3 | 376.3 | 510.1 | 675.0 | 438.7 |
| Males | |||||||||
| 0 - 4 years | 181.9 | 19.9 | 54.3 | 22.4 | 11.5 | 14.3 | 18.4 | 24.5 | 16.4 |
| 5 - 9 " | 183.8 | 21.1 | 46.6 | 25.2 | 12.9 | 15.4 | 20.1 | 25.4 | 17.1 |
| 10 - 14 " | 163.4 | 19.9 | 39.5 | 22.2 | 11.3 | 13.5 | 18.4 | 22.9 | 15.7 |
| 15 - 19 " | 148.0 | 17.2 | 35.9 | 19.9 | 10.4 | 12.8 | 17.4 | 20.5 | 14.0 |
| 20 - 24 " | 117.2 | 9.6 | 33.0 | 13.4 | 8.0 | 10.3 | 15.0 | 17.5 | 10.4 |
| 25 - 29 " | 139.3 | 10.1 | 50.9 | 14.0 | 7.8 | 10.0 | 14.2 | 20.3 | 11.9 |
| 30 - 34 " | 166.5 | 13.6 | 63.9 | 17.4 | 9.3 | 11.6 | 15.1 | 21.5 | 14.1 |
| 35 - 39 " | 184.6 | 17.0 | 59.9 | 22.6 | 11.3 | 13.5 | 18.2 | 25.8 | 16.4 |
| 40 - 44 " | 175.7 | 17.8 | 50.4 | 22.4 | 11.1 | 13.6 | 18.4 | 25.9 | 16.2 |
| 45 - 49 " | 163.2 | 18.3 | 43.4 | 20.5 | 10.6 | 13.3 | 17.9 | 23.8 | 15.4 |
| 50 - 54 " | 148.1 | 17.1 | 37.6 | 17.6 | 9.4 | 12.4 | 16.7 | 22.6 | 14.6 |
| 55 - 59 " | 132.2 | 15.2 | 33.7 | 14.7 | 8.4 | 11.7 | 15.2 | 20.1 | 13.3 |
| 60 - 64 " | 115.9 | 13.9 | 28.2 | 12.4 | 7.3 | 10.4 | 13.5 | 17.7 | 12.4 |
| 65 - 69 " | 102.3 | 12.4 | 25.1 | 11.1 | 6.2 | 9.2 | 12.0 | 15.4 | 10.9 |
| 70 - 74 " | 77.6 | 9.7 | 18.9 | 8.2 | 4.6 | 7.0 | 9.2 | 11.7 | 8.3 |
| 75 - 79 " | 53.0 | 6.4 | 13.7 | 5.0 | 3.2 | 4.7 | 6.5 | 8.0 | 5.7 |
| 80 - 84 " | 34.1 | 4.3 | 8.7 | 3.0 | 2.1 | 3.0 | 4.1 | 5.1 | 3.8 |
| 85 years and over | 23.7 | 3.0 | 5.9 | 2.2 | 1.4 | 1.9 | 2.8 | 3.6 | 2.9 |
| Total males | 2,310.5 | 246.5 | 649.6 | 274.1 | 146.7 | 188.7 | 253.1 | 332.4 | 219.4 |
| Females | |||||||||
| 0 - 4 years | 173.7 | 17.8 | 51.4 | 22.3 | 10.6 | 13.0 | 17.6 | 24.6 | 16.4 |
| 5 - 9 " | 179.4 | 20.0 | 46.8 | 25.6 | 11.8 | 13.8 | 19.4 | 25.6 | 16.5 |
| 10 - 14 " | 157.1 | 17.4 | 38.9 | 21.1 | 11.0 | 13.1 | 18.0 | 22.4 | 15.3 |
| 15 - 19 " | 140.1 | 15.3 | 34.4 | 17.9 | 10.0 | 12.2 | 16.2 | 20.6 | 13.6 |
| 20 - 24 " | 109.6 | 10.8 | 30.6 | 13.7 | 7.6 | 7.7 | 12.9 | 17.2 | 9.1 |
| 25 - 29 " | 143.2 | 12.2 | 51.5 | 16.6 | 8.2 | 9.8 | 14.1 | 19.7 | 11.1 |
| 30 - 34 " | 184.6 | 14.8 | 67.3 | 20.9 | 10.3 | 13.6 | 17.9 | 25.0 | 14.9 |
| 35 - 39 " | 194.1 | 19.4 | 62.2 | 23.8 | 11.3 | 13.6 | 19.9 | 27.5 | 16.3 |
| 40 - 44 " | 178.8 | 18.5 | 50.5 | 23.7 | 11.4 | 14.0 | 18.8 | 25.3 | 16.5 |
| 45 - 49 " | 163.1 | 18.2 | 43.6 | 20.7 | 10.1 | 13.3 | 18.1 | 23.8 | 15.3 |
| 50 - 54 " | 151.6 | 17.1 | 40.6 | 18.0 | 9.4 | 12.7 | 17.3 | 22.1 | 14.2 |
| 55 - 59 " | 134.5 | 15.4 | 36.0 | 15.1 | 8.1 | 11.3 | 15.2 | 20.0 | 13.5 |
| 60 - 64 " | 118.7 | 13.6 | 31.4 | 13.0 | 7.1 | 10.3 | 13.4 | 17.7 | 12.3 |
| 65 - 69 " | 104.3 | 12.2 | 27.4 | 10.9 | 6.2 | 9.4 | 12.0 | 15.6 | 10.6 |
| 70 - 74 " | 81.0 | 9.3 | 21.6 | 8.1 | 4.8 | 7.2 | 9.5 | 12.4 | 8.1 |
| 75 - 79 " | 60.1 | 6.9 | 17.1 | 5.5 | 3.4 | 5.2 | 6.9 | 9.2 | 5.9 |
| 80 - 84 " | 44.7 | 5.2 | 12.7 | 3.8 | 2.6 | 3.7 | 5.0 | 7.0 | 4.6 |
| 85 years and over | 44.7 | 5.6 | 12.0 | 3.9 | 2.6 | 3.6 | 4.9 | 6.9 | 5.2 |
| Total females | 2,363.3 | 249.6 | 676.1 | 284.4 | 146.6 | 187.6 | 257.0 | 342.6 | 219.4 |
| 1 Preliminary. | |||||||||
| Table 9 Estimated Population classified by Sex and Nationality, 2011 - 2016 | ||||||
| Year ending April / Nationality | Population | |||||
| 20111 | 20122 | 20132 | 20142 | 20152 | 20162 | |
| '000 | ||||||
| Persons | ||||||
| Irish | 4,017.9 | 4,035.0 | 4,038.6 | 4,045.3 | 4,057.4 | 4,079.8 |
| UK | 114.9 | 113.0 | 113.4 | 114.9 | 115.5 | 116.7 |
| Rest of EU153 | 49.4 | 45.5 | 43.2 | 38.1 | 31.7 | 31.6 |
| EU134 | 231.5 | 229.4 | 228.6 | 230.7 | 237.4 | 238.7 |
| Rest of world | 161.2 | 162.5 | 169.3 | 180.5 | 193.4 | 206.9 |
| Total persons | 4,574.9 | 4,585.4 | 4,593.1 | 4,609.6 | 4,635.4 | 4,673.7 |
| Males | ||||||
| Irish | 1,991.9 | 1,999.9 | 2,002.3 | 2,003.8 | 2,009.6 | 2,021.7 |
| UK | 57.8 | 56.5 | 56.6 | 56.7 | 56.1 | 56.3 |
| Rest of EU153 | 23.9 | 21.3 | 21.4 | 20.2 | 18.6 | 20.2 |
| EU134 | 116.5 | 114.1 | 113.6 | 113.4 | 114.7 | 114.3 |
| Rest of world | 80.4 | 77.7 | 79.9 | 85.6 | 90.6 | 97.8 |
| Total males | 2,270.5 | 2,269.6 | 2,273.8 | 2,279.7 | 2,289.5 | 2,310.5 |
| Females | ||||||
| Irish | 2,026.0 | 2,035.1 | 2,036.4 | 2,041.6 | 2,047.8 | 2,058.1 |
| UK | 57.1 | 56.4 | 56.8 | 58.2 | 59.4 | 60.4 |
| Rest of EU153 | 25.5 | 24.2 | 21.7 | 17.9 | 13.1 | 11.4 |
| EU134 | 114.9 | 115.3 | 115.1 | 117.4 | 122.7 | 124.3 |
| Rest of world | 80.8 | 84.8 | 89.4 | 94.9 | 102.8 | 109.1 |
| Total females | 2,304.4 | 2,315.8 | 2,319.3 | 2,329.9 | 2,345.8 | 2,363.3 |
| 1 Census of Population. | ||||||
| 2 Preliminary. | ||||||
| 3 Rest of EU 15: countries before enlargement on 1 May 2004, (i.e. Austria, Belgium, Denmark, Finland, France, Germany, Greece, Italy, Luxembourg, Netherlands, Spain, Sweden, Portugal). | ||||||
| 4 EU13: defined as 10 countries that joined the EU on 1 May 2004 (i.e. Cyprus, Czech Republic, Estonia, Hungary, Latvia, Lithuania, Malta, Poland, Slovakia, Slovenia), along with Bulgaria and Romania who joined on 1 January 2007 and Croatia who joined on the 1 July 2013. | ||||||
Coverage
The reference period for the population estimates is mid-April of the years shown, while the migration flows are in respect of the twelve months to mid-April of the corresponding years, as are the births and deaths. The population classified by age and sex for the year 2011 is taken from the Census of Population.
Source of Migration data
The principal source of information for the estimation of the gross annual migration flows is the Quarterly National Household Survey (QNHS), which also provides the basis for the classification of the flows by sex, age group, origin/destination and nationality.
The migration estimates are compiled with reference to movements in other migration indicators such as the number of Personal Public Service (PPS) numbers allocated to non-Irish nationals and the number of visas issued to Irish nationals to a number of the destinations including Australia, US and Canada. In addition, data on National Insurance numbers (equivalent to PPS numbers) issued to Irish nationals in the UK is referenced.
Calculation of annual population estimates
The annual population estimates for mid-April in this release were calculated by trending forwards the previous Census of Population data. For example, the base population data for estimating the April 2012 figure was the number of males and females in each region by single year of age and nationality as established by the 2011 Census. From this base, each person was aged by one year, births for the period were added and deaths were subtracted.
The estimated number of immigrants was then added and the number of emigrants was subtracted. Allowance was also made for estimated inter-regional migration in arriving at the final 2012 figures. The end result of this overall process provided the population estimate for April 2012 which in turn will provide the base population for the subsequent year and so on. The population estimates are subject to revision once the definitive results of the next census become available.
The population by nationality estimates are made possible by trending forwards the previous Census of Population and incorporating gross migration flows by nationality based on responses in the QNHS. Births by nationality are estimated using the distribution of the nationality of babies as recorded in the 2011 census, while deaths by nationality are also estimated based on recent census results on the nationality distribution of the population by single year of age.
Migration classified by principal economic status and educational attainment
This release provides estimates of immigration and emigration by educational attainment (Table 5) and principal economic status (Table 6), based on responses in the QNHS.
The principal economic status question identifies whether the person sampled (who is aged 15 or over) is:
1. Working for payment or profit
2. Looking for first regular job
3. Unemployed, having lost or given up previous job
4. Actively looking for work after voluntary interruption of working life (for 12 months or more) for personal or domestic reasons
5. Student or pupil
6. Engaged on home duties
7. Retired from employment
8. Unable to work due to permanent sickness or disability
9. Other
This is a self-perception question, i.e. people are classified according to how they perceive their situation. These categories are subsequently collapsed to provide the categories included in table 6.
As with all the breakdowns of migration (by age, nationality, origin and destination), the breakdown by educational attainment and principal economic status should be considered broadly indicative given the relatively small sample sizes associated with these flows. In addition, as a person’s principal economic status can change over the course of the year (and to a lesser extent their education attainment), for immigrants these two tables refer to their current status, while for emigrants these tables refer to their status in the period prior to departure.
This is part of the ongoing work by the CSO to improve data in this area, which in recent years has included new data on the nationality of emigrants (Table 2), the inclusion of Canada and Australia as individual countries of origin/destination in the migration estimates (Table 3) and an estimate of the total population by nationality (Table 9).
Usual residence population concept
For the purpose of this release the population concept of usual residence has been used, i.e. all persons usually resident and present in the State on census night plus absent persons who are usually resident in Ireland but are temporarily away from home and outside the State on census night. All persons are classified according to their region of usual residence.
Implications of Census 2016 Preliminary Results
The preliminary total for the population enumerated on Census Night 24th April 2016 was 4,757,976 persons. The preliminary census figures relate to the de-facto population, meaning the population recorded for each enumeration area on the night Sunday, 24 April 2016, together with persons who arrived in the area on the morning of Monday, 25 April 2016 not having been enumerated elsewhere. The figures therefore include visitors present on the Census Night as well as those in residence, while usual residents temporarily absent from the area are excluded.
The estimated population total for the year to April 2016, as detailed in the 2016 population and migration estimates is 4,673,700 persons. The estimated population figures relate to the usual residence population concept (as outlined above). There is a difference of just over 84,000 between the two figures.
The CSO will be revising the annual population estimates for 2012 to 2016 based on the final Census usual residence population count. However, this work cannot be commenced until the final Census results are available due to the fact that the generation of the alternative population estimates requires detailed demographic information, such as the number of persons broken down by nationality, age group and gender.
The final Census count is expected to become available in March/April 2017.
 Hide Background Notes
Scan the QR code below to view this release online or go to
http://www.cso.ie/en/releasesandpublications/er/pme/populationandmigrationestimatesapril2016/
 Show Table 1 Components of the annual population change, 1987 - 2016
 Hide Table 1 Components of the annual population change, 1987 - 2016