
No link available
| Seasonally Adjusted Production in Building and Construction Index | ||||
| (Base: Year 2010=100) | ||||
| Volume Index | Value Index | |||
| Q3 2015 | 108.0 | 106.0 | ||
| Q2 2016 | 125.7 | 127.3 | ||
| Q3 2016 | 129.0 | 131.0 | ||
| Quarterly % change | 2.6% | 2.9% | ||
| Annual % change | 19.4% | 23.6% | ||
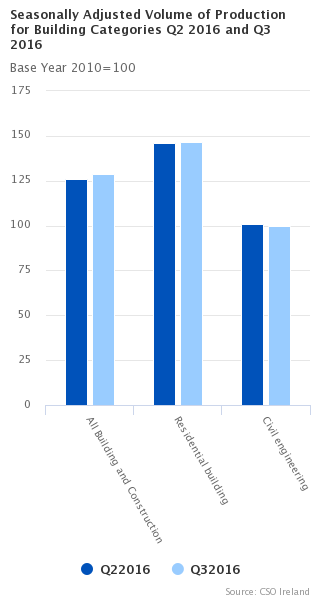
The volume of output in building and construction increased by 2.6% in the third quarter of 2016 when compared with the preceding period.
This reflects increases of 6.7% and 0.1% respectively in the volume of non-residential and residential building work. The volume of civil engineering work fell by 1.4% in the same period*. The change in the value of production for all building and construction was +2.9%. See tables 1(a), 1(c), 2(a), 2(b) and graph.
On an annual basis, the volume of output in building and construction increased by 19.4% in the third quarter of 2016 when compared with the third quarter of 2015*. Output volumes increased by 30.8%, 27.8% and 8.7% respectively in residential, non-residential building and civil engineering work in Quarter 3, 2016. There was an increase of 23.6% in the value of production in the same period. See tables 1(a), 1(c), 2(a), 2(b) and graph.
|
*Given the unprecedented low base this series is starting from, the CSO will continue to monitor the quality and comparability of this new data series. |
| X-axis label | Q32015 | Q42015 | Q12015 | Q22016 | Q32016 |
|---|---|---|---|---|---|
| All Building and Construction | 108 | 110.3 | 117.1 | 125.7 | 129 |
| Building (excluding civil engineering) | 111.7 | 114.5 | 126.6 | 140.1 | 144.7 |
| Residential building | 111.9 | 113 | 131.6 | 146.2 | 146.4 |
| Non-residential building | 111.4 | 117.9 | 120.4 | 133.5 | 142.4 |
| Civil engineering | 91.7 | 95.7 | 96.4 | 101.1 | 99.7 |
| Table 1(a) Seasonally Adjusted Indices of Production in all Building and Construction1 | |||||||||
| Base Year: 2010=100 | |||||||||
| Value of Production | Volume of Production | ||||||||
| Period | Index | % change on previous period | Annual % change | Index | % change on previous period | Annual % change | |||
| 2006 | 339.7 | 9.8 | 365.9 | 3.0 | |||||
| 2007 | 308.8 | -9.1 | 316.3 | -13.5 | |||||
| 2008 | 227.0 | -26.5 | 225.4 | -28.7 | |||||
| 2009 | 141.5 | -37.7 | 144.0 | -36.1 | |||||
| 2010 | 100.0 | -29.2 | 100.0 | -30.4 | |||||
| 2011 | 81.0 | -19.1 | 83.6 | -16.5 | |||||
| 2012 | 79.8 | -1.5 | 80.1 | -4.2 | |||||
| 2013 | 89.4 | 12.0 | 89.5 | 11.8 | |||||
| 2014 | 98.0 | 9.7 | 98.3 | 9.8 | |||||
| 2015 | 106.7 | 8.9 | 106.4 | 8.3 | |||||
| 2006 | 1st quarter | 341.6 | 7.0 | 19.3 | 369.1 | 0.5 | 12.1 | ||
| 2nd quarter | 328.2 | -3.9 | 5.7 | 358.7 | -2.8 | 0.4 | |||
| 3rd quarter | 330.4 | 0.7 | 2.8 | 364.5 | 1.6 | -0.8 | |||
| 4th quarter | 358.6 | 8.5 | 12.3 | 371.2 | 1.8 | 1.1 | |||
| 2007 | 1st quarter | 323.6 | -9.8 | -5.3 | 343.1 | -7.6 | -7.0 | ||
| 2nd quarter | 324.3 | 0.2 | -1.2 | 336.4 | -2.0 | -6.2 | |||
| 3rd quarter | 300.2 | -7.4 | -9.1 | 304.2 | -9.6 | -16.5 | |||
| 4th quarter | 287.1 | -4.4 | -19.9 | 281.5 | -7.5 | -24.2 | |||
| 2008 | 1st quarter | 263.0 | -8.4 | -18.7 | 261.7 | -7.0 | -23.7 | ||
| 2nd quarter | 242.0 | -8.0 | -25.4 | 241.2 | -7.8 | -28.3 | |||
| 3rd quarter | 217.2 | -10.2 | -27.6 | 211.4 | -12.4 | -30.5 | |||
| 4th quarter | 185.9 | -14.4 | -35.2 | 187.3 | -11.4 | -33.5 | |||
| 2009 | 1st quarter | 168.3 | -9.5 | -36.0 | 166.7 | -11.0 | -36.3 | ||
| 2nd quarter | 147.0 | -12.7 | -39.3 | 148.8 | -10.7 | -38.3 | |||
| 3rd quarter | 134.2 | -8.7 | -38.2 | 139.8 | -6.0 | -33.9 | |||
| 4th quarter | 116.3 | -13.3 | -37.4 | 120.6 | -13.7 | -35.6 | |||
| 2010 | 1st quarter | 107.6 | -7.5 | -36.1 | 105.5 | -12.5 | -36.7 | ||
| 2nd quarter | 104.9 | -2.5 | -28.6 | 105.3 | -0.2 | -29.2 | |||
| 3rd quarter | 96.4 | -8.1 | -28.2 | 99.3 | -5.7 | -29.0 | |||
| 4th quarter | 91.5 | -5.1 | -21.3 | 90.6 | -8.8 | -24.9 | |||
| 2011 | 1st quarter | 82.4 | -9.9 | -23.4 | 84.1 | -7.2 | -20.3 | ||
| 2nd quarter | 78.5 | -4.7 | -25.2 | 81.0 | -3.7 | -23.1 | |||
| 3rd quarter | 80.9 | 3.1 | -16.1 | 83.2 | 2.7 | -16.2 | |||
| 4th quarter | 82.3 | 1.7 | -10.1 | 86.2 | 3.6 | -4.9 | |||
| 2012 | 1st quarter | 82.0 | -0.4 | -0.5 | 82.4 | -4.4 | -2.0 | ||
| 2nd quarter | 76.2 | -7.1 | -2.9 | 77.4 | -6.1 | -4.4 | |||
| 3rd quarter | 77.2 | 1.3 | -4.6 | 78.1 | 0.9 | -6.1 | |||
| 4th quarter | 83.7 | 8.4 | 1.7 | 82.4 | 5.5 | -4.4 | |||
| 2013 | 1st quarter | 84.0 | 0.4 | 2.4 | 86.8 | 5.3 | 5.3 | ||
| 2nd quarter | 86.4 | 2.9 | 13.4 | 87.2 | 0.5 | 12.7 | |||
| 3rd quarter | 92.8 | 7.4 | 20.2 | 91.9 | 5.4 | 17.7 | |||
| 4th quarter | 94.2 | 1.5 | 12.5 | 92.1 | 0.2 | 11.8 | |||
| 2014 | 1st quarter | 93.8 | -0.4 | 11.7 | 96.1 | 4.3 | 10.7 | ||
| 2nd quarter | 97.8 | 4.3 | 13.2 | 98.0 | 2.0 | 12.4 | |||
| 3rd quarter | 99.3 | 1.5 | 7.0 | 97.6 | -0.4 | 6.2 | |||
| 4th quarter | 101.0 | 1.7 | 7.2 | 101.3 | 3.8 | 10.0 | |||
| 2015 | 1st quarter | 104.1 | 3.1 | 11.0 | 101.8 | 0.5 | 5.9 | ||
| 2nd quarter | 106.4 | 2.2 | 8.8 | 105.6 | 3.7 | 7.8 | |||
| 3rd quarter | 106.0 | -0.4 | 6.7 | 108.0 | 2.3 | 10.7 | |||
| 4th quarter | 110.1 | 3.9 | 9.0 | 110.3 | 2.1 | 8.9 | |||
| 2016 | 1st quarter | 117.8 | 7.0 | 13.2 | 117.1 | 6.2 | 15.0 | ||
| 2nd quarter | 127.3 | 8.1 | 19.6 | 125.7 | 7.3 | 19.0 | |||
| 3rd quarter2 | 131.0 | 2.9 | 23.6 | 129.0 | 2.6 | 19.4 | |||
| 1Based on Seasonal Patterns up to Quarter 3, 2016 | |||||||||
| 2Provisional | |||||||||
| Table 1(b) Seasonally Adjusted Indices of Production in Building (Excluding Civil Engineering)1 | |||||||||
| Base Year: 2010=100 | |||||||||
| Value of Production | Volume of Production | ||||||||
| Period | Index | % change on previous period | Annual % change | Index | % change on previous period | Annual % change | |||
| 2006 | 448.8 | 8.4 | 484.8 | 2.4 | |||||
| 2007 | 393.0 | -12.4 | 405.5 | -16.4 | |||||
| 2008 | 269.4 | -31.5 | 268.7 | -33.7 | |||||
| 2009 | 148.7 | -44.8 | 150.3 | -44.0 | |||||
| 2010 | 100.0 | -32.8 | 100.0 | -33.5 | |||||
| 2011 | 84.4 | -15.6 | 86.5 | -13.5 | |||||
| 2012 | 75.6 | -10.4 | 76.9 | -11.1 | |||||
| 2013 | 87.4 | 15.6 | 88.2 | 14.8 | |||||
| 2014 | 98.4 | 12.5 | 98.3 | 11.4 | |||||
| 2015 | 113.3 | 15.2 | 112.3 | 14.3 | |||||
| 2006 | 1st quarter | 452.3 | 6.1 | 16.5 | 498.2 | 4.8 | 11.1 | ||
| 2nd quarter | 434.5 | -3.9 | 3.6 | 474.8 | -4.7 | -1.4 | |||
| 3rd quarter | 431.2 | -0.8 | 1.9 | 471.3 | -0.7 | -3.4 | |||
| 4th quarter | 477.2 | 10.7 | 12.0 | 494.9 | 5.0 | 4.1 | |||
| 2007 | 1st quarter | 413.1 | -13.4 | -8.7 | 430.6 | -13.0 | -13.6 | ||
| 2nd quarter | 418.2 | 1.2 | -3.8 | 434.7 | 1.0 | -8.4 | |||
| 3rd quarter | 378.3 | -9.5 | -12.3 | 391.2 | -10.0 | -17.0 | |||
| 4th quarter | 362.5 | -4.2 | -24.0 | 365.4 | -6.6 | -26.2 | |||
| 2008 | 1st quarter | 321.2 | -11.4 | -22.2 | 321.0 | -12.2 | -25.5 | ||
| 2nd quarter | 290.4 | -9.6 | -30.6 | 289.9 | -9.7 | -33.3 | |||
| 3rd quarter | 252.2 | -13.2 | -33.3 | 252.2 | -13.0 | -35.5 | |||
| 4th quarter | 213.7 | -15.3 | -41.0 | 211.5 | -16.1 | -42.1 | |||
| 2009 | 1st quarter | 184.7 | -13.6 | -42.5 | 185.4 | -12.3 | -42.2 | ||
| 2nd quarter | 157.2 | -14.9 | -45.9 | 159.2 | -14.1 | -45.1 | |||
| 3rd quarter | 135.8 | -13.6 | -46.2 | 138.1 | -13.3 | -45.2 | |||
| 4th quarter | 117.1 | -13.8 | -45.2 | 118.6 | -14.1 | -43.9 | |||
| 2010 | 1st quarter | 104.9 | -10.4 | -43.2 | 105.5 | -11.0 | -43.1 | ||
| 2nd quarter | 99.4 | -5.2 | -36.8 | 99.4 | -5.8 | -37.6 | |||
| 3rd quarter | 100.3 | 0.9 | -26.1 | 99.9 | 0.5 | -27.7 | |||
| 4th quarter | 95.3 | -5.0 | -18.6 | 95.2 | -4.7 | -19.7 | |||
| 2011 | 1st quarter | 88.0 | -7.7 | -16.1 | 89.4 | -6.1 | -15.3 | ||
| 2nd quarter | 83.8 | -4.8 | -15.7 | 86.2 | -3.6 | -13.3 | |||
| 3rd quarter | 82.5 | -1.6 | -17.7 | 84.9 | -1.5 | -15.0 | |||
| 4th quarter | 83.3 | 1.0 | -12.6 | 85.5 | 0.7 | -10.2 | |||
| 2012 | 1st quarter | 79.6 | -4.4 | -9.5 | 81.2 | -5.0 | -9.2 | ||
| 2nd quarter | 74.6 | -6.3 | -11.0 | 75.7 | -6.8 | -12.2 | |||
| 3rd quarter | 73.8 | -1.1 | -10.5 | 75.0 | -0.9 | -11.7 | |||
| 4th quarter | 74.4 | 0.8 | -10.7 | 75.6 | 0.8 | -11.6 | |||
| 2013 | 1st quarter | 79.7 | 7.1 | 0.1 | 80.5 | 6.5 | -0.9 | ||
| 2nd quarter | 84.6 | 6.1 | 13.4 | 85.4 | 6.1 | 12.8 | |||
| 3rd quarter | 90.2 | 6.6 | 22.2 | 91.1 | 6.7 | 21.5 | |||
| 4th quarter | 95.1 | 5.4 | 27.8 | 95.9 | 5.3 | 26.9 | |||
| 2014 | 1st quarter | 94.1 | -1.1 | 18.1 | 94.5 | -1.5 | 17.4 | ||
| 2nd quarter | 94.2 | 0.1 | 11.3 | 94.2 | -0.3 | 10.3 | |||
| 3rd quarter | 99.8 | 5.9 | 10.6 | 99.5 | 5.6 | 9.2 | |||
| 4th quarter | 105.3 | 5.5 | 10.7 | 104.8 | 5.3 | 9.3 | |||
| 2015 | 1st quarter | 109.4 | 3.9 | 16.3 | 108.4 | 3.4 | 14.7 | ||
| 2nd quarter | 115.6 | 5.7 | 22.7 | 114.5 | 5.6 | 21.5 | |||
| 3rd quarter | 112.6 | -2.6 | 12.8 | 111.7 | -2.4 | 12.3 | |||
| 4th quarter | 115.7 | 2.8 | 9.9 | 114.5 | 2.5 | 9.3 | |||
| 2016 | 1st quarter | 128.8 | 11.3 | 17.7 | 126.6 | 10.6 | 16.8 | ||
| 2nd quarter | 141.9 | 10.2 | 22.8 | 140.1 | 10.7 | 22.4 | |||
| 3rd quarter2 | 146.9 | 3.5 | 30.5 | 144.7 | 3.3 | 29.5 | |||
| 1Based on Seasonal Patterns up to Quarter 3, 2016 | |||||||||
| 2Provisional | |||||||||
| Table 1(c) Seasonally Adjusted Indices of Production in Civil Engineering 1 | |||||||||
| Base Year: 2010=100 | |||||||||
| Value of Production | Volume of Production | ||||||||
| Period | Index | % change on previous period | Annual % change | Index | % change on previous period | Annual % change | |||
| 2006 | 140.3 | 19.1 | 151.5 | 12.6 | |||||
| 2007 | 153.7 | 9.6 | 158.3 | 4.5 | |||||
| 2008 | 149.2 | -3.0 | 148.5 | -6.2 | |||||
| 2009 | 128.0 | -14.2 | 129.4 | -12.9 | |||||
| 2010 | 99.7 | -22.1 | 99.7 | -22.9 | |||||
| 2011 | 75.0 | -24.8 | 77.0 | -22.8 | |||||
| 2012 | 88.2 | 17.6 | 89.8 | 16.6 | |||||
| 2013 | 93.1 | 5.6 | 94.0 | 4.7 | |||||
| 2014 | 97.2 | 4.3 | 96.9 | 3.1 | |||||
| 2015 | 93.9 | -3.4 | 92.8 | -4.2 | |||||
| 2006 | 1st quarter | 136.6 | 5.2 | 36.2 | 151.2 | 3.0 | 29.9 | ||
| 2nd quarter | 134.0 | -1.9 | 21.3 | 145.4 | -3.8 | 15.6 | |||
| 3rd quarter | 138.5 | 3.4 | 6.1 | 149.2 | 2.6 | 0.1 | |||
| 4th quarter | 152.0 | 9.7 | 17.0 | 160.0 | 7.2 | 9.0 | |||
| 2007 | 1st quarter | 154.2 | 1.4 | 12.9 | 161.3 | 0.8 | 6.7 | ||
| 2nd quarter | 154.3 | 0.1 | 15.1 | 159.7 | -1.0 | 9.8 | |||
| 3rd quarter | 152.0 | -1.5 | 9.7 | 155.1 | -2.9 | 4.0 | |||
| 4th quarter | 154.3 | 1.5 | 1.5 | 156.9 | 1.2 | -1.9 | |||
| 2008 | 1st quarter | 152.2 | -1.4 | -1.3 | 153.1 | -2.4 | -5.1 | ||
| 2nd quarter | 156.6 | 2.9 | 1.5 | 156.3 | 2.1 | -2.1 | |||
| 3rd quarter | 149.9 | -4.3 | -1.4 | 148.1 | -5.2 | -4.5 | |||
| 4th quarter | 137.9 | -8.0 | -10.6 | 136.4 | -7.9 | -13.1 | |||
| 2009 | 1st quarter | 135.3 | -1.9 | -11.1 | 137.0 | 0.4 | -10.5 | ||
| 2nd quarter | 130.0 | -3.9 | -17.0 | 132.1 | -3.6 | -15.5 | |||
| 3rd quarter | 129.7 | -0.2 | -13.5 | 130.6 | -1.1 | -11.8 | |||
| 4th quarter | 117.0 | -9.8 | -15.2 | 117.7 | -9.9 | -13.7 | |||
| 2010 | 1st quarter | 111.5 | -4.7 | -17.6 | 113.7 | -3.4 | -17.0 | ||
| 2nd quarter | 116.4 | 4.4 | -10.5 | 117.4 | 3.3 | -11.1 | |||
| 3rd quarter | 86.5 | -25.7 | -33.3 | 83.8 | -28.6 | -35.8 | |||
| 4th quarter | 84.2 | -2.7 | -28.0 | 84.0 | 0.2 | -28.6 | |||
| 2011 | 1st quarter | 74.0 | -12.1 | -33.6 | 76.3 | -9.2 | -32.9 | ||
| 2nd quarter | 70.4 | -4.9 | -39.5 | 72.9 | -4.5 | -37.9 | |||
| 3rd quarter | 75.8 | 7.7 | -12.4 | 75.6 | 3.7 | -9.8 | |||
| 4th quarter | 79.7 | 5.1 | -5.3 | 83.3 | 10.2 | -0.8 | |||
| 2012 | 1st quarter | 87.2 | 9.4 | 17.8 | 89.2 | 7.1 | 16.9 | ||
| 2nd quarter | 80.2 | -8.0 | 13.9 | 81.9 | -8.2 | 12.3 | |||
| 3rd quarter | 82.6 | 3.0 | 9.0 | 81.2 | -0.9 | 7.4 | |||
| 4th quarter | 102.6 | 24.2 | 28.7 | 106.8 | 31.5 | 28.2 | |||
| 2013 | 1st quarter | 92.7 | -9.6 | 6.3 | 92.6 | -13.3 | 3.8 | ||
| 2nd quarter | 90.5 | -2.4 | 12.8 | 91.9 | -0.8 | 12.2 | |||
| 3rd quarter | 97.4 | 7.6 | 17.9 | 96.6 | 5.1 | 19.0 | |||
| 4th quarter | 91.9 | -5.6 | -10.4 | 94.7 | -2.0 | -11.3 | |||
| 2014 | 1st quarter | 93.6 | 1.8 | 1.0 | 92.4 | -2.4 | -0.2 | ||
| 2nd quarter | 105.6 | 12.8 | 16.7 | 106.9 | 15.7 | 16.3 | |||
| 3rd quarter | 98.3 | -6.9 | 0.9 | 96.6 | -9.6 | 0.0 | |||
| 4th quarter | 91.2 | -7.2 | -0.8 | 91.5 | -5.3 | -3.4 | |||
| 2015 | 1st quarter | 94.4 | 3.5 | 0.9 | 93.0 | 1.6 | 0.6 | ||
| 2nd quarter | 90.9 | -3.7 | -13.9 | 90.8 | -2.4 | -15.1 | |||
| 3rd quarter | 93.0 | 2.3 | -5.4 | 91.7 | 1.0 | -5.1 | |||
| 4th quarter | 97.2 | 4.5 | 6.6 | 95.7 | 4.4 | 4.6 | |||
| 2016 | 1st quarter | 97.5 | 0.3 | 3.3 | 96.4 | 0.7 | 3.7 | ||
| 2nd quarter | 102.4 | 5.0 | 12.7 | 101.1 | 4.9 | 11.3 | |||
| 3rd quarter2 | 101.4 | -1.0 | 9.0 | 99.7 | -1.4 | 8.7 | |||
| 1 Based on Seasonal Patterns up to Quarter 3, 2016 | |||||||||
| 2 Provisional | |||||||||
| Table 2(a) Seasonally Adjusted Indices of Production in Residential Building 1 | |||||||||
| Base Year: 2010=100 | |||||||||
| Value of Production | Volume of Production | ||||||||
| Period | Index | % change on previous period | Annual % change | Index | % change on previous period | Annual % change | |||
| 2006 | 814.2 | 7.6 | 877.2 | 1.5 | |||||
| 2007 | 672.7 | -17.4 | 692.9 | -21.0 | |||||
| 2008 | 384.6 | -42.8 | 383.9 | -44.6 | |||||
| 2009 | 159.4 | -58.6 | 161.2 | -58.0 | |||||
| 2010 | 100.2 | -37.1 | 100.4 | -37.7 | |||||
| 2011 | 71.4 | -28.8 | 73.2 | -27.1 | |||||
| 2012 | 63.0 | -11.7 | 64.2 | -12.3 | |||||
| 2013 | 70.3 | 11.5 | 70.9 | 10.5 | |||||
| 2014 | 83.0 | 18.1 | 83.2 | 17.3 | |||||
| 2015 | 108.3 | 30.5 | 107.6 | 29.3 | |||||
| 2006 | 1st quarter | 820.5 | 9.9 | 14.2 | 891.8 | 5.5 | 9.5 | ||
| 2nd quarter | 791.9 | -3.5 | 0.8 | 858.2 | -3.8 | -3.8 | |||
| 3rd quarter | 784.4 | -0.9 | 1.0 | 861.4 | 0.4 | -5.0 | |||
| 4th quarter | 859.9 | 9.6 | 15.2 | 897.2 | 4.2 | 6.1 | |||
| 2007 | 1st quarter | 718.1 | -16.5 | -12.5 | 748.8 | -16.5 | -16.0 | ||
| 2nd quarter | 733.2 | 2.1 | -7.4 | 758.0 | 1.2 | -11.7 | |||
| 3rd quarter | 639.6 | -12.8 | -18.5 | 659.6 | -13.0 | -23.4 | |||
| 4th quarter | 599.7 | -6.2 | -30.3 | 605.0 | -8.3 | -32.6 | |||
| 2008 | 1st quarter | 493.3 | -17.7 | -31.3 | 497.3 | -17.8 | -33.6 | ||
| 2nd quarter | 426.2 | -13.6 | -41.9 | 424.6 | -14.6 | -44.0 | |||
| 3rd quarter | 356.1 | -16.4 | -44.3 | 352.5 | -17.0 | -46.6 | |||
| 4th quarter | 262.9 | -26.2 | -56.2 | 261.0 | -26.0 | -56.9 | |||
| 2009 | 1st quarter | 211.2 | -19.7 | -57.2 | 213.8 | -18.1 | -57.0 | ||
| 2nd quarter | 168.3 | -20.3 | -60.5 | 170.5 | -20.3 | -59.8 | |||
| 3rd quarter | 138.8 | -17.5 | -61.0 | 140.0 | -17.9 | -60.3 | |||
| 4th quarter | 119.1 | -14.2 | -54.7 | 120.5 | -13.9 | -53.8 | |||
| 2010 | 1st quarter | 105.6 | -11.3 | -50.0 | 106.7 | -11.5 | -50.1 | ||
| 2nd quarter | 102.8 | -2.7 | -38.9 | 103.4 | -3.1 | -39.4 | |||
| 3rd quarter | 101.5 | -1.3 | -26.9 | 100.3 | -3.0 | -28.4 | |||
| 4th quarter | 90.8 | -10.5 | -23.8 | 91.0 | -9.3 | -24.5 | |||
| 2011 | 1st quarter | 79.2 | -12.8 | -25.0 | 79.9 | -12.2 | -25.1 | ||
| 2nd quarter | 68.9 | -13.0 | -33.0 | 71.5 | -10.5 | -30.9 | |||
| 3rd quarter | 66.7 | -3.2 | -34.3 | 68.5 | -4.2 | -31.7 | |||
| 4th quarter | 70.6 | 5.8 | -22.2 | 72.8 | 6.3 | -20.0 | |||
| 2012 | 1st quarter | 67.2 | -4.8 | -15.2 | 67.7 | -7.0 | -15.3 | ||
| 2nd quarter | 61.5 | -8.5 | -10.7 | 63.2 | -6.6 | -11.6 | |||
| 3rd quarter | 63.2 | 2.8 | -5.2 | 63.8 | 0.9 | -6.9 | |||
| 4th quarter | 60.2 | -4.7 | -14.7 | 62.0 | -2.8 | -14.8 | |||
| 2013 | 1st quarter | 73.1 | 21.4 | 8.8 | 72.3 | 16.6 | 6.8 | ||
| 2nd quarter | 68.9 | -5.7 | 12.0 | 70.0 | -3.2 | 10.8 | |||
| 3rd quarter | 68.8 | -0.1 | 8.9 | 69.2 | -1.1 | 8.5 | |||
| 4th quarter | 70.3 | 2.2 | 16.8 | 72.2 | 4.3 | 16.5 | |||
| 2014 | 1st quarter | 70.0 | -0.4 | -4.2 | 69.2 | -4.2 | -4.3 | ||
| 2nd quarter | 76.0 | 8.6 | 10.3 | 75.5 | 9.1 | 7.9 | |||
| 3rd quarter | 87.9 | 15.7 | 27.8 | 86.9 | 15.1 | 25.6 | |||
| 4th quarter | 98.1 | 11.6 | 39.5 | 101.2 | 16.5 | 40.2 | |||
| 2015 | 1st quarter | 97.8 | -0.3 | 39.7 | 95.1 | -6.0 | 37.4 | ||
| 2nd quarter | 113.4 | 16.0 | 49.2 | 110.2 | 15.9 | 46.0 | |||
| 3rd quarter | 113.9 | 0.4 | 29.6 | 111.9 | 1.5 | 28.8 | |||
| 4th quarter | 108.0 | -5.2 | 10.1 | 113.0 | 1.0 | 11.7 | |||
| 2016 | 1st quarter | 137.9 | 27.7 | 41.0 | 131.6 | 16.5 | 38.4 | ||
| 2nd quarter | 151.9 | 10.2 | 34.0 | 146.2 | 11.1 | 32.7 | |||
| 3rd quarter2 | 150.3 | -1.1 | 32.0 | 146.4 | 0.1 | 30.8 | |||
| 1 Based on Seasonal Patterns up to Quarter 3, 2016 | |||||||||
| 2 Provisional | |||||||||
| Table 2(b) Seasonally Adjusted Indices of Production in Non-Residential Building 1 | |||||||||
| Base Year: 2010=100 | |||||||||
| Value of Production | Volume of Production | ||||||||
| Period | Index | % change on previous period | Annual % change | Index | % change on previous period | Annual % change | |||
| 2006 | 169.9 | 12.0 | 183.7 | 6.0 | |||||
| 2007 | 180.1 | 6.0 | 185.6 | 1.0 | |||||
| 2008 | 181.5 | 0.8 | 180.9 | -2.5 | |||||
| 2009 | 140.5 | -22.6 | 142.0 | -21.5 | |||||
| 2010 | 99.6 | -29.1 | 99.7 | -29.8 | |||||
| 2011 | 95.7 | -3.9 | 98.1 | -1.6 | |||||
| 2012 | 86.5 | -9.6 | 88.0 | -10.3 | |||||
| 2013 | 102.2 | 18.1 | 103.2 | 17.2 | |||||
| 2014 | 111.8 | 9.4 | 111.7 | 8.3 | |||||
| 2015 | 117.5 | 5.2 | 116.5 | 4.3 | |||||
| 2006 | 1st quarter | 173.7 | 4.4 | 27.0 | 191.6 | 1.9 | 21.6 | ||
| 2nd quarter | 168.6 | -2.9 | 14.0 | 183.7 | -4.1 | 8.1 | |||
| 3rd quarter | 165.4 | -1.9 | 6.2 | 178.0 | -3.1 | 0.1 | |||
| 4th quarter | 171.9 | 3.9 | 3.3 | 181.5 | 2.0 | -3.5 | |||
| 2007 | 1st quarter | 179.4 | 4.4 | 3.3 | 187.3 | 3.2 | -2.2 | ||
| 2nd quarter | 181.9 | 1.4 | 7.9 | 188.1 | 0.4 | 2.4 | |||
| 3rd quarter | 184.0 | 1.2 | 11.2 | 187.7 | -0.2 | 5.4 | |||
| 4th quarter | 174.9 | -4.9 | 1.7 | 179.1 | -4.6 | -1.3 | |||
| 2008 | 1st quarter | 186.4 | 6.6 | 3.9 | 186.5 | 4.1 | -0.4 | ||
| 2nd quarter | 188.7 | 1.2 | 3.7 | 187.5 | 0.5 | -0.3 | |||
| 3rd quarter | 177.6 | -5.9 | -3.5 | 176.3 | -6.0 | -6.1 | |||
| 4th quarter | 173.2 | -2.5 | -1.0 | 173.1 | -1.8 | -3.4 | |||
| 2009 | 1st quarter | 161.8 | -6.6 | -13.2 | 162.6 | -6.1 | -12.8 | ||
| 2nd quarter | 150.2 | -7.2 | -20.4 | 151.4 | -6.9 | -19.3 | |||
| 3rd quarter | 135.0 | -10.1 | -24.0 | 137.1 | -9.4 | -22.2 | |||
| 4th quarter | 114.9 | -14.9 | -33.7 | 116.7 | -14.9 | -32.6 | |||
| 2010 | 1st quarter | 103.1 | -10.3 | -36.3 | 103.9 | -11.0 | -36.1 | ||
| 2nd quarter | 96.1 | -6.8 | -36.0 | 95.8 | -7.8 | -36.7 | |||
| 3rd quarter | 100.5 | 4.6 | -25.6 | 100.3 | 4.7 | -26.8 | |||
| 4th quarter | 98.7 | -1.8 | -14.1 | 98.6 | -1.7 | -15.5 | |||
| 2011 | 1st quarter | 95.8 | -2.9 | -7.1 | 97.2 | -1.4 | -6.4 | ||
| 2nd quarter | 96.8 | 1.0 | 0.7 | 99.5 | 2.4 | 3.9 | |||
| 3rd quarter | 96.3 | -0.5 | -4.2 | 99.2 | -0.3 | -1.1 | |||
| 4th quarter | 93.8 | -2.6 | -5.0 | 96.3 | -2.9 | -2.3 | |||
| 2012 | 1st quarter | 91.0 | -3.0 | -5.0 | 92.8 | -3.6 | -4.5 | ||
| 2nd quarter | 85.6 | -5.9 | -11.6 | 86.9 | -6.4 | -12.7 | |||
| 3rd quarter | 83.4 | -2.6 | -13.4 | 84.8 | -2.4 | -14.5 | |||
| 4th quarter | 86.0 | 3.1 | -8.3 | 87.4 | 3.1 | -9.2 | |||
| 2013 | 1st quarter | 86.4 | 0.5 | -5.1 | 87.2 | -0.2 | -6.0 | ||
| 2nd quarter | 97.9 | 13.3 | 14.4 | 99.0 | 13.5 | 13.9 | |||
| 3rd quarter | 109.0 | 11.3 | 30.7 | 110.1 | 11.2 | 29.8 | |||
| 4th quarter | 115.4 | 5.9 | 34.2 | 116.3 | 5.6 | 33.1 | |||
| 2014 | 1st quarter | 115.6 | 0.2 | 33.8 | 116.1 | -0.2 | 33.1 | ||
| 2nd quarter | 110.7 | -4.2 | 13.1 | 110.8 | -4.6 | 11.9 | |||
| 3rd quarter | 110.7 | 0.0 | 1.6 | 110.5 | -0.3 | 0.4 | |||
| 4th quarter | 110.0 | -0.6 | -4.7 | 109.4 | -1.0 | -5.9 | |||
| 2015 | 1st quarter | 119.9 | 9.0 | 3.7 | 119.0 | 8.8 | 2.5 | ||
| 2nd quarter | 118.7 | -1.0 | 7.2 | 117.6 | -1.2 | 6.1 | |||
| 3rd quarter | 112.3 | -5.4 | 1.4 | 111.4 | -5.3 | 0.8 | |||
| 4th quarter | 119.2 | 6.1 | 8.4 | 117.9 | 5.8 | 7.8 | |||
| 2016 | 1st quarter | 122.1 | 2.4 | 1.8 | 120.4 | 2.1 | 1.2 | ||
| 2nd quarter | 135.5 | 11.0 | 14.2 | 133.5 | 10.9 | 13.5 | |||
| 3rd quarter2 | 144.6 | 6.7 | 28.8 | 142.4 | 6.7 | 27.8 | |||
| 1 Based on Seasonal Patterns up to Quarter 3, 2016 | |||||||||
| 2 Provisional | |||||||||
The quarterly production in building and construction index provides quarterly statistics on output in the sector. The index monitors trends in the value and the volume of production in building and construction. The primary purpose of the index is to measure changes in value added at constant prices.
The principal difference between the value and volume indices is that the volume index traces the quantitative volume of production (i.e. effect of price changes excluded) each quarter. The Capital Goods price index for Building and Construction was used as the price deflator for this series.
This series is also available using the interactive tables in the CSO’s Statbank on www.cso.ie
The production in building and construction index is carried out on a quarterly basis (i.e. the first quarter covers January, February and March etc.).
The set of indices, based on the Laspeyres Index, has been compiled with reference to base year 2010 = 100. The underlying structural weighting system is based on annual output in the Building and Construction sector as published in "The Irish Construction Industry in 2012" produced by DKM Economic Consultants for the Society of Chartered Surveyors Ireland (SCSI), which presents annual output for reference year 2010.
The Quarterly Survey of Construction (QSC) is carried out in accordance with the Statistics (Quarterly Survey of Construction) Order 2009, Number 73 made under the 1993 Statistics Act. The statistics are also required for EU comparisons under Council Regulation (EC) No. 1165/98 which has been amended by Regulation (EC) No. 1893/2006 with the introduction of NACE Rev. 2.
The production in building and construction index covers, on a sample basis, the production of all firms in the private (i.e. non-State) sector whose main activity is building, construction or civil engineering i.e. firms classified to division F of the Statistical Classification of Economic Activities in the European Community (NACE Rev. 2). Approximately 2,400 firms are surveyed each quarter.
Seasonal Adjustment is conducted using the direct seasonal adjustment approach. Under this approach, each individual series is independently adjusted. Each individual seasonally adjusted series is calculated based on working day adjusted data.
The adjustments are completed by applying the X-12-ARIMA model, developed by the U.S. Census Bureau to the working day adjusted data. This methodology estimates seasonal factors while also taking into consideration factors that impact on the quality of the seasonal adjustment such as outliers and level shifts in the series.
For additional information on the use of X-12-Arima see (Findley, D.F., B.C. Monsell, W.R. Bell, M.C Otto, and B. Chen (1998), “New Capabilities and Methods of the X-12-Arima Seasonal Adjustment Program”, Journal of Business & Economic Statistics, 16, pp. 127-177.) and www.census.gov/srd/www/x12a/ .
A detailed description of the methodology is available within the Surveys and Methodology area on the CSO website at:
http://www.cso.ie/en/surveysandmethodology/construction/quarterlysurveyofconstruction/
There are differences (due to timing, definitions and other factors) between the quarterly and annual trends measured by this survey and by other national data sources. In particular the quarterly series from the QSC show considerable volatility. Table A, below, compares the main annual results of the survey with national employment and house building indicators.
The series shows an increase of 8.3% in the annual volume of production in building and construction, between 2014 and 2015. In the same period, employment in the sector, as measured by the QNHS, rose by 18.4%.
For residential buildings, the QSC shows an increase of 29.3% in the annual volume of production between 2014 and 2015. The house completions series shows an increase of 15.0% in the same period.
Data on house-building commencements, a relatively new leading indicator, are also included in Table A. This indicator shows an increase of 4.8% in residential building in 2015 when compared with 2014.
| Table A: Comparison of Building and Construction sector indicators | |||||||
| CSO Series | Other Indicators | ||||||
| Seasonally Adjusted Volume of production in building and construction3 |
Seasonally Adjusted Volume of production in civil engineering |
Seasonally Adjusted Volume of production in residential building3 | Persons Employed in the Construction Sector1 | House Completions2 | House Commencements2 | ||
| Index | Index | Index | No. | No. | No. | ||
| 2010=100 | 2010=100 | 2010=100 | |||||
| 2006 | 365.9 | 151.5 | 877.2 | 251,700 | 88,187 | 75,602 | |
| 2007 | 316.3 | 158.3 | 692.9 | 273,900 | 78,027 | 48,876 | |
| 2008 | 225.4 | 148.5 | 383.9 | 246,100 | 51,724 | 22,852 | |
| 2009 | 144.0 | 129.4 | 161.2 | 158,200 | 26,420 | 8,599 | |
| 2010 | 100.0 | 99.7 | 100.4 | 126,500 | 14,602 | 6,391 | |
| 2011 | 83.6 | 77.0 | 73.2 | 106,400 | 10,480 | 4,365 | |
| 2012 | 80.1 | 89.8 | 64.2 | 99,600 | 8,488 | 4,042 | |
| 2013 | 89.5 | 94.0 | 70.9 | 102,700 | 8,301 | 4,708 | |
|
20144 |
98.3 | 96.9 | 83.2 | 106,300 | 11,016 | 7,717 | |
| 2015 | 106.4 | 92.8 | 107.6 | 125,900 | 12,666 | 8,088 | |
| 1 Quarterly National Household Survey, April - June quarter, NACE Rev. 2. | |||||||
| 2 Source Department of Housing, Planning, Community and Local Government. | |||||||
| 3 Seasonally Adjusted series introduced in Q1 2010. | |||||||
|
4 In 2014 there was a change in the methodology for the Housing data collated by the DHPCLG. Previously the data was collated from 37 Building Control Areas by the DHPCLG. This was updated in 2014 with the data now being drawn from a database held by the Local Government Management Agency updated directly by developers\builders on line or by the local authority. |
|||||||
 Hide Background Notes
Scan the QR code below to view this release online or go to
http://www.cso.ie/en/releasesandpublications/er/pbci/productioninbuildingandconstructionindexquarter32016/
 Show Table 1(a) Seasonally Adjusted Indices of Production in all Building and Construction
 Hide Table 1(a) Seasonally Adjusted Indices of Production in all Building and Construction