
No link available
| Seasonally Adjusted Production in Building and Construction Index | |||
| (Base: Year 2015=100) | |||
| Volume Index | Value Index | ||
| Q2 2018 | 143.4 | 150.5 | |
| Q1 2019 | 155.3 | 168.5 | |
| Q2 2019 | 159.6 | 171.0 | |
| Quarterly % change | 2.8% | 1.5% | |
| Annual % change | 11.3% | 13.6% | |
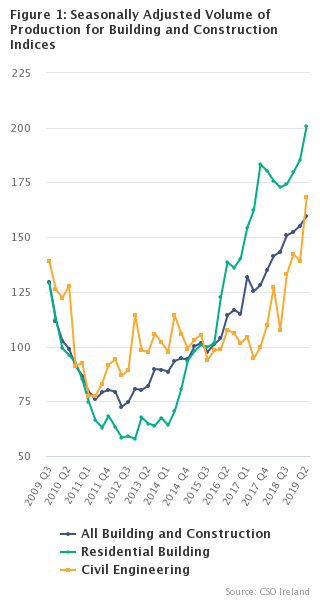
Overall construction activity has increased by 2.8% in Quarter 2 2019 but Civil Engineering has seen the largest increase with a rise of 21.0% in the seasonally adjusted volume index. Residential Building is also up on the previous quarter with an increase of 8.3% in volume while Non-Residential Building activity is down 3.1% in the seasonally adjusted index.
Output in the Residential sector has doubled since 2015 with the Residential index over 200 for the first time since 2008. However, it is still significantly lower than its peak of 854.4 in Quarter 1 2006.
The year on year change for Civil Engineering is even more significant with a volume increase of 56.4% compared with the same period last year. Residential Building activity is up 16.2% year on year and Non-Residential activity has increased by 1.8% since the second quarter of 2018.
In the last quarter, the Non-Residential seasonally adjusted volume index has decreased from 153.6 to 148.9. Further information on seasonal adjustment is available in the CSO’s video on seasonal adjustment. See tables 1(a), 1(c), 2(a), 2(b) and graphs.
| X-axis label | Q2 2018 | Q3 2018 | Q4 2018 | Q1 2019 | Q2 2019 |
|---|---|---|---|---|---|
| All Building and Construction | 143.4 | 150.8 | 152.4 | 155.3 | 159.6 |
| Building (excluding Civil Engineering) | 149.6 | 154.1 | 155.7 | 159.7 | 156.2 |
| Residential Building | 172.8 | 174.2 | 179.7 | 185.4 | 200.8 |
| Non-Residential Building | 146.3 | 152.2 | 152.8 | 153.6 | 148.9 |
| Civil Engineering | 107.6 | 133.1 | 142.2 | 139.1 | 168.3 |
| Table 1(a) Seasonally Adjusted Indices of Production in all Building and Construction1 | ||||||||
| Base Year: 2015=100 | ||||||||
| Value of Production | Volume of Production | |||||||
| Period | Index | % change on previous period | Annual % change | Index | % change on previous period | Annual % change | ||
| 2006 | 318.9 | 9.9 | 348.0 | 3.9 | ||||
| 2007 | 289.6 | -9.2 | 301.9 | -13.2 | ||||
| 2008 | 212.9 | -26.5 | 214.6 | -28.9 | ||||
| 2009 | 132.7 | -37.7 | 135.5 | -36.8 | ||||
| 2010 | 93.9 | -29.2 | 94.9 | -30.0 | ||||
| 2011 | 76.0 | -19.1 | 78.7 | -17.1 | ||||
| 2012 | 74.9 | -1.5 | 76.9 | -2.3 | ||||
| 2013 | 83.8 | 12.0 | 85.4 | 11.1 | ||||
| 2014 | 91.9 | 9.6 | 92.7 | 8.6 | ||||
| 2015 | 100.1 | 9.0 | 100.1 | 8.0 | ||||
| 2016 | 113.2 | 13.0 | 112.4 | 12.3 | ||||
| 2017 | 133.2 | 17.7 | 130.0 | 15.7 | ||||
| 2018 | 155.0 | 16.3 | 147.0 | 13.0 | ||||
| 2006 | 1st quarter | 320.2 | 6.1 | 19.4 | 361.6 | 6.0 | 14.2 | |
| 2nd quarter | 309.6 | -3.3 | 5.7 | 342.7 | -5.2 | 0.0 | ||
| 3rd quarter | 305.1 | -1.5 | 2.3 | 330.2 | -3.6 | -2.6 | ||
| 4th quarter | 340.7 | 11.7 | 12.9 | 357.4 | 8.2 | 4.8 | ||
| 2007 | 1st quarter | 302.7 | -11.2 | -5.5 | 323.2 | -9.6 | -10.6 | |
| 2nd quarter | 305.0 | 0.8 | -1.5 | 320.3 | -0.9 | -6.5 | ||
| 3rd quarter | 278.6 | -8.7 | -8.7 | 287.1 | -10.4 | -13.1 | ||
| 4th quarter | 272.1 | -2.3 | -20.1 | 277.0 | -3.5 | -22.5 | ||
| 2008 | 1st quarter | 246.2 | -9.5 | -18.7 | 250.9 | -9.4 | -22.4 | |
| 2nd quarter | 227.1 | -7.8 | -25.5 | 228.6 | -8.9 | -28.6 | ||
| 3rd quarter | 202.7 | -10.7 | -27.2 | 203.6 | -10.9 | -29.1 | ||
| 4th quarter | 175.5 | -13.4 | -35.5 | 175.3 | -13.9 | -36.7 | ||
| 2009 | 1st quarter | 157.7 | -10.1 | -35.9 | 160.5 | -8.4 | -36.0 | |
| 2nd quarter | 137.4 | -12.9 | -39.5 | 140.4 | -12.5 | -38.6 | ||
| 3rd quarter | 126.1 | -8.2 | -37.8 | 129.4 | -7.8 | -36.4 | ||
| 4th quarter | 109.4 | -13.2 | -37.7 | 111.8 | -13.6 | -36.2 | ||
| 2010 | 1st quarter | 101.0 | -7.7 | -36.0 | 102.6 | -8.2 | -36.1 | |
| 2nd quarter | 98.0 | -3.0 | -28.7 | 99.0 | -3.5 | -29.5 | ||
| 3rd quarter | 90.5 | -7.7 | -28.2 | 91.1 | -8.0 | -29.6 | ||
| 4th quarter | 86.1 | -4.9 | -21.3 | 86.7 | -4.8 | -22.5 | ||
| 2011 | 1st quarter | 77.5 | -10.0 | -23.3 | 79.4 | -8.4 | -22.6 | |
| 2nd quarter | 73.0 | -5.8 | -25.5 | 75.9 | -4.4 | -23.3 | ||
| 3rd quarter | 76.1 | 4.2 | -15.9 | 79.1 | 4.2 | -13.2 | ||
| 4th quarter | 77.4 | 1.7 | -10.1 | 80.2 | 1.4 | -7.5 | ||
| 2012 | 1st quarter | 77.1 | -0.4 | -0.5 | 79.4 | -1.0 | 0.0 | |
| 2nd quarter | 70.8 | -8.2 | -3.0 | 72.5 | -8.7 | -4.5 | ||
| 3rd quarter | 72.8 | 2.8 | -4.3 | 74.8 | 3.2 | -5.4 | ||
| 4th quarter | 78.7 | 8.1 | 1.7 | 80.7 | 7.9 | 0.6 | ||
| 2013 | 1st quarter | 78.8 | 0.1 | 2.2 | 80.2 | -0.6 | 1.0 | |
| 2nd quarter | 80.6 | 2.3 | 13.8 | 82.1 | 2.4 | 13.2 | ||
| 3rd quarter | 87.7 | 8.8 | 20.5 | 89.7 | 9.3 | 19.9 | ||
| 4th quarter | 88.1 | 0.5 | 11.9 | 89.5 | -0.2 | 10.9 | ||
| 2014 | 1st quarter | 87.5 | -0.7 | 11.0 | 88.6 | -1.0 | 10.5 | |
| 2nd quarter | 92.4 | 5.6 | 14.6 | 93.4 | 5.4 | 13.8 | ||
| 3rd quarter | 93.5 | 1.2 | 6.6 | 94.6 | 1.3 | 5.5 | ||
| 4th quarter | 94.0 | 0.5 | 6.7 | 94.1 | -0.5 | 5.1 | ||
| 2015 | 1st quarter | 100.3 | 6.7 | 14.6 | 100.1 | 6.4 | 13.0 | |
| 2nd quarter | 101.3 | 1.0 | 9.6 | 101.6 | 1.5 | 8.8 | ||
| 3rd quarter | 97.0 | -4.2 | 3.7 | 97.6 | -3.9 | 3.2 | ||
| 4th quarter | 101.9 | 5.1 | 8.4 | 101.1 | 3.6 | 7.4 | ||
| 2016 | 1st quarter | 104.8 | 2.8 | 4.5 | 103.7 | 2.6 | 3.6 | |
| 2nd quarter | 114.1 | 8.9 | 12.6 | 114.2 | 10.1 | 12.4 | ||
| 3rd quarter | 116.7 | 2.3 | 20.3 | 116.8 | 2.3 | 19.7 | ||
| 4th quarter | 117.1 | 0.3 | 14.9 | 114.9 | -1.6 | 13.6 | ||
| 2017 | 1st quarter | 135.4 | 15.6 | 29.2 | 131.8 | 14.7 | 27.1 | |
| 2nd quarter | 127.3 | -6.0 | 11.6 | 125.3 | -4.9 | 9.7 | ||
| 3rd quarter | 130.3 | 2.4 | 11.7 | 128.1 | 2.2 | 9.7 | ||
| 4th quarter | 139.8 | 7.3 | 19.4 | 134.9 | 5.3 | 17.4 | ||
| 2018 | 1st quarter | 146.9 | 5.1 | 8.5 | 141.3 | 4.7 | 7.2 | |
| 2nd quarter | 150.5 | 2.5 | 18.2 | 143.4 | 1.5 | 14.4 | ||
| 3rd quarter | 159.3 | 5.8 | 22.3 | 150.8 | 5.2 | 17.7 | ||
| 4th quarter | 163.2 | 2.4 | 16.7 | 152.4 | 1.1 | 13.0 | ||
| 2019 | 1st quarter | 168.5 | 3.2 | 14.7 | 155.3 | 1.9 | 9.9 | |
| 2nd quarter2 | 171.0 | 1.5 | 13.6 | 159.6 | 2.8 | 11.3 | ||
| 1Based on Seasonal Patterns up to Quarter 2, 2019 | ||||||||
| 2Provisional | ||||||||
| Table 1(b) Seasonally Adjusted Indices of Production in Building (Excluding Civil Engineering)1 | ||||||||
| Base Year: 2015=100 | ||||||||
| Value of Production | Volume of Production | |||||||
| Period | Index | % change on previous period | Annual % change | Index | % change on previous period | Annual % change | ||
| 2006 | 395.7 | 8.4 | 432.2 | 2.5 | ||||
| 2007 | 347.2 | -12.3 | 361.1 | -16.4 | ||||
| 2008 | 238.1 | -31.4 | 239.3 | -33.7 | ||||
| 2009 | 131.4 | -44.8 | 133.9 | -44.0 | ||||
| 2010 | 88.2 | -32.8 | 89.1 | -33.5 | ||||
| 2011 | 74.5 | -15.6 | 77.1 | -13.5 | ||||
| 2012 | 66.8 | -10.4 | 68.5 | -11.1 | ||||
| 2013 | 77.1 | 15.5 | 78.6 | 14.7 | ||||
| 2014 | 86.8 | 12.6 | 87.5 | 11.4 | ||||
| 2015 | 100.0 | 15.3 | 100.0 | 14.3 | ||||
| 2016 | 115.2 | 15.1 | 114.4 | 14.3 | ||||
| 2017 | 139.4 | 21.0 | 136.2 | 19.1 | ||||
| 2018 | 159.5 | 14.5 | 151.3 | 11.1 | ||||
| 2006 | 1st quarter | 400.5 | 7.5 | 16.8 | 446.7 | 4.5 | 11.4 | |
| 2nd quarter | 386.7 | -3.4 | 3.9 | 422.3 | -5.5 | -1.3 | ||
| 3rd quarter | 380.1 | -1.7 | 1.8 | 412.0 | -2.4 | -4.3 | ||
| 4th quarter | 415.5 | 9.3 | 11.6 | 447.6 | 8.6 | 4.7 | ||
| 2007 | 1st quarter | 366.6 | -11.8 | -8.5 | 385.7 | -13.8 | -13.7 | |
| 2nd quarter | 372.7 | 1.7 | -3.6 | 386.8 | 0.3 | -8.4 | ||
| 3rd quarter | 333.1 | -10.6 | -12.4 | 342.2 | -11.5 | -16.9 | ||
| 4th quarter | 316.5 | -5.0 | -23.8 | 329.8 | -3.6 | -26.3 | ||
| 2008 | 1st quarter | 284.6 | -10.1 | -22.4 | 287.3 | -12.9 | -25.5 | |
| 2nd quarter | 258.3 | -9.2 | -30.7 | 257.7 | -10.3 | -33.4 | ||
| 3rd quarter | 222.1 | -14.0 | -33.3 | 222.5 | -13.7 | -35.0 | ||
| 4th quarter | 187.4 | -15.6 | -40.8 | 189.7 | -14.7 | -42.5 | ||
| 2009 | 1st quarter | 163.3 | -12.9 | -42.6 | 165.6 | -12.7 | -42.4 | |
| 2nd quarter | 139.4 | -14.6 | -46.0 | 141.4 | -14.6 | -45.1 | ||
| 3rd quarter | 119.6 | -14.2 | -46.2 | 123.0 | -13.0 | -44.7 | ||
| 4th quarter | 103.1 | -13.8 | -45.0 | 105.7 | -14.1 | -44.3 | ||
| 2010 | 1st quarter | 92.6 | -10.2 | -43.3 | 94.0 | -11.1 | -43.2 | |
| 2nd quarter | 87.8 | -5.2 | -37.0 | 88.3 | -6.1 | -37.6 | ||
| 3rd quarter | 88.5 | 0.8 | -26.0 | 89.5 | 1.4 | -27.2 | ||
| 4th quarter | 84.0 | -5.1 | -18.5 | 84.6 | -5.5 | -20.0 | ||
| 2011 | 1st quarter | 77.8 | -7.4 | -16.0 | 79.6 | -5.9 | -15.3 | |
| 2nd quarter | 74.0 | -4.9 | -15.7 | 76.7 | -3.6 | -13.1 | ||
| 3rd quarter | 72.7 | -1.8 | -17.9 | 75.9 | -1.0 | -15.2 | ||
| 4th quarter | 73.4 | 1.0 | -12.6 | 76.0 | 0.1 | -10.2 | ||
| 2012 | 1st quarter | 70.4 | -4.1 | -9.5 | 72.4 | -4.7 | -9.0 | |
| 2nd quarter | 65.8 | -6.5 | -11.1 | 67.4 | -6.9 | -12.1 | ||
| 3rd quarter | 65.2 | -0.9 | -10.3 | 67.0 | -0.6 | -11.7 | ||
| 4th quarter | 65.6 | 0.6 | -10.6 | 67.2 | 0.3 | -11.6 | ||
| 2013 | 1st quarter | 70.3 | 7.2 | -0.1 | 71.7 | 6.7 | -1.0 | |
| 2nd quarter | 74.8 | 6.4 | 13.7 | 76.2 | 6.3 | 13.1 | ||
| 3rd quarter | 79.7 | 6.6 | 22.2 | 81.2 | 6.6 | 21.2 | ||
| 4th quarter | 83.5 | 4.8 | 27.3 | 85.1 | 4.8 | 26.6 | ||
| 2014 | 1st quarter | 82.9 | -0.7 | 17.9 | 84.3 | -0.9 | 17.6 | |
| 2nd quarter | 83.6 | 0.8 | 11.8 | 84.3 | 0.0 | 10.6 | ||
| 3rd quarter | 88.3 | 5.6 | 10.8 | 88.4 | 4.9 | 8.9 | ||
| 4th quarter | 92.2 | 4.4 | 10.4 | 92.9 | 5.1 | 9.2 | ||
| 2015 | 1st quarter | 98.2 | 6.5 | 18.5 | 98.8 | 6.4 | 17.2 | |
| 2nd quarter | 101.3 | 3.2 | 21.2 | 100.9 | 2.1 | 19.7 | ||
| 3rd quarter | 98.4 | -2.9 | 11.4 | 97.8 | -3.1 | 10.6 | ||
| 4th quarter | 102.2 | 3.9 | 10.8 | 102.6 | 4.9 | 10.4 | ||
| 2016 | 1st quarter | 105.0 | 2.7 | 6.9 | 105.2 | 2.5 | 6.5 | |
| 2nd quarter | 115.9 | 10.4 | 14.4 | 114.7 | 9.0 | 13.7 | ||
| 3rd quarter | 120.1 | 3.6 | 22.1 | 118.5 | 3.3 | 21.2 | ||
| 4th quarter | 119.6 | -0.4 | 17.0 | 119.0 | 0.4 | 16.0 | ||
| 2017 | 1st quarter | 140.3 | 17.3 | 33.6 | 138.7 | 16.6 | 31.8 | |
| 2nd quarter | 134.5 | -4.1 | 16.0 | 130.6 | -5.8 | 13.9 | ||
| 3rd quarter | 137.7 | 2.4 | 14.7 | 133.7 | 2.4 | 12.8 | ||
| 4th quarter | 144.9 | 5.2 | 21.2 | 141.7 | 6.0 | 19.1 | ||
| 2018 | 1st quarter | 149.5 | 3.2 | 6.6 | 145.7 | 2.8 | 5.0 | |
| 2nd quarter | 159.0 | 6.4 | 18.2 | 149.6 | 2.7 | 14.5 | ||
| 3rd quarter | 164.6 | 3.5 | 19.5 | 154.1 | 3.0 | 15.3 | ||
| 4th quarter | 164.9 | 0.2 | 13.8 | 155.7 | 1.0 | 9.9 | ||
| 2019 | 1st quarter | 171.5 | 4.0 | 14.7 | 159.7 | 2.6 | 9.6 | |
| 2nd quarter2 | 169.1 | -1.4 | 6.4 | 156.2 | -2.2 | 4.4 | ||
| 1Based on Seasonal Patterns up to Quarter 2, 2019 | ||||||||
| 2Provisional | ||||||||
| Table 1(c) Seasonally Adjusted Indices of Production in Civil Engineering 1 | ||||||||
| Base Year: 2015=100 | ||||||||
| Value of Production | Volume of Production | |||||||
| Period | Index | % change on previous period | Annual % change | Index | % change on previous period | Annual % change | ||
| 2006 | 149.3 | 19.2 | 163.0 | 12.7 | ||||
| 2007 | 163.7 | 9.7 | 170.4 | 4.5 | ||||
| 2008 | 159.0 | -2.9 | 160.1 | -6.0 | ||||
| 2009 | 136.7 | -14.0 | 139.6 | -12.8 | ||||
| 2010 | 107.4 | -21.5 | 108.4 | -22.3 | ||||
| 2011 | 79.7 | -25.8 | 82.5 | -23.9 | ||||
| 2012 | 93.7 | 17.5 | 96.2 | 16.6 | ||||
| 2013 | 99.2 | 6.0 | 100.9 | 4.9 | ||||
| 2014 | 103.5 | 4.3 | 104.2 | 3.2 | ||||
| 2015 | 100.3 | -3.0 | 100.2 | -3.8 | ||||
| 2016 | 104.2 | 3.9 | 103.5 | 3.3 | ||||
| 2017 | 104.6 | 0.4 | 102.2 | -1.3 | ||||
| 2018 | 134.4 | 28.4 | 127.5 | 24.8 | ||||
| 2006 | 1st quarter | 146.1 | 5.1 | 37.8 | 163.9 | 3.2 | 31.3 | |
| 2nd quarter | 142.9 | -2.2 | 22.1 | 155.9 | -4.9 | 16.1 | ||
| 3rd quarter | 146.6 | 2.6 | 5.4 | 159.6 | 2.4 | -0.4 | ||
| 4th quarter | 161.6 | 10.2 | 16.3 | 172.4 | 8.0 | 8.6 | ||
| 2007 | 1st quarter | 166.1 | 2.8 | 13.7 | 175.6 | 1.9 | 7.1 | |
| 2nd quarter | 165.9 | -0.1 | 16.1 | 172.6 | -1.7 | 10.7 | ||
| 3rd quarter | 160.1 | -3.5 | 9.2 | 164.9 | -4.5 | 3.3 | ||
| 4th quarter | 162.8 | 1.7 | 0.7 | 168.3 | 2.1 | -2.4 | ||
| 2008 | 1st quarter | 164.4 | 1.0 | -1.0 | 166.5 | -1.1 | -5.2 | |
| 2nd quarter | 170.1 | 3.5 | 2.5 | 170.3 | 2.3 | -1.3 | ||
| 3rd quarter | 157.2 | -7.6 | -1.8 | 157.2 | -7.7 | -4.7 | ||
| 4th quarter | 144.2 | -8.3 | -11.4 | 146.2 | -7.0 | -13.1 | ||
| 2009 | 1st quarter | 147.0 | 1.9 | -10.6 | 148.8 | 1.8 | -10.6 | |
| 2nd quarter | 141.8 | -3.5 | -16.6 | 144.2 | -3.1 | -15.3 | ||
| 3rd quarter | 136.3 | -3.9 | -13.3 | 139.1 | -3.5 | -11.5 | ||
| 4th quarter | 121.7 | -10.7 | -15.6 | 126.2 | -9.3 | -13.7 | ||
| 2010 | 1st quarter | 121.2 | -0.4 | -17.6 | 122.3 | -3.1 | -17.8 | |
| 2nd quarter | 127.2 | 5.0 | -10.3 | 127.8 | 4.5 | -11.4 | ||
| 3rd quarter | 91.0 | -28.5 | -33.2 | 91.0 | -28.8 | -34.6 | ||
| 4th quarter | 90.1 | -1.0 | -26.0 | 92.6 | 1.8 | -26.6 | ||
| 2011 | 1st quarter | 76.8 | -14.8 | -36.6 | 77.6 | -16.2 | -36.5 | |
| 2nd quarter | 74.7 | -2.7 | -41.3 | 77.5 | -0.1 | -39.4 | ||
| 3rd quarter | 80.5 | 7.8 | -11.5 | 83.1 | 7.2 | -8.7 | ||
| 4th quarter | 86.8 | 7.8 | -3.7 | 91.8 | 10.5 | -0.9 | ||
| 2012 | 1st quarter | 92.8 | 6.9 | 20.8 | 94.1 | 2.5 | 21.3 | |
| 2nd quarter | 84.7 | -8.7 | 13.4 | 86.8 | -7.8 | 12.0 | ||
| 3rd quarter | 87.7 | 3.5 | 8.9 | 89.4 | 3.0 | 7.6 | ||
| 4th quarter | 109.4 | 24.7 | 26.0 | 114.4 | 28.0 | 24.6 | ||
| 2013 | 1st quarter | 98.2 | -10.2 | 5.8 | 98.3 | -14.1 | 4.5 | |
| 2nd quarter | 95.4 | -2.9 | 12.6 | 97.5 | -0.8 | 12.3 | ||
| 3rd quarter | 104.4 | 9.4 | 19.0 | 105.9 | 8.6 | 18.5 | ||
| 4th quarter | 98.9 | -5.3 | -9.6 | 102.0 | -3.7 | -10.8 | ||
| 2014 | 1st quarter | 97.5 | -1.4 | -0.7 | 97.5 | -4.4 | -0.8 | |
| 2nd quarter | 112.8 | 15.7 | 18.2 | 114.3 | 17.2 | 17.2 | ||
| 3rd quarter | 105.5 | -6.5 | 1.1 | 105.9 | -7.3 | 0.0 | ||
| 4th quarter | 98.0 | -7.1 | -0.9 | 99.1 | -6.4 | -2.8 | ||
| 2015 | 1st quarter | 103.8 | 5.9 | 6.5 | 103.2 | 4.1 | 5.8 | |
| 2nd quarter | 105.0 | 1.2 | -6.9 | 105.4 | 2.1 | -7.8 | ||
| 3rd quarter | 94.1 | -10.4 | -10.8 | 93.9 | -10.9 | -11.3 | ||
| 4th quarter | 98.4 | 4.6 | 0.4 | 98.3 | 4.7 | -0.8 | ||
| 2016 | 1st quarter | 99.4 | 1.0 | -4.2 | 98.7 | 0.4 | -4.4 | |
| 2nd quarter | 108.0 | 8.7 | 2.9 | 107.7 | 9.1 | 2.2 | ||
| 3rd quarter | 106.7 | -1.2 | 13.4 | 106.0 | -1.6 | 12.9 | ||
| 4th quarter | 102.8 | -3.7 | 4.5 | 101.5 | -4.2 | 3.3 | ||
| 2017 | 1st quarter | 106.5 | 3.6 | 7.1 | 104.4 | 2.9 | 5.8 | |
| 2nd quarter | 96.7 | -9.2 | -10.5 | 94.6 | -9.4 | -12.2 | ||
| 3rd quarter | 102.2 | 5.7 | -4.2 | 99.9 | 5.6 | -5.8 | ||
| 4th quarter | 113.0 | 10.6 | 9.9 | 109.8 | 9.9 | 8.2 | ||
| 2018 | 1st quarter | 131.3 | 16.2 | 23.3 | 127.0 | 15.7 | 21.6 | |
| 2nd quarter | 114.0 | -13.2 | 17.9 | 107.6 | -15.3 | 13.7 | ||
| 3rd quarter | 141.0 | 23.7 | 38.0 | 133.1 | 23.7 | 33.2 | ||
| 4th quarter | 151.1 | 7.2 | 33.7 | 142.2 | 6.8 | 29.5 | ||
| 2019 | 1st quarter | 150.6 | -0.3 | 14.7 | 139.1 | -2.2 | 9.5 | |
| 2nd quarter2 | 181.9 | 20.8 | 59.6 | 168.3 | 21.0 | 56.4 | ||
| 1Based on Seasonal Patterns up to Quarter 2, 2019 | ||||||||
| 2Provisional | ||||||||
| Table 2(a) Seasonally Adjusted Indices of Production in Residential Building 1 | ||||||||
| Base Year: 2015=100 | ||||||||
| Value of Production | Volume of Production | |||||||
| Period | Index | % change on previous period | Annual % change | Index | % change on previous period | Annual % change | ||
| 2006 | 749.8 | 7.6 | 818.5 | 1.7 | ||||
| 2007 | 619.4 | -17.4 | 645.5 | -21.1 | ||||
| 2008 | 354.1 | -42.8 | 357.0 | -44.7 | ||||
| 2009 | 146.8 | -58.6 | 150.0 | -58.0 | ||||
| 2010 | 92.3 | -37.1 | 93.3 | -37.8 | ||||
| 2011 | 65.8 | -28.7 | 68.1 | -27.0 | ||||
| 2012 | 58.1 | -11.7 | 59.7 | -12.4 | ||||
| 2013 | 64.7 | 11.5 | 66.0 | 10.6 | ||||
| 2014 | 76.6 | 18.3 | 77.2 | 17.0 | ||||
| 2015 | 100.1 | 30.7 | 100.1 | 29.6 | ||||
| 2016 | 135.3 | 35.2 | 134.3 | 34.3 | ||||
| 2017 | 174.2 | 28.7 | 170.1 | 26.6 | ||||
| 2018 | 185.2 | 6.3 | 175.6 | 3.3 | ||||
| 2006 | 1st quarter | 755.4 | 9.8 | 14.2 | 854.4 | 9.4 | 8.9 | |
| 2nd quarter | 729.0 | -3.5 | 0.8 | 800.7 | -6.3 | -4.1 | ||
| 3rd quarter | 722.1 | -0.9 | 1.0 | 778.6 | -2.8 | -4.9 | ||
| 4th quarter | 792.5 | 9.7 | 15.2 | 840.4 | 7.9 | 7.6 | ||
| 2007 | 1st quarter | 661.2 | -16.6 | -12.5 | 706.0 | -16.0 | -17.4 | |
| 2nd quarter | 674.7 | 2.0 | -7.4 | 707.1 | 0.2 | -11.7 | ||
| 3rd quarter | 588.7 | -12.7 | -18.5 | 599.7 | -15.2 | -23.0 | ||
| 4th quarter | 552.9 | -6.1 | -30.2 | 569.1 | -5.1 | -32.3 | ||
| 2008 | 1st quarter | 454.3 | -17.8 | -31.3 | 464.0 | -18.5 | -34.3 | |
| 2nd quarter | 391.9 | -13.7 | -41.9 | 395.9 | -14.7 | -44.0 | ||
| 3rd quarter | 327.6 | -16.4 | -44.4 | 324.1 | -18.1 | -46.0 | ||
| 4th quarter | 242.6 | -25.9 | -56.1 | 243.9 | -24.7 | -57.1 | ||
| 2009 | 1st quarter | 194.6 | -19.8 | -57.2 | 199.1 | -18.4 | -57.1 | |
| 2nd quarter | 154.7 | -20.5 | -60.5 | 158.9 | -20.2 | -59.9 | ||
| 3rd quarter | 127.5 | -17.6 | -61.1 | 129.1 | -18.8 | -60.2 | ||
| 4th quarter | 110.2 | -13.6 | -54.6 | 112.8 | -12.6 | -53.8 | ||
| 2010 | 1st quarter | 97.2 | -11.8 | -50.1 | 99.2 | -12.1 | -50.2 | |
| 2nd quarter | 94.4 | -2.9 | -39.0 | 96.1 | -3.1 | -39.5 | ||
| 3rd quarter | 93.1 | -1.4 | -27.0 | 92.7 | -3.5 | -28.2 | ||
| 4th quarter | 84.3 | -9.5 | -23.5 | 85.0 | -8.3 | -24.6 | ||
| 2011 | 1st quarter | 72.8 | -13.6 | -25.1 | 74.7 | -12.1 | -24.7 | |
| 2nd quarter | 63.1 | -13.3 | -33.2 | 66.3 | -11.2 | -31.0 | ||
| 3rd quarter | 61.2 | -3.0 | -34.3 | 63.0 | -5.0 | -32.0 | ||
| 4th quarter | 65.9 | 7.7 | -21.8 | 68.3 | 8.4 | -19.6 | ||
| 2012 | 1st quarter | 61.6 | -6.5 | -15.4 | 63.3 | -7.3 | -15.3 | |
| 2nd quarter | 56.4 | -8.4 | -10.6 | 58.4 | -7.7 | -11.9 | ||
| 3rd quarter | 57.9 | 2.7 | -5.4 | 59.0 | 1.0 | -6.3 | ||
| 4th quarter | 56.4 | -2.6 | -14.4 | 57.9 | -1.9 | -15.2 | ||
| 2013 | 1st quarter | 66.6 | 18.1 | 8.1 | 67.7 | 16.9 | 7.0 | |
| 2nd quarter | 63.2 | -5.1 | 12.1 | 64.8 | -4.3 | 11.0 | ||
| 3rd quarter | 62.9 | -0.5 | 8.6 | 63.9 | -1.4 | 8.3 | ||
| 4th quarter | 66.2 | 5.2 | 17.4 | 67.5 | 5.6 | 16.6 | ||
| 2014 | 1st quarter | 63.4 | -4.2 | -4.8 | 64.1 | -5.0 | -5.3 | |
| 2nd quarter | 70.0 | 10.4 | 10.8 | 70.5 | 10.0 | 8.8 | ||
| 3rd quarter | 80.0 | 14.3 | 27.2 | 80.6 | 14.3 | 26.1 | ||
| 4th quarter | 92.9 | 16.1 | 40.3 | 93.6 | 16.1 | 38.7 | ||
| 2015 | 1st quarter | 97.7 | 5.2 | 54.1 | 97.9 | 4.6 | 52.7 | |
| 2nd quarter | 101.5 | 3.9 | 45.0 | 100.8 | 3.0 | 43.0 | ||
| 3rd quarter | 99.6 | -1.9 | 24.5 | 99.9 | -0.9 | 23.9 | ||
| 4th quarter | 101.4 | 1.8 | 9.1 | 101.6 | 1.7 | 8.5 | ||
| 2016 | 1st quarter | 122.9 | 21.2 | 25.8 | 122.5 | 20.6 | 25.1 | |
| 2nd quarter | 140.1 | 14.0 | 38.0 | 138.5 | 13.1 | 37.4 | ||
| 3rd quarter | 136.6 | -2.5 | 37.1 | 136.1 | -1.7 | 36.2 | ||
| 4th quarter | 141.6 | 3.7 | 39.6 | 140.2 | 3.0 | 38.0 | ||
| 2017 | 1st quarter | 157.4 | 11.2 | 28.1 | 154.4 | 10.1 | 26.0 | |
| 2nd quarter | 166.3 | 5.7 | 18.7 | 162.3 | 5.1 | 17.2 | ||
| 3rd quarter | 187.5 | 12.7 | 37.3 | 183.3 | 12.9 | 34.7 | ||
| 4th quarter | 185.4 | -1.1 | 30.9 | 180.3 | -1.6 | 28.6 | ||
| 2018 | 1st quarter | 181.5 | -2.1 | 15.3 | 175.8 | -2.5 | 13.9 | |
| 2nd quarter | 182.8 | 0.7 | 9.9 | 172.8 | -1.7 | 6.5 | ||
| 3rd quarter | 185.0 | 1.2 | -1.3 | 174.2 | 0.8 | -5.0 | ||
| 4th quarter | 191.3 | 3.4 | 3.2 | 179.7 | 3.2 | -0.3 | ||
| 2019 | 1st quarter | 200.0 | 4.5 | 10.2 | 185.4 | 3.2 | 5.5 | |
| 2nd quarter2 | 216.7 | 8.3 | 18.5 | 200.8 | 8.3 | 16.2 | ||
| 1 Based on Seasonal Patterns up to Quarter 2, 2019 | ||||||||
| 2 Provisional | ||||||||
| Table 2(b) Seasonally Adjusted Indices of Production in Non-Residential Building 1 | ||||||||
| Base Year: 2015=100 | ||||||||
| Value of Production | Volume of Production | |||||||
| Period | Index | % change on previous period | Annual % change | Index | % change on previous period | Annual % change | ||
| 2006 | 144.8 | 11.9 | 158.0 | 5.9 | ||||
| 2007 | 153.6 | 6.0 | 159.7 | 1.1 | ||||
| 2008 | 154.8 | 0.8 | 155.7 | -2.6 | ||||
| 2009 | 118.9 | -23.2 | 121.3 | -22.1 | ||||
| 2010 | 84.9 | -28.6 | 85.7 | -29.4 | ||||
| 2011 | 81.4 | -4.1 | 84.3 | -1.7 | ||||
| 2012 | 73.5 | -9.8 | 75.4 | -10.5 | ||||
| 2013 | 87.8 | 19.6 | 89.5 | 18.6 | ||||
| 2014 | 94.9 | 8.0 | 95.7 | 7.0 | ||||
| 2015 | 99.9 | 5.3 | 100.0 | 4.4 | ||||
| 2016 | 112.3 | 12.4 | 111.5 | 11.5 | ||||
| 2017 | 133.7 | 19.1 | 130.6 | 17.2 | ||||
| 2018 | 155.8 | 16.5 | 147.6 | 13.0 | ||||
| 2006 | 1st quarter | 147.8 | 3.4 | 26.2 | 164.6 | 1.2 | 21.1 | |
| 2nd quarter | 143.8 | -2.7 | 13.8 | 157.9 | -4.1 | 7.8 | ||
| 3rd quarter | 138.5 | -3.7 | 5.6 | 151.3 | -4.2 | -0.3 | ||
| 4th quarter | 149.2 | 7.7 | 4.3 | 158.3 | 4.6 | -2.7 | ||
| 2007 | 1st quarter | 152.4 | 2.1 | 3.1 | 160.6 | 1.5 | -2.4 | |
| 2nd quarter | 153.8 | 0.9 | 7.0 | 160.6 | 0.0 | 1.7 | ||
| 3rd quarter | 154.7 | 0.6 | 11.7 | 160.0 | -0.4 | 5.8 | ||
| 4th quarter | 153.4 | -0.8 | 2.8 | 157.7 | -1.4 | -0.4 | ||
| 2008 | 1st quarter | 157.0 | 2.3 | 3.0 | 158.8 | 0.7 | -1.1 | |
| 2nd quarter | 157.9 | 0.6 | 2.7 | 158.6 | -0.1 | -1.2 | ||
| 3rd quarter | 150.6 | -4.6 | -2.7 | 151.2 | -4.7 | -5.5 | ||
| 4th quarter | 153.5 | 1.9 | 0.1 | 154.0 | 1.9 | -2.3 | ||
| 2009 | 1st quarter | 135.6 | -11.7 | -13.6 | 137.6 | -10.6 | -13.4 | |
| 2nd quarter | 124.8 | -8.0 | -21.0 | 127.3 | -7.5 | -19.7 | ||
| 3rd quarter | 115.2 | -7.7 | -23.5 | 118.4 | -7.0 | -21.7 | ||
| 4th quarter | 99.8 | -13.4 | -35.0 | 102.0 | -13.9 | -33.8 | ||
| 2010 | 1st quarter | 88.6 | -11.2 | -34.7 | 89.9 | -11.9 | -34.7 | |
| 2nd quarter | 80.9 | -8.7 | -35.2 | 81.6 | -9.2 | -35.9 | ||
| 3rd quarter | 85.4 | 5.6 | -25.9 | 86.2 | 5.6 | -27.2 | ||
| 4th quarter | 84.6 | -0.9 | -15.2 | 85.0 | -1.4 | -16.7 | ||
| 2011 | 1st quarter | 82.2 | -2.8 | -7.2 | 84.1 | -1.1 | -6.5 | |
| 2nd quarter | 81.8 | -0.5 | 1.1 | 84.9 | 1.0 | 4.0 | ||
| 3rd quarter | 82.0 | 0.2 | -4.0 | 85.5 | 0.7 | -0.8 | ||
| 4th quarter | 79.6 | -2.9 | -5.9 | 82.5 | -3.5 | -2.9 | ||
| 2012 | 1st quarter | 78.4 | -1.5 | -4.6 | 80.6 | -2.3 | -4.2 | |
| 2nd quarter | 73.4 | -6.4 | -10.3 | 75.2 | -6.7 | -11.4 | ||
| 3rd quarter | 70.3 | -4.2 | -14.3 | 72.2 | -4.0 | -15.6 | ||
| 4th quarter | 71.7 | 2.0 | -9.9 | 73.6 | 1.9 | -10.8 | ||
| 2013 | 1st quarter | 75.4 | 5.2 | -3.8 | 76.8 | 4.3 | -4.7 | |
| 2nd quarter | 83.4 | 10.6 | 13.6 | 85.0 | 10.7 | 13.0 | ||
| 3rd quarter | 93.0 | 11.5 | 32.3 | 94.8 | 11.5 | 31.3 | ||
| 4th quarter | 99.5 | 7.0 | 38.8 | 101.2 | 6.8 | 37.5 | ||
| 2014 | 1st quarter | 98.2 | -1.3 | 30.2 | 99.6 | -1.6 | 29.7 | |
| 2nd quarter | 93.3 | -5.0 | 11.9 | 94.1 | -5.5 | 10.7 | ||
| 3rd quarter | 94.1 | 0.9 | 1.2 | 94.8 | 0.7 | 0.0 | ||
| 4th quarter | 93.9 | -0.2 | -5.6 | 94.4 | -0.4 | -6.7 | ||
| 2015 | 1st quarter | 99.3 | 5.8 | 1.1 | 99.4 | 5.3 | -0.2 | |
| 2nd quarter | 101.5 | 2.2 | 8.8 | 101.4 | 2.0 | 7.8 | ||
| 3rd quarter | 97.1 | -4.3 | 3.2 | 97.2 | -4.1 | 2.5 | ||
| 4th quarter | 101.8 | 4.8 | 8.4 | 101.9 | 4.8 | 7.9 | ||
| 2016 | 1st quarter | 103.8 | 2.0 | 4.5 | 103.2 | 1.3 | 3.8 | |
| 2nd quarter | 112.1 | 8.0 | 10.4 | 111.3 | 7.8 | 9.8 | ||
| 3rd quarter | 116.7 | 4.1 | 20.2 | 116.1 | 4.3 | 19.4 | ||
| 4th quarter | 116.5 | -0.2 | 14.4 | 115.4 | -0.6 | 13.2 | ||
| 2017 | 1st quarter | 136.3 | 17.0 | 31.3 | 133.7 | 15.9 | 29.6 | |
| 2nd quarter | 129.2 | -5.2 | 15.3 | 126.1 | -5.7 | 13.3 | ||
| 3rd quarter | 129.4 | 0.2 | 10.9 | 126.5 | 0.3 | 9.0 | ||
| 4th quarter | 140.0 | 8.2 | 20.2 | 136.2 | 7.7 | 18.0 | ||
| 2018 | 1st quarter | 143.6 | 2.6 | 5.4 | 139.2 | 2.2 | 4.1 | |
| 2nd quarter | 154.8 | 7.8 | 19.8 | 146.3 | 5.1 | 16.0 | ||
| 3rd quarter | 161.9 | 4.6 | 25.1 | 152.2 | 4.0 | 20.3 | ||
| 4th quarter | 162.8 | 0.6 | 16.3 | 152.8 | 0.4 | 12.2 | ||
| 2019 | 1st quarter | 165.0 | 1.4 | 14.9 | 153.6 | 0.5 | 10.3 | |
| 2nd quarter2 | 160.6 | -2.7 | 3.7 | 148.9 | -3.1 | 1.8 | ||
| 1 Based on Seasonal Patterns up to Quarter 2, 2019 | ||||||||
| 2 Provisional | ||||||||
The Production in Building and Construction Index provides quarterly statistics on output in the sector. The index monitors trends in the value and the volume of production in building and construction. The index is primarily intended to function as a short-term indicator. For long term analysis, the annual Building and Construction Inquiry is recommended.
The principal difference between the value and volume indices is that the value index measures changes in the value of work done while the volume index tracks the quantitative volume of production by excluding the effect of price changes using a price deflator. The Capital Goods price index for Building and Construction is used as the price deflator for this series.
This series is also available using the interactive tables in Statbank, the CSO’s Main Data Dissemination Service on www.cso.ie
The Production in Building and Construction Index is carried out on a quarterly basis (i.e. the first quarter covers January, February and March etc.).
The set of indices, based on the Laspeyres Index, has been compiled with reference to base year 2015=100. The underlying structural weighting system for the output categories (Residential Building, Non-Residential Building and Civil Engineering) is based on the annual Building and Construction Inquiry, which provides Building and Civil weights, combined with the new Dwelling Completions data to generate Residential weights. The sample for the index is stratified by size class based on number of persons employed: A (0 – 4), B (5 -19), C (20-99) and D (>99). Size class weights were produced using the Building and Construction Inquiry 2015 and the Quarterly National Household Survey Q2 2015.
The Quarterly Survey of Construction (QSC) is carried out in accordance with the Statistics (Quarterly Survey of Construction) Order 2017 (S.I. No. 23 of 2017), made under the 1993 Statistics Act. The statistics are also required for EU comparisons under Council Regulation (EC) No. 1165/98 which has been amended by Regulation (EC) No. 1893/2006 with the introduction of NACE Rev. 2.
The Production in Building and Construction Index covers, on a sample basis, the production of all firms in the private (i.e. non-State) sector whose main activity is building, construction or civil engineering i.e. firms classified to division F of the Statistical Classification of Economic Activities in the European Community (NACE Rev. 2). Approximately 2,400 firms are surveyed each quarter.
Seasonal Adjustment is conducted using the direct seasonal adjustment approach. Under this approach, each individual series is independently adjusted. Each individual seasonally adjusted series is calculated based on working day adjusted data.
The seasonal adjustments are implemented using the X-13-ARIMA methodology. This is applied using the Win X-13 software package, developed by the U.S. Census Bureau. This methodology estimates seasonal factors while also taking into consideration factors that impact on the quality of the seasonal adjustment such as outliers and level shifts in the series.
For additional information on the use of X-13-Arima see Monsell B. C., Lytras, D., and Findley, D. ‘Getting Started with X-13 ARIMA SEATS Input Files’, March 2016 available at www.census.gov/srd/www/x13as/.
A description of the methodology is available within the Methods area on the CSO website at:
Production in Building and Construction Index Methodology
There are differences (due to timing, definitions and other factors) between the quarterly and annual trends measured by this survey and by other national data sources. In particular the quarterly series from the QSC show considerable volatility. Table A, below, compares the main annual results of the survey with national employment and house building indicators.
The series shows an increase of 12.1% in the annual volume of production in building and construction between 2017 and 2018. In the same period, employment in the sector, as measured by the Labour Force Survey, rose by 13.8%.
For residential buildings, the QSC shows an increase of 4% in the annual volume of production between 2017 and 2018. The New Dwellings Completions series shows an increase of 25.4% in the same period.
Data on house-building commencements, a relatively new leading indicator, are also included in Table A. This indicator shows an increase of 27.9% in residential building in 2018 when compared with 2017.
| Table A: Comparison of Building and Construction sector indicators | |||||||
| CSO Series | Other Indicators | ||||||
| Seasonally Adjusted Volume of Production in Building and Construction3 |
Seasonally Adjusted Volume of Production in Civil Engineering3 |
Seasonally Adjusted Volume of Production in Residential Building3 | Persons Employed in the Construction Sector1 | New Dwelling Completions5 |
House Commencements2 | ||
| Index | Index | Index | No. | No. | No. | ||
| 2015=100 | 2015=100 | 2015=100 | |||||
| 2006 | 348.0 | 163.0 | 818.6 | 219,100 | - | 75,602 | |
| 2007 | 301.9 | 170.3 | 645.5 | 240,000 | - | 48,876 | |
| 2008 | 214.6 | 160.1 | 357.0 | 214,000 | - | 22,852 | |
| 2009 | 135.5 | 139.6 | 150.0 | 132,800 | - | 8,599 | |
| 2010 | 94.9 | 108.4 | 93.3 | 104,400 | - | 6,391 | |
| 2011 | 78.7 | 82.5 | 68.1 | 86,800 | 6,994 | 4,365 | |
| 2012 | 76.9 | 96.1 | 59.6 | 81,300 | 4,911 | 4,042 | |
| 2013 | 85.4 | 101.0 | 66.0 | 86,200 | 4,575 | 4,708 | |
| 20144 | 92.7 | 104.3 | 77.2 | 90,800 | 5,518 | 7,717 | |
| 2015 | 100.1 | 100.3 | 100.1 | 109,000 | 7,219 | 8,747 | |
| 2016 | 112.5 | 103.6 | 134.4 | 119,400 | 9,916 | 13,234 | |
| 2017 | 130.1 |
102.3 | 170.1 | 128,000 | 14,407 | 17,572 | |
| 2018 | 145.9 | 126.8 | 176.9 | 145,700 | 18,072 | 22,467 | |
| 1 Labour Force Survey, April - June quarter, NACE Rev. 2. | |||||||
| 2 Source: Department of Housing, Planning and Local Government. | |||||||
| 3 Seasonally Adjusted series introduced in Q1 2015. | |||||||
| 4 In 2014 there was a change in the methodology for the Housing data collated by the DHPCLG. Previously the data was collated from 37 Building Control Areas by the DHPCLG. This was updated in 2014 with the data now being drawn from a database held by the Local Government Management Agency updated directly by developers/ builders on line or by the local authority. | |||||||
| 5 New Dwelling Completions series introduced in Q1 2018 with coverage starting in 2011. | |||||||
 Hide Background Notes
Scan the QR code below to view this release online or go to
http://www.cso.ie/en/releasesandpublications/er/pbci/productioninbuildingandconstructionindexquarter22019/
 Show Table 1(a) Seasonally Adjusted Indices of Production in all Building and Construction
 Hide Table 1(a) Seasonally Adjusted Indices of Production in all Building and Construction