
| Goods Output | Intermediate Consumption | Net Subsidies | Operating Surplus | |
| 2016 | €7,064m | €5,075m | €1,608m | €2,641m |
| 2017 | €8,056m | €5,253m | €1,637m | €3,457m |
| 2018 | €8,025m | €5,842m | €1,681m | €2,876m |
| % Change ('17 on '16) | 14.0% | 3.5% | 1.8% | 30.9% |
| % Change ('18 on '17) | -0.4% | 11.2% | 2.7% | -16.8% |
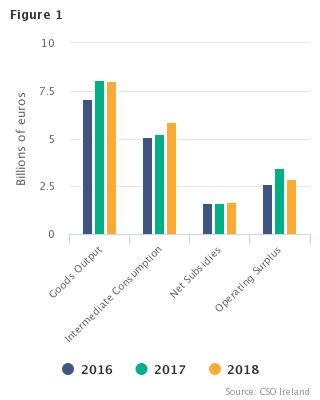
The CSO’s first estimate of operating surplus in agriculture in 2018 shows an annual decrease of 16.8%, down from €3,456.9m in 2017 to €2,876.3m. This decrease is in line with the trends shown by other CSO short-term indicators in agriculture.
The main driver of this change was an increase of €589.7m (+11.2%) in intermediate consumption. The main items giving rise to this increase are feedingstuffs and fertilisers, which increased by 34.1% and 11.6% respectively. See Table 1.
An analysis of the results for 2018 compared to 2017 identified the following main changes:
|
The figures for 2018 are advance estimates which are provisional and based on the latest available data. These figures are subject to change once the complete set of data for the full year becomes available. Updated figures for 2018 will be published in the Preliminary Estimate in March 2019, followed by the Final Estimate in June 2019. |
| Table 1 Estimated Output, Input and Income in Agriculture, 2018 | Advance estimate | ||||
| Estimated Value | Change 2018/2017 | ||||
| Description | 2016 | 2017 | 2018 | Value | Volume |
| €m | Percent | ||||
| Livestock (incl. stock changes) | 3,439.6 | 3,590.1 | 3,603.2 | 0.4 | 2.8 |
| of which: | |||||
| Cattle | 2,288.9 | 2,361.4 | 2,367.1 | 0.2 | 0.7 |
| Pigs | 465.2 | 515.6 | 465.0 | -9.8 | 2.9 |
| Sheep | 255.4 | 262.6 | 333.2 | 26.9 | 21.1 |
| Horses | 270.5 | 287.4 | 270.6 | -5.9 | 3.1 |
| Poultry | 159.5 | 163.1 | 167.3 | 2.6 | 3.9 |
| Livestock products | 1,857.8 | 2,666.4 | 2,545.5 | -4.5 | 1.7 |
| of which: | |||||
| Milk | 1,790.8 | 2,591.7 | 2,468.8 | -4.7 | 1.7 |
| Other livestock products | 67.0 | 74.6 | 76.8 | 2.9 | 2.1 |
| Crops (incl. stock changes) | 1,766.7 | 1,799.9 | 1,876.0 | 4.2 | -5.4 |
| of which: | |||||
| Cereals1 | 230.8 | 237.2 | 257.8 | 8.7 | -21.9 |
| Forage plants | 1,049.4 | 1,081.0 | 1,101.4 | 1.9 | -0.8 |
| Other crops | 486.5 | 481.6 | 516.8 | 7.3 | -6.3 |
| Goods output at producer prices | 7,064.1 | 8,056.3 | 8,024.7 | -0.4 | 0.6 |
| Contract work | 361.5 | 376.4 | 376.4 | 0.0 | 0.0 |
| Subsidies less taxes on products | 7.1 | 11.0 | 14.9 | ||
| Agricultural output at basic prices | 7,432.7 | 8,443.7 | 8,415.9 | -0.3 | 0.6 |
| Intermediate consumption | 5,074.8 | 5,252.7 | 5,842.4 | 11.2 | 7.6 |
| of which: | |||||
| Feeding stuffs | 1,228.7 | 1,328.6 | 1,781.4 | 34.1 | 27.3 |
| Fertilisers | 510.8 | 513.0 | 572.7 | 11.6 | 7.3 |
| Energy and lubricants | 375.4 | 387.7 | 417.6 | 7.7 | -0.1 |
| Forage plants | 1,046.3 | 1,077.2 | 1,097.6 | 1.9 | -0.8 |
| Contract work | 361.5 | 376.4 | 376.4 | 0.0 | 0.0 |
| Other items of intermediate consumption | 1,552.1 | 1,569.9 | 1,596.7 | 1.7 | 0.2 |
| Gross value added at basic prices | 2,357.9 | 3,191.1 | 2,573.6 | -19.4 | |
| Fixed capital consumption | 809.0 | 837.9 | 837.9 | 0.0 | |
| Net value added at basic prices | 1,548.9 | 2,353.2 | 1,735.7 | -26.2 | |
| Other subsidies less taxes on production | 1,600.7 | 1,625.7 | 1,665.9 | 2.5 | |
| Factor income | 3,149.6 | 3,978.8 | 3,401.6 | -14.5 | |
| Compensation of employees | 508.9 | 521.9 | 525.2 | 0.6 | |
| Operating surplus | 2,640.7 | 3,456.9 | 2,876.3 | -16.8 | |
| Interest less FISIM | 56.6 | 53.3 | 57.6 | 8.0 | |
| Land rental | 241.3 | 239.6 | 239.6 | 0.0 | |
| Entrepreneurial income | 2,342.8 | 3,164.0 | 2,579.2 | -18.5 | |
| 1 Commercial sales of Wheat, Barley and Oats | |||||
Three sets of estimates are prepared in each 12-month period. The first or Advance estimate is generally released in early December of the reference year. This is based on the data available at the time, which is not fully complete. The Advance estimate is updated in March of the following year when the Preliminary estimate is published. This incorporates all additional up-to-date information that has become available by that time. In June, the Final estimate of the agricultural accounts is prepared based on the complete set of data. The methodology used for producing accounts for agriculture is based on the European System of Accounts (ESA 2010). For details of methodology and description of data sources please see the “Methodology” link.
This is the total output of goods produced and sold by the agricultural sector during the year valued at producer prices. It does not include the value of services provided, i.e. contract work.
This is the price received by the farmer for his agricultural produce. It is sometimes referred to as the farm-gate or ex-farm price. It excludes VAT.
This is a sum of goods output plus the value of services provided (contract work) valued at basic prices.
The basic price corresponds to the producer price plus any subsidies directly linked to a product minus any taxes on products. VAT is excluded.
Subsidies and taxes on agricultural products are those paid or levied per unit of a good or service produced or exported. An example of subsidies on product is the beef data and genomics premium. The bovine disease eradication levy is an example of a tax on products.
Activities performed by agricultural contractors directly linked to the production of agricultural products (for example harvesting) are an integral part of agriculture. The value of such work is included as an output and also as intermediate consumption. Estimates of the input costs incurred by agricultural contractors in the provision of agricultural services are included under the appropriate intermediate consumption categories, as well as in the compensation of employees figure.
This is the value of all goods and services used as inputs in the production process excluding fixed assets (capital goods), whose consumption is recorded as fixed capital consumption (depreciation). Intermediate consumption excludes new or existing acquired fixed assets, e.g. tractors, agricultural machinery etc. They are recorded as gross fixed capital formation (GFCF). Intermediate consumption includes expenditure on contract work and forage plants, even if consumed within the same agricultural holding.
The production of forage plants is valued as part of output. Silage and hay are the main items in this category. Direct sales of cereals between farms and use of cereals within farms are also included under forage plants. These items are also treated as intermediate consumption with minor exceptions, such as sales of straw to racing stables.
Financial intermediaries (mainly banks) charge explicit commissions and fees for their services to customers, as well as implicit ones by paying and charging different rates of interest to borrowers and lenders. The revenue from the margin on lending and borrowing by financial intermediaries is described as financial intermediation services indirectly measured (FISIM). The inclusion of FISIM in the table is in line with recommended EU national accounting conventions. It is a reallocation to intermediate consumption of part of the interest paid by farmers. While the inclusion of FISIM will increase intermediate consumption and decrease gross value added, it will decrease, by the same amount, the figure shown for interest paid.
This is the difference between the output at basic prices and intermediate consumption. It is a measure of gross income before depreciation, subsidies and taxes and compensation of employees.
Net value added is calculated by subtracting expenditure on fixed capital consumption (depreciation) from gross value added.
This relates to the foreseeable wear and tear and obsolescence of fixed capital goods. It is calculated on the basis of the probable economic life of the asset. It is not calculated for breeding livestock or for non-produced assets such as land.
Factor income is a sum of net value added plus other subsidies on production less taxes on production. It is sometimes referred to as value added at factor cost.
Other subsidies on production are subsidies other than those on products. Examples are the Basic Payment Scheme, the Areas of Natural Constraints Scheme and GLAS. Taxes on production consist of VAT over/under-compensation for farmers, who have opted for the flat rate VAT system, motor and machinery tax paid by farmers. Other subsidies less taxes on production are not included in the calculation of output but are included in the calculation of factor income and operating surplus.
The operating surplus is calculated by subtracting compensation of employees from factor income. The figure is comprised of the operating surplus earned by farmers and that earned by agricultural contractors. It is an estimate of income before deductions for interest payments on borrowed capital, land annuities and rent paid by farmers to landowners for the use of their land.
This includes remuneration in cash and in kind. It does not include the remuneration of work undertaken by the farm owner or by non-salaried family members.
Entrepreneurial income is comprised of operating surplus less interest payments on borrowed capital and land rental paid by farmers to landowners.
For each category, the difference between closing year stocks and opening year stocks is valued at the average producer price for the year.
To calculate the volume indices all items of output and input are valued at constant base year prices, i.e. by applying base year prices to current year quantities. The volume index for 2018 may then be calculated by comparing the value in 2018 at average 2015 prices to the value in 2015 at average 2015 prices. Volume indices allow one to estimate the changes in production and expenditure, as if the prices did not change since the base year. This separates the effects of volume and price changes on output, input and income.
 Hide Background Notes
Scan the QR code below to view this release online or go to
http://www.cso.ie/en/releasesandpublications/er/oiiaa/outputinputandincomeinagriculture-advanceestimate2018/
 Show Table 1 Estimated Output, Input and Income in Agriculture 2018
 Hide Table 1 Estimated Output, Input and Income in Agriculture 2018