
This release was compiled during the COVID-19 pandemic. The number of new domestic ESBN connections undertaken has been impacted in different ways since March 2020 from the varying restrictions associated with the pandemic. To show the effect of the pandemic and related restrictions over this period - and before - on the New Dwelling Completions, an additional monthly analysis has been included for this quarter's release.
| Number of new dwelling completions | ||||
| Single | Scheme | Apartment | Totals | |
| Quarter 3 2020 | 1,463 | 2,867 | 715 | 5,045 |
| Quarter 3 2021 | 1,198 | 2,458 | 1,000 | 4,656 |
| % change | -18.1% | -14.3% | 39.9% | -7.7% |
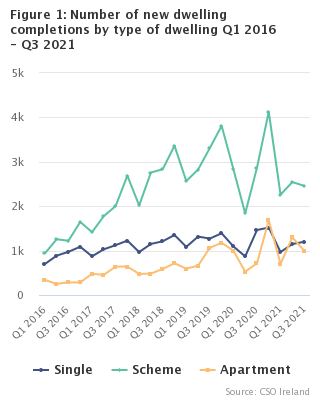
There were 4,656 new dwelling completions in Q3 2021, which is 7.7% less than the 5,045 completions in the third quarter of 2020.
The Q3 data for 2021 also shows that:
Figure 1a details the monthly breakdown of new dwelling completions for the first three-quarters of 2019, 2020 and 2021. This shows that from a peak in June completions dropped in July and August in 2021 before rising to 1,706 in September. This is however still below the September figures of 1,838 and 1,893 in 2019 and 2020 respectively.
| Month | 2019 | 2020 | 2021 |
|---|---|---|---|
| Jan | 1298 | 1598 | 1195 |
| Feb | 1389 | 1575 | 1411 |
| Mar | 1559 | 1755 | 1323 |
| Apr | 1454 | 395 | 1456 |
| May | 1601 | 1230 | 1549 |
| Jun | 1746 | 1605 | 1984 |
| Jul | 2014 | 1794 | 1496 |
| Aug | 1793 | 1358 | 1454 |
| Sep | 1838 | 1893 | 1706 |
ESB domestic connections dataset used as a primary sourceThe primary data source used for the New Dwellings Completions series is the ESB Networks new domestic connections dataset, where the date that the connection is energized determines the date of completion. It is accepted that the ESB domestic connections dataset is overestimating new dwellings and the CSO has adjusted for this overcount by using additional information from the ESB and other data sources. ESB connections are classified into four categories: new dwelling completions, UFHDs (previously finished houses in UnFinished Housing Developments), reconnections and non-dwellings. The dwelling type (single, scheme, apartment) and urban-rural divide are defined by the ESB Network. See Background Notes and Methodology for a more detailed discussion of the classification. The New Dwelling Completions series is based on the number of domestic dwellings connected by the ESB Network to the electricity supply and may not accord precisely with geographical boundaries. The CSO has utilised other available data sources to validate and enhance the ESB connections dataset. However, this was only possible where the connections dataset could be confidently linked to another dataset using unique identifiers or by address matching. As the level of Eircode collection, coverage and storage increases across data sources in the housing sector, it is expected that the precision of estimates on new dwelling completions can be further enhanced. Student accommodationThere has been a significant level of construction output in the student accommodation sector. These are generally connected to the ESB Network as commercial connections and are therefore not included in the ESB domestic connections dataset used for the new dwelling completions. The data available on this sector is on a “bed space” basis and it is not currently possible to report on it as dwellings, which are self-contained units of living accommodation. Based on consultation with stakeholders in this sector, student accommodation may be included in future New Dwelling Completions reports as a separate category. There were 360 bed spaces completed in the student accommodation sector in Q3 2021. Total completed bed spaces since Q2 2016 stand at 11,121. |
The ESB domestic connections dataset provides information on the type of connection and whether it is in an urban or rural area. In Q3 2021 the number of completions in urban areas fell 5.0% to 3,617 in Q3 2021 from 3,806 in Q2 2020. In rural areas, there was a greater relative drop of 16.1% from 1,239 in Q3 2020 to 1,039 this quarter. Over three-quarters (77.7%) of new dwelling completions in Q3 2021 were in urban areas with 22.3% being in rural areas. This compares to 75.4% urban and 24.6% rural in Q3 2020. See Table 2.
There was a 12.1% year-on-year increase in completions in Dublin with 1,235 completions. compared to 1,102 in Q3 2020. The Midlands is the only other region with a year-on-year increase (4.2%) All other regions saw a decrease from Q3 2020, with the fall greatest at 26.4% in the South-West region falling from 914 in Q3 2020 to 613 in Q3 2021. See Figure 2.
The most apartment completions were in Dublin with 674 completed this quarter. This represents 67.4% of all apartments completed nationally. Of all completions in Dublin, 54.6% were apartments. The highest number of apartment completions by local authorities was in Dublin City (290) and Dún Laoghaire–Rathdown (256). There were also over 100 apartment completions in Fingal (106). Outside of Dublin, the highest number of apartment completions was in Kildare (86) followed by Wicklow (77).
The Mid-East region accounts for 34.6% (850) of the total scheme dwellings in Q3 2021 with 16.6% (407) in Kildare alone. Kildare was the local authority with the highest total number of completions (541) followed by Cork County (396).
The highest number of single dwelling completions in this quarter was in the South-West region (207) followed closely by the West (197). The Border region had the highest proportion – 72.0% - of its completions being single dwellings. The local authority with the highest number of single completions is Cork County (145) followed by Galway County (105). See Table 3.
|
Classification into local authorities has taken into account boundary changes between Cork City and Cork County which came into effect in May 2019. All historical data within the tables below and the PxStat interactive tables have been revised to now be based on the new boundaries. However, data within archived releases have stayed as is. |
| Year on Year Change | |
| Border | -18.4 |
| Midlands | 4.2 |
| West | -8.6 |
| Dublin | 12.1 |
| Mid-East | -7.6 |
| Mid-West | -12.1 |
| South-East | -12.7 |
| South-West | -26.4 |
The Local Electoral Area with the highest number of new dwelling completions this quarter was Glencullen-Sandyford (179 completions), followed by Blanchardstown-Mulhuddart (172) and Maynooth (157). With the exception of Skibbereen-West Cork (79 completions), all of the top ten Local Electoral Areas with the most completions were in Dublin, Kildare or Meath. See Figure 3.
New dwelling completions by Local Electoral Area going back to the start of the series in 2011 by year and quarter can be viewed in the PxStat tables NDA05 and NDQ09. There is also data available by Eircode Routing Key by year and quarter in PxStat tables NDA01 and NDQ07.
There was a total of 5,635 domestic ESB connections in Q2. This was a decrease of 7.6% on the 6,096 connections in Q3 2020. The ESB domestic connections series continues to show a comparable trend to the NDC series compiled by the CSO as shown in Figure 4. The number of new dwelling completions as a percentage of total ESB domestic connections was 82.6% this quarter.
There are still some differences in volume between the two series. The starting point for the NDC series is the ESB domestic connections dataset, with adjustments made to account for previously finished houses in unfinished housing developments (UFHDs), reconnections and non-dwellings as shown in Figure 5 and Table 4.
| New dwelling completions | ESB connections | |
| Q1 2016 | 1972 | 3150 |
| Q2 2016 | 2394 | 3486 |
| Q3 2016 | 2479 | 3874 |
| Q4 2016 | 3016 | 4413 |
| Q1 2017 | 2763 | 3902 |
| Q2 2017 | 3259 | 4566 |
| Q3 2017 | 3762 | 4991 |
| Q4 2017 | 4554 | 5726 |
| Q1 2018 | 3459 | 4457 |
| Q2 2018 | 4392 | 5460 |
| Q3 2018 | 4627 | 5739 |
| Q4 2018 | 5429 | 6729 |
| Q1 2019 | 4246 | 5279 |
| Q2 2019 | 4801 | 5787 |
| Q3 2019 | 5645 | 6679 |
| Q4 2019 | 6376 | 7514 |
| Q1 2020 | 4928 | 5919 |
| Q2 2020 | 3230 | 3890 |
| Q3 2020 | 5045 | 6096 |
| Q4 2020 | 7329 | 8638 |
| Q1 2021 | 3929 | 4988 |
| Q2 2021 | 4989 | 6012 |
| Q3 2021 | 4656 | 5635 |
A property that is reconnected to the ESB Network after having been disconnected for more than two years is assigned a new MPRN and is therefore included in the ESB connections datasets and here considered to be a reconnection. There were 616 reconnections in Q2 2021, down 11.1% from 693 in Q3 2020. Reconnections account for 10.9% of all ESB connections this quarter.
The number of previously finished dwellings in unfinished housing developments (UFHDs) represents only 1.7% of all ESB domestic connections in Q3 2021 with 96 connections which is the lowest proportion since the series began in 2011. In Q3 2014, UFHDs accounted for 24.4% of connections. The number of non-dwellings - mostly farm buildings - has risen 10.3% from 242 in Q3 2020 to 267 in Q3 2021. See Figure 5 and Table 4.
| UFHD | Reconnection | Non-dwelling | |
| Q1 2016 | 502 | 480 | 196 |
| Q2 2016 | 363 | 521 | 208 |
| Q3 2016 | 560 | 637 | 198 |
| Q4 2016 | 441 | 716 | 240 |
| Q1 2017 | 370 | 551 | 218 |
| Q2 2017 | 419 | 653 | 235 |
| Q3 2017 | 320 | 689 | 220 |
| Q4 2017 | 262 | 632 | 278 |
| Q1 2018 | 212 | 570 | 216 |
| Q2 2018 | 182 | 649 | 237 |
| Q3 2018 | 188 | 709 | 215 |
| Q4 2018 | 308 | 753 | 239 |
| Q1 2019 | 176 | 597 | 260 |
| Q2 2019 | 152 | 640 | 194 |
| Q3 2019 | 190 | 627 | 217 |
| Q4 2019 | 213 | 741 | 184 |
| Q1 2020 | 126 | 623 | 242 |
| Q2 2020 | 78 | 416 | 166 |
| Q3 2020 | 116 | 693 | 242 |
| Q4 2020 | 240 | 759 | 310 |
| Q1 2021 | 143 | 617 | 299 |
| Q2 2021 | 128 | 654 | 241 |
| Q3 2021 | 96 | 616 | 267 |
Table 5 shows the type of ESB connection by NUTS3 region in Q3 2021. The highest number of reconnections were in the Border region (111). The South-West region had the highest of UFHDs (21) and non-dwellings (46). Dublin has the highest proportion of connections being new dwelling completions (95.7%) with the Border region having the lowest (61.2%).
Figure 6 shows that the average new dwelling size is continuing to gradually fall year on year. The decline in the average new dwelling size index is driven by both an increase in the proportion of completed dwellings being apartments - 22% for the first three quarters of 2021 - and also a decrease in the size of single and scheme dwellings (see Table 6). The average new dwelling size index is obtained by linking ESB connections to BER assessment data from the SEAI for new dwelling completions (see Table 7 in Background Notes and Methodology for match rates).
| Index (2016 = 100) | |
| 2011 | 115.07749269059 |
| 2012 | 118.73668978175 |
| 2013 | 118.148890836266 |
| 2014 | 108.131446866374 |
| 2015 | 103.478029399378 |
| 2016 | 100 |
| 2017 | 91.9895749346372 |
| 2018 | 89.4862581873726 |
| 2019 | 85.974096078778 |
| 2020 | 83.2291706830557 |
| 2021* | 79.3945394950394 |
| Table 1: New dwelling completions by type of dwelling, 2011 - Q3 2021 | |||||
| Period | Single | Scheme | Apartment | Total | |
| 2011 | Q1 | 1,156 | 447 | 272 | 1,875 |
| 2011 | Q2 | 1,194 | 380 | 217 | 1,791 |
| 2011 | Q3 | 1,197 | 305 | 185 | 1,687 |
| 2011 | Q4 | 1,267 | 226 | 148 | 1,641 |
| Year | 4,814 | 1,358 | 822 | 6,994 | |
| 2012 | Q1 | 797 | 211 | 123 | 1,131 |
| 2012 | Q2 | 847 | 194 | 76 | 1,117 |
| 2012 | Q3 | 868 | 244 | 93 | 1,205 |
| 2012 | Q4 | 989 | 315 | 154 | 1,458 |
| Year | 3,501 | 964 | 446 | 4,911 | |
| 2013 | Q1 | 638 | 174 | 77 | 889 |
| 2013 | Q2 | 721 | 281 | 144 | 1,146 |
| 2013 | Q3 | 727 | 267 | 39 | 1,033 |
| 2013 | Q4 | 861 | 433 | 213 | 1,507 |
| Year | 2,947 | 1,155 | 473 | 4,575 | |
| 2014 | Q1 | 625 | 309 | 160 | 1,094 |
| 2014 | Q2 | 712 | 365 | 241 | 1,318 |
| 2014 | Q3 | 728 | 506 | 170 | 1,404 |
| 2014 | Q4 | 910 | 615 | 177 | 1,702 |
| Year | 2,975 | 1,795 | 748 | 5,518 | |
| 2015 | Q1 | 659 | 606 | 106 | 1,371 |
| 2015 | Q2 | 735 | 674 | 161 | 1,570 |
| 2015 | Q3 | 879 | 899 | 255 | 2,033 |
| 2015 | Q4 | 979 | 1,115 | 151 | 2,245 |
| Year | 3,252 | 3,294 | 673 | 7,219 | |
| 2016 | Q1 | 698 | 936 | 338 | 1,972 |
| 2016 | Q2 | 886 | 1,256 | 252 | 2,394 |
| 2016 | Q3 | 973 | 1,222 | 284 | 2,479 |
| 2016 | Q4 | 1,087 | 1,646 | 283 | 3,016 |
| Year | 3,644 | 5,060 | 1,157 | 9,861 | |
| 2017 | Q1 | 871 | 1,415 | 477 | 2,763 |
| 2017 | Q2 | 1,029 | 1,776 | 454 | 3,259 |
| 2017 | Q3 | 1,122 | 2,001 | 639 | 3,762 |
| 2017 | Q4 | 1,225 | 2,688 | 641 | 4,554 |
| Year | 4,247 | 7,880 | 2,211 | 14,338 | |
| 2018 | Q1 | 967 | 2,017 | 475 | 3,459 |
| 2018 | Q2 | 1,150 | 2,759 | 483 | 4,392 |
| 2018 | Q3 | 1,210 | 2,832 | 585 | 4,627 |
| 2018 | Q4 | 1,351 | 3,363 | 715 | 5,429 |
| Year | 4,678 | 10,971 | 2,258 | 17,907 | |
| 2019 | Q1 | 1,085 | 2,567 | 594 | 4,246 |
| 2019 | Q2 | 1,315 | 2,825 | 661 | 4,801 |
| 2019 | Q3 | 1,271 | 3,310 | 1,064 | 5,645 |
| 2019 | Q4 | 1,390 | 3,810 | 1,176 | 6,376 |
| Year | 5,061 | 12,512 | 3,495 | 21,068 | |
| 2020 | Q1 | 1,094 | 2,834 | 1,000 | 4,928 |
| 2020 | Q2 | 869 | 1,837 | 524 | 3,230 |
| 2020 | Q3 | 1,463 | 2,867 | 715 | 5,045 |
| 2020 | Q4 | 1,519 | 4,127 | 1,683 | 7,329 |
| Year | 4,945 | 11,665 | 3,922 | 20,532 | |
| 2021 | Q1 | 967 | 2,260 | 702 | 3,929 |
| 2021 | Q2 | 1,148 | 2,544 | 1,297 | 4,989 |
| 2021 | Q3 | 1,198 | 2,458 | 1,000 | 4,656 |
| Table 2: New dwelling completions by urban-rural divide, 2011 - Q3 2021 | ||||
| Period | Urban | Rural | Total | |
| 2011 | Q1 | 841 | 1,033 | 1,874 |
| 2011 | Q2 | 706 | 1,081 | 1,787 |
| 2011 | Q3 | 602 | 1,085 | 1,687 |
| 2011 | Q4 | 489 | 1,152 | 1,641 |
| Year | 2,638 | 4,351 | 6,989 | |
| 2012 | Q1 | 415 | 716 | 1,131 |
| 2012 | Q2 | 368 | 749 | 1,117 |
| 2012 | Q3 | 425 | 778 | 1,203 |
| 2012 | Q4 | 602 | 854 | 1,456 |
| Year | 1,810 | 3,097 | 4,907 | |
| 2013 | Q1 | 329 | 560 | 889 |
| 2013 | Q2 | 534 | 611 | 1,145 |
| 2013 | Q3 | 398 | 635 | 1,033 |
| 2013 | Q4 | 774 | 733 | 1,507 |
| Year | 2,035 | 2,539 | 4,574 | |
| 2014 | Q1 | 540 | 554 | 1,094 |
| 2014 | Q2 | 716 | 602 | 1,318 |
| 2014 | Q3 | 795 | 609 | 1,404 |
| 2014 | Q4 | 912 | 790 | 1,702 |
| Year | 2,963 | 2,555 | 5,518 | |
| 2015 | Q1 | 832 | 539 | 1,371 |
| 2015 | Q2 | 952 | 618 | 1,570 |
| 2015 | Q3 | 1,281 | 751 | 2,032 |
| 2015 | Q4 | 1,420 | 824 | 2,244 |
| Year | 4,485 | 2,732 | 7,217 | |
| 2016 | Q1 | 1,407 | 565 | 1,972 |
| 2016 | Q2 | 1,657 | 737 | 2,394 |
| 2016 | Q3 | 1,670 | 809 | 2,479 |
| 2016 | Q4 | 2,112 | 904 | 3,016 |
| Year | 6,846 | 3,015 | 9,861 | |
| 2017 | Q1 | 2,058 | 705 | 2,763 |
| 2017 | Q2 | 2,411 | 848 | 3,259 |
| 2017 | Q3 | 2,826 | 936 | 3,762 |
| 2017 | Q4 | 3,580 | 974 | 4,554 |
| Year | 10,875 | 3,463 | 14,338 | |
| 2018 | Q1 | 2,663 | 796 | 3,459 |
| 2018 | Q2 | 3,423 | 969 | 4,392 |
| 2018 | Q3 | 3,632 | 995 | 4,627 |
| 2018 | Q4 | 4,291 | 1,138 | 5,429 |
| Year | 14,009 | 3,898 | 17,907 | |
| 2019 | Q1 | 3,357 | 889 | 4,246 |
| 2019 | Q2 | 3,680 | 1,121 | 4,801 |
| 2019 | Q3 | 4,585 | 1,060 | 5,645 |
| 2019 | Q4 | 5,200 | 1,176 | 6,376 |
| Year | 16,822 | 4,246 | 21,068 | |
| 2020 | Q1 | 3,997 | 931 | 4,928 |
| 2020 | Q2 | 2,458 | 772 | 3,230 |
| 2020 | Q3 | 3,806 | 1,239 | 5,045 |
| 2020 | Q4 | 6,042 | 1,287 | 7,329 |
| Year | 16,303 | 4,229 | 20,532 | |
| 2021 | Q1 | 3,121 | 808 | 3,929 |
| 2021 | Q2 | 4,000 | 989 | 4,989 |
| 2021 | Q3 | 3,617 | 1,039 | 4,656 |
| Table 3: New dwelling completions by type of dwelling and Local Authority - Q3 2021 1 | ||||
| Local Authority | Single | Scheme | Apartment | Total - Q3 2021 |
| Border | 185 | 54 | 18 | 257 |
| Cavan | 27 | 15 | 3 | 45 |
| Donegal | 91 | 11 | 9 | 111 |
| Leitrim | 11 | 15 | 0 | 26 |
| Monaghan | 34 | 0 | 3 | 37 |
| Sligo | 22 | 13 | 3 | 38 |
| West | 197 | 151 | 34 | 382 |
| Galway City | 8 | 21 | 20 | 49 |
| Galway County | 105 | 81 | 10 | 196 |
| Mayo | 57 | 24 | 2 | 83 |
| Roscommon | 27 | 25 | 2 | 54 |
| Mid-West | 152 | 122 | 25 | 299 |
| Clare | 66 | 20 | 0 | 86 |
| Limerick | 44 | 89 | 16 | 149 |
| Tipperary | 42 | 13 | 9 | 64 |
| South-East | 130 | 228 | 26 | 384 |
| Carlow | 11 | 32 | 3 | 46 |
| Kilkenny | 39 | 34 | 2 | 75 |
| Waterford | 28 | 88 | 11 | 127 |
| Wexford | 52 | 74 | 10 | 136 |
| South-West | 207 | 426 | 40 | 673 |
| Cork City | 11 | 127 | 16 | 154 |
| Cork County | 145 | 250 | 1 | 396 |
| Kerry | 51 | 49 | 23 | 123 |
| Dublin | 59 | 502 | 674 | 1,235 |
| Dublin City | 13 | 78 | 290 | 381 |
| Dún Laoghaire–Rathdown | 20 | 47 | 256 | 323 |
| Fingal | 16 | 269 | 106 | 391 |
| South Dublin | 10 | 108 | 22 | 140 |
| Mid-East | 176 | 850 | 177 | 1,203 |
| Louth | 43 | 111 | 9 | 163 |
| Kildare | 48 | 407 | 86 | 541 |
| Meath | 60 | 203 | 5 | 268 |
| Wicklow | 25 | 129 | 77 | 231 |
| Midlands | 92 | 125 | 6 | 223 |
| Laois | 27 | 79 | 4 | 110 |
| Longford | 15 | 0 | 2 | 17 |
| Offaly | 21 | 34 | 0 | 55 |
| Westmeath | 29 | 12 | 0 | 41 |
| 1 Local Authority based on substation of dwelling where available | ||||
| Table 4: ESB by Type of connection, 2011 - Q3 2021 | ||||||
| Period | NDC | UFHD | Reconnection | Non-Dwelling | Total | |
| 2011 | Q1 | 1,875 | 383 | 241 | 205 | 2,704 |
| 2011 | Q2 | 1,791 | 331 | 224 | 209 | 2,555 |
| 2011 | Q3 | 1,687 | 326 | 299 | 195 | 2,507 |
| 2011 | Q4 | 1,641 | 338 | 326 | 218 | 2,523 |
| Year | 6,994 | 1,378 | 1,090 | 827 | 10,289 | |
| 2012 | Q1 | 1,131 | 278 | 302 | 179 | 1,890 |
| 2012 | Q2 | 1,117 | 357 | 294 | 196 | 1,964 |
| 2012 | Q3 | 1,205 | 431 | 271 | 163 | 2,070 |
| 2012 | Q4 | 1,458 | 385 | 393 | 185 | 2,421 |
| Year | 4,911 | 1,451 | 1,260 | 723 | 8,345 | |
| 2013 | Q1 | 889 | 354 | 280 | 156 | 1,679 |
| 2013 | Q2 | 1,146 | 323 | 347 | 161 | 1,977 |
| 2013 | Q3 | 1,033 | 393 | 392 | 144 | 1,962 |
| 2013 | Q4 | 1,507 | 436 | 454 | 192 | 2,589 |
| Year | 4,575 | 1,506 | 1,473 | 653 | 8,207 | |
| 2014 | Q1 | 1,094 | 422 | 398 | 165 | 2,079 |
| 2014 | Q2 | 1,318 | 627 | 560 | 215 | 2,720 |
| 2014 | Q3 | 1,404 | 716 | 649 | 163 | 2,932 |
| 2014 | Q4 | 1,702 | 603 | 683 | 210 | 3,198 |
| Year | 5,518 | 2,368 | 2,290 | 753 | 10,929 | |
| 2015 | Q1 | 1,371 | 342 | 742 | 179 | 2,634 |
| 2015 | Q2 | 1,570 | 453 | 746 | 210 | 2,979 |
| 2015 | Q3 | 2,033 | 384 | 670 | 194 | 3,281 |
| 2015 | Q4 | 2,245 | 492 | 730 | 262 | 3,729 |
| Year | 7,219 | 1,671 | 2,888 | 845 | 12,623 | |
| 2016 | Q1 | 1,972 | 502 | 480 | 196 | 3,150 |
| 2016 | Q2 | 2,394 | 363 | 521 | 208 | 3,486 |
| 2016 | Q3 | 2,479 | 560 | 637 | 198 | 3,874 |
| 2016 | Q4 | 3,016 | 441 | 716 | 240 | 4,413 |
| Year | 9,861 | 1,866 | 2,354 | 842 | 14,923 | |
| 2017 | Q1 | 2,763 | 370 | 551 | 218 | 3,902 |
| 2017 | Q2 | 3,259 | 419 | 653 | 235 | 4,566 |
| 2017 | Q3 | 3,762 | 320 | 689 | 220 | 4,991 |
| 2017 | Q4 | 4,554 | 262 | 632 | 278 | 5,726 |
| Year | 14,338 | 1,371 | 2,525 | 951 | 19,185 | |
| 2018 | Q1 | 3,459 | 212 | 570 | 216 | 4,457 |
| 2018 | Q2 | 4,392 | 182 | 649 | 237 | 5,460 |
| 2018 | Q3 | 4,627 | 188 | 709 | 215 | 5,739 |
| 2018 | Q4 | 5,429 | 308 | 753 | 239 | 6,729 |
| Year | 17,907 | 890 | 2,681 | 907 | 22,385 | |
| 2019 | Q1 | 4,246 | 176 | 597 | 260 | 5,279 |
| 2019 | Q2 | 4,801 | 152 | 640 | 194 | 5,787 |
| 2019 | Q3 | 5,645 | 190 | 627 | 217 | 6,679 |
| 2019 | Q4 | 6,376 | 213 | 741 | 184 | 7,514 |
| Year | 21,068 | 731 | 2,605 | 855 | 25,259 | |
| 2020 | Q1 | 4,928 | 126 | 623 | 242 | 5,919 |
| 2020 | Q2 | 3,230 | 78 | 416 | 166 | 3,890 |
| 2020 | Q3 | 5,045 | 116 | 693 | 242 | 6,096 |
| 2020 | Q4 | 7,329 | 240 | 759 | 310 | 8,638 |
| Year | 20,532 | 560 | 2,491 | 960 | 24,543 | |
| 2021 | Q1 | 3,929 | 143 | 617 | 299 | 4,988 |
| 2021 | Q2 | 4,989 | 128 | 654 | 241 | 6,012 |
| 2021 | Q3 | 4,656 | 96 | 616 | 267 | 5,635 |
| Table 5: ESB by type of connection and NUTS3, Q3 2021 1 | |||||
| Region | New dwelling completions | UFHD | Reconnection | Non-Dwelling | Total ESB connections |
| Border | 257 | 16 | 111 | 36 | 420 |
| Dublin | 1,235 | 2 | 41 | 12 | 1,290 |
| Mid-East | 1,203 | 8 | 102 | 41 | 1,354 |
| Midlands | 223 | 5 | 49 | 28 | 305 |
| Mid-West | 299 | 19 | 59 | 39 | 416 |
| South-East | 384 | 14 | 52 | 23 | 473 |
| South-West | 673 | 21 | 94 | 46 | 834 |
| West | 382 | 11 | 108 | 42 | 543 |
| Total regions | 4,656 | 96 | 616 | 267 | 5,635 |
| 1 NUTS3 region based on substation of dwelling where available | |||||
| Table 6: New dwelling completions by average floor size, 2011 - Q3 2021 | |||||||||||
| 2011 | 2012 | 2013 | 2014 | 2015 | 2016 | 2017 | 2018 | 2019 | 2020 | Q1-Q3 2021 | |
| Estimated weight in mix (%) | . | ||||||||||
| Single | 69% | 71% | 64% | 54% | 45% | 37% | 30% | 26% | 24% | 24% | 24% |
| Scheme | 19% | 20% | 25% | 33% | 46% | 51% | 55% | 61% | 59% | 57% | 53% |
| Apartment | 12% | 9% | 10% | 14% | 9% | 12% | 15% | 13% | 17% | 19% | 22% |
| Estimated average size of dwelling (sqm) | |||||||||||
| Single | 231 | 232 | 239 | 224 | 219 | 230 | 226 | 223 | 225 | 219 | 209 |
| Scheme | 108 | 115 | 125 | 142 | 137 | 135 | 129 | 126 | 123 | 120 | 114 |
| Apartment | 73 | 69 | 77 | 75 | 84 | 77 | 82 | 83 | 83 | 80 | 80 |
| Average dwelling size (sqm) | 188.2 | 194.1 | 193.2 | 176.8 | 169.2 | 163.5 | 150.4 | 146.3 | 140.6 | 136.1 | 129.8 |
| Average dwelling size index (2016 = 100) | 115 | 119 | 118 | 108 | 103 | 100 | 92 | 89 | 86 | 83 | 79 |
| % change | 3.2% | -0.5% | -8.5% | -4.3% | -3.4% | -8.0% | -2.7% | -3.9% | -3.2% | -4.6% | |
The New Dwelling Completions series is produced by the CSO on a quarterly basis. A Housing Analytics Group (HAG) was established in 2017 by the Department of Housing, Planning and Local Government (DHPLG). This group, which met for the first time in May 2017, consists of representatives of bodies with a significant interest and role in housing, housing policy and related policy areas.
The HAG focused on a review of housing related data published nationally and in particular on the number of dwellings built every year. Arising from the work of this group and other direct discussions between the CSO and DHPLG, a significant outcome was to assess the suitability of current housing indicators for estimating the number of new dwelling completions in Ireland.
Historically, the number of new dwellings built in Ireland, as published by the DHPLG, was based on the number of connections to the ESB Network. However, in recent years it became apparent that this series was overestimating the levels of new dwelling construction in Ireland. The New Dwelling Completions series will look to replace this and other available indicators of housing activity in Ireland. This series will include information on dwelling type, urban/rural location, activity by Local Authority and by Eircode Routing Key (and now Local Electoral Area). It will continue to be based on domestic ESB connections but will correct for over-coverage by using additional information from ESB Networks and incorporating data from other sources. It also includes data on the number of reconnections and on houses from unfinished housing developments that are coming back into use. This will provide policy-makers with a valuable insight into the number of new dwellings available for occupation in the quarterly period concerned and also show data on the numbers of dwellings being constructed.
The New Dwelling Completions data series is based on the number of new dwellings connected by the ESB Network to the electricity supply and may not accord precisely with geographical boundaries. The NDC series is split into local authorities, Eircode Routing Keys and Local Electoral Areas based on the information of the substation rather than the exact location of the dwelling. As Eircode becomes available as the unique identifier, it will replace the source of identifying the location of a new dwelling.
The breakdown of ESB connections by type of connection and dwelling is based on NUTS3 regions as described below:
ESB connections are classified into four categories:
The dwelling type is defined by the ESB Network and classified into three categories:
The classification of urban and rural dwellings is also defined by the ESB Network and based on the Distribution Use of System (DUoS) tariff, which is a fee that ESB Networks charge Electricity Suppliers for use of the Electricity Distribution System1.
Only domestic connections where a dwelling is a self-contained unit of living accommodation are included in the New Dwelling Completions series. Commercial properties, shared and communal living arrangements are excluded.
The New Dwelling Completions series is a new statistical product compiled from third party data sources. The series will be revised on an ongoing basis as more timely and accurate data sources become available and these data sources can be matched to the ESB new connections data set. BER Assessment data is used to validate the status of New Dwelling Completions, reconnections, UFHDs and non-dwellings. This will result in regular revisions to previous quarters due to the time lag between ESB connections and BER assessment. Historical data within the current release and PxStat interactive tables are impacted by revisions but data within archived releases has not been revised.
The primary data source used for the New Dwellings Completions series is the ESB domestic connections dataset where the date that the connection is energized determines the date of completion. It is accepted that the ESB domestic connections dataset overestimates new dwellings and the CSO has adjusted for this overcount by using additional information from the ESB and other data sources. The ESB domestic connections dataset is matched by the CSO to Building Energy Rating (BER) data, compiled by the Sustainable Energy Authority Ireland (SEAI). Under the Statutory Instrument (S.I.) No. 243 of 2012, all residential property for sale must disclose their BER assessment (with some very minor exceptions). The BER includes detailed information on the type of dwelling, the type of certificate (Provisional, Final, Existing) as well as the date of assessment and construction. As the collection, storage and maintenance of Eircode improve, other data sources can be further consulted to improve the accuracy of the series.
The average new dwelling size index is based on measurements of the total floor area recorded by a BER Assessor in accordance with the BER Regulations, the BER Assessor's Code of Practice and all other directions issued by the SEAI2. As an MPRN, the unique identifier for an ESB connection is required for the BER certification process it is possible to link new housing completions data to BER certificates to produce the index. The match rate between new dwelling completions and BER certificates is consistently highest among scheme dwellings. Table 7 shows the percentage of new dwelling completions that can be matched to a BER certificate by dwelling type and year. Between 2015 and 2020, 95% of scheme dwellings had a BER certificate compared to about a quarter of single dwellings. The match rate for apartments has increased in recent years and stood at 82% in 2020.
| Table 7: New dwelling completions and BER match rate, 2011 - Q3 2021 | ||||
| Period | Single | Scheme | Apartment | Overall match rate |
| 2011 | 16% | 74% | 46% | 31% |
| 2012 | 16% | 79% | 29% | 29% |
| 2013 | 17% | 80% | 48% | 36% |
| 2014 | 17% | 87% | 61% | 46% |
| 2015 | 22% | 90% | 28% | 53% |
| 2016 | 24% | 90% | 50% | 61% |
| 2017 | 25% | 94% | 69% | 69% |
| 2018 | 23% | 94% | 68% | 72% |
| 2019 | 25% | 95% | 77% | 75% |
| 2020 | 23% | 95% | 82% | 75% |
| Q1-Q3 2021 | 8% | 84% | 57% | 59% |
While the time lag between connection to the ESB network and BER assessment can explain missing BER certificates, the data in Table 7 indicates that there are additional factors at play for single dwellings and apartments.
The low match rate for single dwellings is due to the large number of self builds where dwellings are not intended for sale or rent, similarly, the low match rate for apartments can be explained by dwellings not intended for sale. These include conversions from single dwellings as well as social housing and developments in the build-to-rent sector. Such developments will often have a range of provisional BER certificates or a partial number of BERs for the development without having a final BER for all properties.
1 Rules for Application of DUoS Tariff Group
 Hide Background Notes and Methodology
Scan the QR code below to view this release online or go to
http://www.cso.ie/en/releasesandpublications/er/ndc/newdwellingcompletionsq32021/
 Show Table 1: New dwelling completions by type of dwelling, 2011 - Q3 2021
 Hide Table 1: New dwelling completions by type of dwelling, 2011 - Q3 2021