
| Number of new dwelling completions | ||||
| Single | Scheme | Apartment | Totals | |
| Quarter 3 2017 | 1,131 | 2,005 | 650 | 3,786 |
| Quarter 3 2018 | 1,208 | 2,821 | 644 | 4,673 |
| % change | 6.8% | 40.7% | -0.9% | 23.4% |
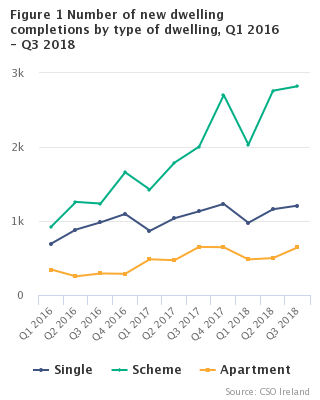
In the third quarter of 2018, there were 4,673 new dwelling completions, compared with 3,786 completions in the same period last year, an increase of 23.4%. This brings the total number of new dwellings completed in 2018 to 12,582, an increase of 27.7% to 2017 where 9,856 dwellings were completed in the first three quarters of that year.
The third quarter figures also show that:
ESB domestic connections dataset used as primary sourceThe primary data source used for the New Dwellings Completions series is the ESB Networks new domestic connections dataset where the date that the connection is energised determines the date of completion. It is accepted that the ESB domestic connections dataset is overestimating new dwellings and the CSO has adjusted for this overcount by using additional information from the ESB and other data sources. ESB connections are classified into four categories: new dwelling completions, UFHDs, reconnections and non-dwellings. The dwelling type (single, scheme, apartment) and urban-rural divide is defined by the ESB Network. See Background Notes and Methodology for a more detailed discussion of the classification. The New Dwelling Completions series is based on the number of domestic dwellings connected by the ESB Network to the electricity supply and may not accord precisely with Local Authority or Eircode Routing Key boundaries. The CSO has utilised other available data sources to validate and enhance the ESB connections dataset. However, this was only possible where the connections dataset could be confidently linked to another dataset using unique identifiers or by address matching. As the level of Eircode collection, coverage and storage increases across data sources in the housing sector, it is expected that the precision of estimates on new dwelling completions can be further enhanced. Student accommodationThere has been a significant level of construction output in the student accommodation sector. These are generally connected to the ESB Network as commercial connections and are therefore not included in the ESB domestic connections dataset and have also not been included in ESB connections released by DHPLG. The data available on this sector is on a “bed space” basis and it is not currently possible to report on it as dwellings, which are self-contained units of living accommodation. Based on consultation with stakeholders in this sector, student accommodation may be included in future New Dwelling Completions reports as a separate category. In Q3 2018, 2,447 bed spaces were completed in the student accommodation sector which brings the total completed since Q2 2016 to 5,531. Table NDQ04 has been corrected on 1st February 2019 to show the correct sum of total ESB connections for 2011 and 2014. |
The ESB domestic connections dataset provides information on the type of connection and whether it is in an urban or rural area. Figure 2 below shows that in Q3 2018, more than three quarters of all new dwelling completions (78.7%) are urban with 21.3% being in rural areas compared to Q3 2017 when 75.1% were urban and 24.9% rural. See Table 2.
| Urban | Rural | |
| Q1 2016 | 1405 | 559 |
| Q2 2016 | 1661 | 733 |
| Q3 2016 | 1692 | 817 |
| Q4 2016 | 2137 | 903 |
| Q1 2017 | 2074 | 701 |
| Q2 2017 | 2443 | 852 |
| Q3 2017 | 2845 | 941 |
| Q4 2017 | 3603 | 976 |
| Q1 2018 | 2689 | 801 |
| Q2 2018 | 3444 | 975 |
| Q3 2018 | 3679 | 994 |
The number of new dwelling completions was highest in Dublin at 1,872 followed by the Mid-East at 980 completions. These two regions combined also accounted for 73.8% of all scheme dwellings completed in Q3 2018. Apart from Dublin, Meath County Council, Kildare County Council and Cork County Council record more than 200 new scheme dwellings each in Q3 2018. The South-West was the region with the most single dwellings completed, led by Cork County Council where 133 new single dwellings were completed. There were 483 new apartments completed in Dublin which accounted for three quarters of all new apartments in Q3 2018. See Table 3.
In Q3 2018, the Eircode area with the most new dwelling completions was D15 'Dublin 15' (206) followed by W91 'Naas' (173) and C15 'Navan' (157). Nine out of the top ten Eircode Routing Keys with the most new dwelling completions are in Dublin and its commuter belts accounting for 31% of all new dwelling completions. See Figure 3.
Domestic ESB connections in Q3 2018 totalled 5,739, an increase of 15% on Q3 2017. The ESB domestic connections series shows a comparable trend to the NDC series compiled by the CSO as shown in Figure 4. However, there is a significant difference in volume between the two series. The starting point for the NDC series is the ESB domestic connections dataset, with adjustments made to account for previously finished houses in unfinished housing developments (UFHDs), reconnections and non-dwellings as shown in Figure 5 and Table 4.
| New dwelling completions | ESB connections | |
| Q1 2016 | 1964 | 3150 |
| Q2 2016 | 2394 | 3486 |
| Q3 2016 | 2509 | 3874 |
| Q4 2016 | 3040 | 4413 |
| Q1 2017 | 2775 | 3902 |
| Q2 2017 | 3295 | 4566 |
| Q3 2017 | 3786 | 4991 |
| Q4 2017 | 4579 | 5726 |
| Q1 2018 | 3490 | 4457 |
| Q2 2018 | 4419 | 5460 |
| Q3 2018 | 4673 | 5739 |
The number of previously finished dwellings in unfinished housing developments (UFHDs) dropped from 253 in Q3 2017 to 187 in Q3 2018, a decline of 26.1%. From the peak in Q3 2014 when 716 UFHDs were connected to the ESB Network, UFHDs have decreased by 73.9%. A property which is reconnected to the ESB network after having been disconnected for more than two years, is assigned a new MPRN and is therefore included in the ESB connections datasets. These reconnections decreased by 10.3% to stand at 654 in Q3 2018. The number of non-dwellings has increased slightly by 0.9%. See Figure 5 and Table 4.
| UFHD | Reconnection | Non-dwelling | |
| Q1 2016 | 409 | 579 | 198 |
| Q2 2016 | 286 | 599 | 207 |
| Q3 2016 | 508 | 667 | 190 |
| Q4 2016 | 398 | 738 | 237 |
| Q1 2017 | 313 | 592 | 222 |
| Q2 2017 | 315 | 724 | 232 |
| Q3 2017 | 253 | 729 | 223 |
| Q4 2017 | 203 | 659 | 285 |
| Q1 2018 | 176 | 558 | 233 |
| Q2 2018 | 185 | 613 | 243 |
| Q3 2018 | 187 | 654 | 225 |
Table 5 shows the type of ESB connection by NUTS3 region. Border (114) and West (94) regions show the highest number of reconnections. In Q3 2018, the South-West shows the highest number of UFHDs at 37. Dublin and Mid-East combined make up 61% of all new dwelling completions in Q3 2018. Non-dwellings are highest in the South-West (55) and the West (40).
| Table 1 New dwelling completions, classified by type of dwelling, 2011 - Q3 2018 | |||||
| Period | Single | Scheme | Apartment | Totals | |
| 2011 | Q1 | 1,156 | 447 | 272 | 1,875 |
| 2011 | Q2 | 1,194 | 380 | 217 | 1,791 |
| 2011 | Q3 | 1,197 | 305 | 185 | 1,687 |
| 2011 | Q4 | 1,267 | 226 | 148 | 1,641 |
| Year | 4,814 | 1,358 | 822 | 6,994 | |
| 2012 | Q1 | 797 | 211 | 123 | 1,131 |
| 2012 | Q2 | 847 | 194 | 76 | 1,117 |
| 2012 | Q3 | 868 | 244 | 93 | 1,205 |
| 2012 | Q4 | 989 | 315 | 154 | 1,458 |
| Year | 3,501 | 964 | 446 | 4,911 | |
| 2013 | Q1 | 638 | 174 | 77 | 889 |
| 2013 | Q2 | 721 | 281 | 144 | 1,146 |
| 2013 | Q3 | 727 | 267 | 39 | 1,033 |
| 2013 | Q4 | 861 | 433 | 213 | 1,507 |
| Year | 2,947 | 1,155 | 473 | 4,575 | |
| 2014 | Q1 | 625 | 309 | 160 | 1,094 |
| 2014 | Q2 | 712 | 365 | 241 | 1,318 |
| 2014 | Q3 | 728 | 506 | 170 | 1,404 |
| 2014 | Q4 | 910 | 615 | 177 | 1,702 |
| Year | 2,975 | 1,795 | 748 | 5,518 | |
| 2015 | Q1 | 659 | 606 | 106 | 1,371 |
| 2015 | Q2 | 735 | 674 | 161 | 1,570 |
| 2015 | Q3 | 879 | 899 | 255 | 2,033 |
| 2015 | Q4 | 979 | 1,115 | 151 | 2,245 |
| Year | 3,252 | 3,294 | 673 | 7,219 | |
| 2016 | Q1 | 695 | 925 | 344 | 1,964 |
| 2016 | Q2 | 884 | 1,258 | 252 | 2,394 |
| 2016 | Q3 | 982 | 1,236 | 291 | 2,509 |
| 2016 | Q4 | 1,095 | 1,658 | 287 | 3,040 |
| Year | 3,656 | 5,077 | 1,174 | 9,907 | |
| 2017 | Q1 | 867 | 1,425 | 483 | 2,775 |
| 2017 | Q2 | 1,037 | 1,788 | 470 | 3,295 |
| 2017 | Q3 | 1,131 | 2,005 | 650 | 3,786 |
| 2017 | Q4 | 1,231 | 2,702 | 646 | 4,579 |
| Year | 4,266 | 7,920 | 2,249 | 14,435 | |
| 2018 | Q1 | 976 | 2,033 | 481 | 3,490 |
| 2018 | Q2 | 1,159 | 2,761 | 499 | 4,419 |
| 2018 | Q3 | 1,208 | 2,821 | 644 | 4,673 |
| Table 2 New dwelling completions, by urban v rural, 2011 - Q3 2018 | ||||
| Period | Urban | Rural | Totals | |
| 2011 | Q1 | 841 | 1,033 | 1,874 |
| 2011 | Q2 | 706 | 1,081 | 1,787 |
| 2011 | Q3 | 602 | 1,085 | 1,687 |
| 2011 | Q4 | 489 | 1,152 | 1,641 |
| Year | 2,638 | 4,351 | 6,989 | |
| 2012 | Q1 | 415 | 716 | 1,131 |
| 2012 | Q2 | 368 | 749 | 1,117 |
| 2012 | Q3 | 425 | 778 | 1,203 |
| 2012 | Q4 | 602 | 854 | 1,456 |
| Year | 1,810 | 3,097 | 4,907 | |
| 2013 | Q1 | 329 | 560 | 889 |
| 2013 | Q2 | 534 | 611 | 1,145 |
| 2013 | Q3 | 398 | 635 | 1,033 |
| 2013 | Q4 | 774 | 733 | 1,507 |
| Year | 2,035 | 2,539 | 4,574 | |
| 2014 | Q1 | 540 | 554 | 1,094 |
| 2014 | Q2 | 716 | 602 | 1,318 |
| 2014 | Q3 | 795 | 609 | 1,404 |
| 2014 | Q4 | 912 | 790 | 1,702 |
| Year | 2,963 | 2,555 | 5,518 | |
| 2015 | Q1 | 832 | 539 | 1,371 |
| 2015 | Q2 | 952 | 618 | 1,570 |
| 2015 | Q3 | 1,281 | 751 | 2,032 |
| 2015 | Q4 | 1,420 | 824 | 2,244 |
| Year | 4,485 | 2,732 | 7,217 | |
| 2016 | Q1 | 1,405 | 559 | 1,964 |
| 2016 | Q2 | 1,661 | 733 | 2,394 |
| 2016 | Q3 | 1,692 | 817 | 2,509 |
| 2016 | Q4 | 2,137 | 903 | 3,040 |
| Year | 6,895 | 3,012 | 9,907 | |
| 2017 | Q1 | 2,074 | 701 | 2,775 |
| 2017 | Q2 | 2,443 | 852 | 3,295 |
| 2017 | Q3 | 2,845 | 941 | 3,786 |
| 2017 | Q4 | 3,603 | 976 | 4,579 |
| Year | 10,965 | 3,470 | 14,435 | |
| 2018 | Q1 | 2,689 | 801 | 3,490 |
| 2018 | Q2 | 3,444 | 975 | 4,419 |
| 2018 | Q3 | 3,679 | 994 | 4,673 |
| Table 3 New dwelling completions by type of dwelling and Local Authority, Q3 2018 | ||||
| Local Authority | Single | Scheme | Apartment | Totals |
| Border | 176 | 87 | 11 | 274 |
| Cavan | 23 | 16 | 0 | 39 |
| Donegal | 86 | 39 | 11 | 136 |
| Leitrim | 9 | 10 | 0 | 19 |
| Monaghan | 30 | 6 | 0 | 36 |
| Sligo | 28 | 16 | 0 | 44 |
| West | 194 | 57 | 17 | 268 |
| Galway City | 9 | 11 | 0 | 20 |
| Galway County | 101 | 18 | 2 | 121 |
| Mayo | 61 | 17 | 0 | 78 |
| Roscommon | 23 | 11 | 15 | 49 |
| Mid-West | 131 | 86 | 14 | 231 |
| Clare | 50 | 25 | 2 | 77 |
| Limerick | 45 | 54 | 12 | 111 |
| Tipperary | 36 | 7 | 0 | 43 |
| South-East | 146 | 171 | 29 | 346 |
| Carlow | 14 | 22 | 2 | 38 |
| Kilkenny | 30 | 9 | 16 | 55 |
| Waterford | 28 | 77 | 11 | 116 |
| Wexford | 74 | 63 | 0 | 137 |
| South-West | 201 | 308 | 60 | 569 |
| Cork City | 7 | 29 | 39 | 75 |
| Cork County | 133 | 228 | 16 | 377 |
| Kerry | 61 | 51 | 5 | 117 |
| Dublin | 82 | 1,307 | 483 | 1,872 |
| Dublin City Council | 22 | 231 | 308 | 561 |
| Dún Laoghaire–Rathdown | 25 | 167 | 175 | 367 |
| Fingal | 24 | 491 | 0 | 515 |
| South Dublin | 11 | 418 | 0 | 429 |
| Mid-East | 187 | 776 | 17 | 980 |
| Louth | 37 | 96 | 4 | 137 |
| Kildare | 45 | 267 | 8 | 320 |
| Meath | 73 | 320 | 5 | 398 |
| Wicklow | 32 | 93 | 0 | 125 |
| Midlands | 91 | 29 | 13 | 133 |
| Laois | 30 | 23 | 3 | 56 |
| Longford | 8 | 4 | 5 | 17 |
| Offaly | 20 | 0 | 5 | 25 |
| Westmeath | 33 | 2 | 0 | 35 |
| Note: Local Authority based on substation of dwelling where available | ||||
| Table 4 ESB connection by type of connection, 2011 - Q3 2018 | ||||||
| Period | NDC | UFHD | Reconnection | Non-Dwelling | Totals | |
| 2011 | Q1 | 1,875 | 383 | 241 | 205 | 2,740 |
| 2011 | Q2 | 1,791 | 331 | 224 | 209 | 2,555 |
| 2011 | Q3 | 1,687 | 326 | 299 | 195 | 2,507 |
| 2011 | Q4 | 1,641 | 338 | 326 | 218 | 2,523 |
| Year | 6,994 | 1,378 | 1,090 | 827 | 10,289 | |
| 2012 | Q1 | 1,131 | 278 | 302 | 179 | 1,890 |
| 2012 | Q2 | 1,117 | 357 | 294 | 196 | 1,964 |
| 2012 | Q3 | 1,205 | 431 | 271 | 163 | 2,070 |
| 2012 | Q4 | 1,458 | 385 | 393 | 185 | 2,421 |
| Year | 4,911 | 1,451 | 1,260 | 723 | 8,345 | |
| 2013 | Q1 | 889 | 354 | 280 | 156 | 1,679 |
| 2013 | Q2 | 1,146 | 323 | 347 | 161 | 1,977 |
| 2013 | Q3 | 1,033 | 393 | 392 | 144 | 1,962 |
| 2013 | Q4 | 1,507 | 436 | 454 | 192 | 2,589 |
| Year | 4,575 | 1,506 | 1,473 | 653 | 8,207 | |
| 2014 | Q1 | 1,094 | 422 | 398 | 165 | 2,079 |
| 2014 | Q2 | 1,318 | 627 | 560 | 215 | 2,720 |
| 2014 | Q3 | 1,404 | 716 | 649 | 163 | 2,932 |
| 2014 | Q4 | 1,702 | 603 | 683 | 210 | 3,198 |
| Year | 5,518 | 2,368 | 2,290 | 753 | 10,929 | |
| 2015 | Q1 | 1,371 | 342 | 742 | 179 | 2,634 |
| 2015 | Q2 | 1,570 | 453 | 746 | 210 | 2,979 |
| 2015 | Q3 | 2,033 | 384 | 670 | 194 | 3,281 |
| 2015 | Q4 | 2,245 | 492 | 730 | 262 | 3,729 |
| Year | 7,219 | 1,671 | 2,888 | 845 | 12,623 | |
| 2016 | Q1 | 1,964 | 409 | 579 | 198 | 3,150 |
| 2016 | Q2 | 2,394 | 286 | 599 | 207 | 3,486 |
| 2016 | Q3 | 2,509 | 508 | 667 | 190 | 3,874 |
| 2016 | Q4 | 3,040 | 398 | 738 | 237 | 4,413 |
| Year | 9,907 | 1,601 | 2,583 | 832 | 14,923 | |
| 2017 | Q1 | 2,775 | 313 | 592 | 222 | 3,902 |
| 2017 | Q2 | 3,295 | 315 | 724 | 232 | 4,566 |
| 2017 | Q3 | 3,786 | 253 | 729 | 223 | 4,991 |
| 2017 | Q4 | 4,579 | 203 | 659 | 285 | 5,726 |
| Year | 14,435 | 1,084 | 2,704 | 962 | 19,185 | |
| 2018 | Q1 | 3,490 | 176 | 558 | 233 | 4,457 |
| 2018 | Q2 | 4,419 | 185 | 613 | 243 | 5,640 |
| 2018 | Q3 | 4,673 | 187 | 654 | 225 | 5,739 |
| Table 5 ESB by type of connections and NUTS3, Q3 2018 | |||||
| Region | New dwelling completions | UFHD | Reconnection | Non-Dwelling | Totals |
| Border | 274 | 27 | 114 | 24 | 439 |
| Dublin | 1,872 | 15 | 75 | 2 | 1,964 |
| Mid-East | 980 | 20 | 72 | 23 | 1,095 |
| Midlands | 133 | 13 | 51 | 25 | 222 |
| Mid-West | 231 | 16 | 77 | 30 | 354 |
| South-East | 346 | 23 | 92 | 26 | 487 |
| South-West | 569 | 37 | 79 | 55 | 740 |
| West | 268 | 36 | 94 | 40 | 438 |
| Note: NUTS3 region based on substation of dwelling where available | |||||
The New Dwelling Completions series is produced by the CSO on a quarterly basis. A Housing Analytics Group (HAG) was established in 2017 by the Department of Housing, Planning and Local Government (DHPLG). This group, which met for the first time in May 2017, consists of representatives of bodies with a significant interest and role in housing, housing policy and related policy areas.
The HAG focused on a review of housing related data published nationally and in particular on the number of dwellings built every year. Arising from the work of this group and other direct discussions between the CSO and DHPLG, a significant outcome was to assess the suitability of current housing indicators for estimating the number of new dwelling completions in Ireland.
Historically, the number of new dwellings built in Ireland, as published by the DHPLG, was based on the number of connections to the ESB Network. However, in recent years it became apparent that this series was overestimating the levels of new dwelling construction in Ireland. The New Dwelling Completions series will look to replace this and other available indicators of housing activity in Ireland. This series will include information on dwelling type, urban/rural location, activity by Local Authority and by Eircode Routing Key. It will continue to be based on domestic ESB connections but will correct for over-coverage by using additional information from ESB Networks and incorporating data from other sources. It also includes data on the number of reconnections and on houses from unfinished housing developments that are coming back into use. This will provide policy-makers with a valuable insight into the number of new dwellings available for occupation in the quarterly period concerned and also show data on the numbers of dwellings being constructed.
The New Dwelling Completions data series is based on the number of new dwellings connected by the ESB Network to the electricity supply and may not accord precisely with Local Authority or Eircode Routing Key boundaries. The NDC series is split into counties and Eircode Routing Keys based on the information of the substation rather than the exact location of the dwelling. As Eircode becomes available as the unique identifier, it will replace the source of identifying the location of a new dwelling.
The breakdown of ESB connections by type of connection and dwelling is based on NUTS3 regions as described below:
ESB connections are classified into four categories:
The dwelling type is defined by the ESB Network and classified into three categories:
The classification of urban and rural dwellings is also defined by the ESB Network and based on the Distribution Use of System (DUoS) tariff, which is a fee that ESB Networks charge Electricity Suppliers for use of the Electricity Distribution System3.
Only domestic connections where a dwelling is a self-contained unit of living accommodation is included in the New Dwelling Completions series. Commercial properties, shared and communal living arrangements are excluded.
The primary data source used for the New Dwellings Completions series is the ESB domestic connections dataset where the date that the connection is energised determines the date of completion. It is accepted that the ESB domestic connections dataset overestimates new dwellings and the CSO has adjusted for this overcount by using additional information from the ESB and other data sources. The ESB domestic connections dataset is matched by the CSO to Building Energy Rating (BER) data, compiled by the Sustainable Energy Authority Ireland (SEAI). Under Statutory Instrument (S.I.) No. 243 of 2012, all residential property for sale must disclose their BER assessment (with some very minor exceptions). The BER includes detailed information on the type of dwelling, the type of certificate (Provisional, Final, Existing) as well as the date of assessment and construction. As the collection, storage and maintenance of Eircode improves, other data sources can be further consulted to improve on the accuracy of the series.
The New Dwelling Completions series is a new statistical product compiled from third party data sources. The series will be revised on an ongoing basis as more timely and accurate data sources become available and these data sources can be matched to the ESB new connections data set.
3 Rules for Application of DUoS Tariff Group: https://www.esbnetworks.ie/docs/default-source/publications/rules-for-application-of-duos-tariff-group.pdf?sfvrsn=a44b33f0_4
 Hide Background Notes and Methodology
Scan the QR code below to view this release online or go to
http://www.cso.ie/en/releasesandpublications/er/ndc/newdwellingcompletionsq32018/
 Show Table 1 New dwelling completions by type of dwelling, 2011 - Q3 2018
 Hide Table 1 New dwelling completions by type of dwelling, 2011 - Q3 2018