
The number of non-domestic BER audits performed in certain months have been adversely impacted by the COVID-19 pandemic. For further information please see the SEAI website.
| Table A: Number of Non-Domestic BER certificates | ||||||
| number | ||||||
| Period | 2017 | 2018 | 2019 | 2020 | 2021 | % change 2021/2020 |
| Quarter 1 | 1,573 | 1,305 | 1,047 | 956 | 840 | -12% |
| Quarter 2 | 1,447 | 1,215 | 1,096 | 444 | 877 | 98% |
| Quarter 3 | 1,536 | 1,131 | 1,070 | 879 | 1,122 | 28% |
| Quarter 4 | 1,608 | 1,009 | 1,033 | 1,024 | 1,120 | 9% |
| Year | 6,164 | 4,660 | 4,246 | 3,303 | 3,959 | 20% |
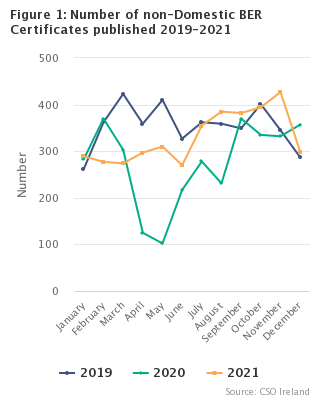
There was an increase in the number of non-domestic Building Energy Rating (BER) audits reported in 2021 when the number of completed audits was 20% above the number in 2020 (see Table A, Table 1, Figure 1 and Information Note). There were 1,120 BER audits reported in quarter four 2021 compared with 1,024 in quarter four 2020. This is an increase of 9% (see Table A).
BER audits were conducted for 1,623 non-domestic buildings constructed between 2015 and 2021 (see Table 13). Over one fifth (21%) of these buildings received an “A” rating compared with 8% of non-domestic buildings constructed during 2010 to 2014 (see Figure 4). In contrast, 98% of domestic dwellings constructed between 2015-2021 received an "A" rating (separate CSO release).
There were 66,393 non-domestic BER audits conducted in the period 2009 to 2021 (see Table 1). The profile of non-domestic BER audits conducted since 2009 was 2% awarded an "A" rating, 13% a "B" rating, and 34% with a “C” rating (see Table 3).
The most energy efficient building types audited during 2009-2021 were Schools and colleges with 31% awarded an “A” rating (see Table 3). The second most energy efficient buildings were Nursing residential homes and hostels with 10% rated “A”. The least energy efficient building types, defined by a “G” rating, were Workshops and maintenance depots (23%) followed by Other Buildings (20%) (see Figure 3).
The highest proportion of combined “A” and “B” ratings was in County Kildare at 22% (see Table 4). County Kilkenny had the highest proportion of “G” rated buildings at 18% (see Table 4).
In Dublin city, Dublin 15 had the highest proportion of combined “A” and “B” ratings at 24% followed by 19% for Dublin 13 and Dublin 18 (see Table 5). The highest proportion of “G” ratings was 18% in Dublin 6W and Dublin 8 (see Table 5).
The average floor area of all audited non-domestic dwellings was 692 square metres (see Table 10). This average size varied from 3,223 square metres for hotels to 291 square metres for Restaurants and public houses.
|
BER certificates expire after ten years unless a new audit has been undertaken. This means that many of the 2009 certificates expired in 2019. The CSO has included these expired certificates in this release. The period of construction is not yet available for audits undertaken in 2020-2021. This information will be added when it becomes available. |
| BER Ratings | |
| A | 1.229 |
| B | 8.975 |
| C | 21.422 |
| D | 13.753 |
| E | 7.243 |
| F | 4.248 |
| G | 8.205 |
| A | B | C | D | E | F | G | |
| Retail | 1 | 14 | 39 | 18 | 10 | 6 | 13 |
| Office | 2 | 9 | 30 | 24 | 13 | 8 | 14 |
| Restaurant/public house | 0 | 7 | 30 | 35 | 17 | 6 | 4 |
| Hotel | 2 | 20 | 41 | 23 | 7 | 3 | 3 |
| Warehouses | 0 | 17 | 33 | 20 | 10 | 6 | 14 |
| Workshops/maintenance depot | 0 | 9 | 23 | 22 | 14 | 10 | 23 |
| Industrial process building | 3 | 33 | 27 | 15 | 10 | 3 | 9 |
| Hospitals and primary health care | 9 | 16 | 24 | 20 | 13 | 8 | 11 |
| Community/day centre | 6 | 26 | 30 | 17 | 8 | 5 | 9 |
| Nursing residential homes and hostels | 10 | 42 | 29 | 13 | 4 | 1 | 2 |
| Schools and colleges | 31 | 27 | 18 | 14 | 4 | 2 | 4 |
| Sports facilities | 3 | 30 | 29 | 17 | 7 | 6 | 8 |
| Other | 6 | 18 | 22 | 16 | 11 | 7 | 20 |
| A | B | C | D | E | F | G | |
| 1900-1977 | 0 | 6 | 29 | 27 | 16 | 9 | 13 |
| 1978-1999 | 0 | 12 | 37 | 23 | 12 | 7 | 10 |
| 2000-2004 | 0 | 16 | 43 | 19 | 8 | 4 | 8 |
| 2005-2009 | 1 | 20 | 36 | 16 | 7 | 5 | 16 |
| 2010-2014 | 8 | 29 | 28 | 15 | 7 | 4 | 8 |
| 2015-2021 | 21 | 35 | 18 | 10 | 4 | 2 | 11 |
| Table 1 BER Certificates (Non-Domestic) 2009-2021 | ||||||||||||||
| number | ||||||||||||||
| Period | 2009 | 2010 | 2011 | 2012 | 2013 | 2014 | 2015 | 2016 | 2017 | 2018 | 2019 | 2020 | 2021 | Total |
| January | 45 | 194 | 150 | 193 | 444 | 590 | 634 | 399 | 339 | 363 | 262 | 283 | 289 | 4,185 |
| February | 147 | 326 | 166 | 156 | 946 | 621 | 743 | 553 | 536 | 475 | 362 | 370 | 277 | 5,678 |
| March | 207 | 228 | 201 | 224 | 848 | 740 | 807 | 647 | 698 | 467 | 423 | 303 | 274 | 6,067 |
| April | 165 | 230 | 162 | 178 | 861 | 796 | 633 | 665 | 454 | 374 | 359 | 125 | 297 | 5,299 |
| May | 240 | 189 | 201 | 204 | 788 | 882 | 661 | 647 | 531 | 456 | 410 | 102 | 310 | 5,621 |
| June | 348 | 184 | 198 | 163 | 766 | 857 | 686 | 597 | 462 | 385 | 327 | 217 | 270 | 5,460 |
| July | 408 | 193 | 190 | 243 | 752 | 841 | 595 | 561 | 487 | 393 | 362 | 278 | 355 | 5,658 |
| August | 266 | 287 | 173 | 213 | 575 | 785 | 563 | 587 | 453 | 353 | 359 | 231 | 385 | 5,230 |
| September | 265 | 221 | 218 | 245 | 693 | 998 | 673 | 683 | 596 | 385 | 349 | 370 | 382 | 6,078 |
| October | 236 | 204 | 207 | 289 | 863 | 882 | 682 | 640 | 620 | 351 | 401 | 335 | 394 | 6,104 |
| November | 307 | 303 | 223 | 328 | 713 | 964 | 572 | 530 | 512 | 389 | 345 | 332 | 427 | 5,945 |
| December | 337 | 193 | 211 | 309 | 574 | 853 | 467 | 436 | 476 | 269 | 287 | 357 | 299 | 5,068 |
| Total | 2,971 | 2,752 | 2,300 | 2,745 | 8,823 | 9,809 | 7,716 | 6,945 | 6,164 | 4,660 | 4,246 | 3,303 | 3,959 | 66,393 |
| Table 2 BERs by Year (Non-Domestic) 2009-2021 | ||||||||||||||
| number | ||||||||||||||
| Year | Energy Rating | Total | ||||||||||||
| A | B1 | B2 | B3 | C1 | C2 | C3 | D1 | D2 | E1 | E2 | F | G | ||
| 2009 | 32 | 120 | 252 | 405 | 450 | 373 | 284 | 285 | 226 | 106 | 85 | 144 | 130 | 2,892 |
| 2010 | 24 | 66 | 189 | 275 | 349 | 359 | 288 | 308 | 207 | 127 | 122 | 132 | 174 | 2,620 |
| 2011 | 50 | 70 | 124 | 213 | 297 | 240 | 216 | 271 | 164 | 111 | 94 | 129 | 150 | 2,129 |
| 2012 | 40 | 54 | 117 | 208 | 380 | 335 | 288 | 324 | 251 | 172 | 126 | 157 | 256 | 2,708 |
| 2013 | 51 | 128 | 364 | 591 | 1,151 | 1,131 | 876 | 1,039 | 817 | 504 | 363 | 550 | 1,161 | 8,726 |
| 2014 | 49 | 125 | 318 | 674 | 1,226 | 1,148 | 905 | 1,206 | 913 | 621 | 517 | 665 | 1,349 | 9,716 |
| 2015 | 84 | 132 | 265 | 522 | 936 | 922 | 721 | 883 | 696 | 499 | 403 | 518 | 1,037 | 7,618 |
| 2016 | 90 | 107 | 242 | 480 | 771 | 800 | 638 | 840 | 625 | 482 | 376 | 482 | 914 | 6,847 |
| 2017 | 101 | 116 | 262 | 418 | 667 | 664 | 599 | 782 | 575 | 397 | 298 | 398 | 785 | 6,062 |
| 2018 | 111 | 110 | 225 | 330 | 471 | 530 | 448 | 526 | 439 | 326 | 219 | 299 | 541 | 4,575 |
| 2019 | 97 | 99 | 218 | 302 | 422 | 424 | 327 | 537 | 402 | 280 | 198 | 267 | 570 | 4,143 |
| 2020 | 178 | 72 | 99 | 191 | 237 | 282 | 283 | 346 | 280 | 193 | 174 | 247 | 579 | 3,161 |
| 2021 | 322 | 89 | 148 | 255 | 320 | 345 | 319 | 462 | 349 | 261 | 189 | 260 | 559 | 3,878 |
| Total | 1,229 | 1,288 | 2,823 | 4,864 | 7,677 | 7,553 | 6,192 | 7,809 | 5,944 | 4,079 | 3,164 | 4,248 | 8,205 | 65,075 |
| Table 3 BERs by Type of Building (Non-Domestic) 2009-2021 | ||||||||||||||
| % of row | ||||||||||||||
| Building Type | Energy Rating | Total | ||||||||||||
| A | B1 | B2 | B3 | C1 | C2 | C3 | D1 | D2 | E1 | E2 | F | G | ||
| Retail | 1 | 1 | 4 | 9 | 16 | 14 | 9 | 10 | 7 | 5 | 4 | 6 | 13 | 24,814 |
| Office | 2 | 2 | 3 | 5 | 8 | 11 | 11 | 13 | 11 | 7 | 6 | 8 | 14 | 15,057 |
| Restaurant/public house | 0 | 1 | 2 | 5 | 8 | 11 | 11 | 19 | 16 | 11 | 6 | 6 | 4 | 6,091 |
| Hotel | 2 | 3 | 8 | 9 | 14 | 14 | 13 | 14 | 9 | 5 | 2 | 3 | 3 | 910 |
| Warehouses | 0 | 2 | 6 | 9 | 12 | 12 | 9 | 11 | 8 | 5 | 5 | 6 | 14 | 8,531 |
| Workshops/maintenance depot | 0 | 1 | 3 | 6 | 7 | 8 | 8 | 13 | 9 | 8 | 6 | 10 | 23 | 2,367 |
| Industrial process building | 3 | 12 | 11 | 10 | 11 | 9 | 6 | 10 | 5 | 5 | 5 | 3 | 9 | 1,401 |
| Hospitals and primary health care | 9 | 4 | 6 | 5 | 7 | 9 | 8 | 11 | 9 | 7 | 6 | 8 | 11 | 1,203 |
| Community/day centre | 6 | 4 | 11 | 11 | 12 | 10 | 8 | 10 | 7 | 4 | 4 | 5 | 9 | 1,142 |
| Nursing residential homes and hostels | 10 | 10 | 16 | 16 | 13 | 10 | 6 | 7 | 6 | 3 | 1 | 1 | 2 | 606 |
| Schools and colleges | 31 | 9 | 8 | 9 | 7 | 6 | 5 | 8 | 6 | 2 | 2 | 2 | 4 | 1,179 |
| Sports facilities | 3 | 6 | 11 | 12 | 12 | 10 | 8 | 10 | 8 | 5 | 2 | 6 | 8 | 514 |
| Other | 6 | 5 | 6 | 7 | 10 | 7 | 6 | 10 | 6 | 5 | 6 | 7 | 20 | 1,260 |
| Total | 2 | 2 | 4 | 7 | 12 | 12 | 10 | 12 | 9 | 6 | 5 | 7 | 13 | 65,075 |
| Table 4 BERs by County (Non-Domestic) 2009-2021 | ||||||||||||||
| % of row | ||||||||||||||
| County | Energy Rating | Total | ||||||||||||
| A | B1 | B2 | B3 | C1 | C2 | C3 | D1 | D2 | E1 | E2 | F | G | ||
| Carlow | 1 | 3 | 7 | 10 | 15 | 13 | 9 | 10 | 6 | 5 | 4 | 3 | 13 | 834 |
| Dublin 01-24 | 2 | 2 | 4 | 7 | 11 | 11 | 10 | 13 | 10 | 7 | 5 | 6 | 12 | 17,809 |
| Dublin County | 3 | 2 | 4 | 7 | 14 | 12 | 10 | 11 | 9 | 6 | 5 | 6 | 12 | 4,665 |
| Kildare | 5 | 2 | 5 | 10 | 12 | 12 | 9 | 10 | 8 | 5 | 5 | 6 | 12 | 2,719 |
| Kilkenny | 2 | 3 | 8 | 8 | 13 | 10 | 8 | 10 | 9 | 5 | 4 | 4 | 18 | 1,013 |
| Laois | 2 | 2 | 5 | 11 | 10 | 11 | 7 | 11 | 8 | 8 | 5 | 4 | 16 | 757 |
| Longford | 2 | 2 | 5 | 7 | 12 | 11 | 10 | 11 | 8 | 7 | 6 | 9 | 11 | 493 |
| Louth | 2 | 2 | 5 | 5 | 11 | 12 | 8 | 13 | 8 | 6 | 5 | 8 | 16 | 1,848 |
| Meath | 2 | 2 | 5 | 8 | 12 | 12 | 10 | 11 | 8 | 6 | 5 | 6 | 13 | 2,168 |
| Offaly | 1 | 2 | 6 | 8 | 11 | 11 | 11 | 12 | 9 | 5 | 5 | 6 | 12 | 795 |
| Westmeath | 1 | 2 | 6 | 8 | 14 | 13 | 8 | 12 | 10 | 6 | 5 | 5 | 11 | 1,361 |
| Wexford | 3 | 1 | 4 | 7 | 11 | 12 | 9 | 11 | 9 | 6 | 6 | 8 | 14 | 1,771 |
| Wicklow | 3 | 3 | 5 | 10 | 12 | 11 | 9 | 12 | 7 | 7 | 6 | 7 | 11 | 1,920 |
| Clare | 1 | 2 | 4 | 7 | 11 | 11 | 9 | 12 | 11 | 6 | 5 | 8 | 12 | 1,752 |
| Cork City | 1 | 1 | 4 | 6 | 11 | 13 | 9 | 11 | 11 | 7 | 4 | 7 | 14 | 583 |
| Cork County | 2 | 2 | 4 | 8 | 12 | 12 | 10 | 12 | 9 | 6 | 4 | 7 | 11 | 5,829 |
| Kerry | 1 | 2 | 4 | 9 | 13 | 12 | 9 | 10 | 9 | 6 | 4 | 7 | 12 | 1,603 |
| Limerick City | 2 | 1 | 3 | 4 | 12 | 12 | 7 | 14 | 9 | 8 | 5 | 9 | 15 | 519 |
| Limerick County | 1 | 1 | 4 | 8 | 12 | 13 | 9 | 13 | 8 | 6 | 6 | 7 | 12 | 2,319 |
| Tipperary | 1 | 2 | 4 | 8 | 14 | 11 | 9 | 11 | 9 | 6 | 5 | 8 | 12 | 1,847 |
| Waterford City | 0 | 1 | 3 | 7 | 14 | 13 | 11 | 11 | 9 | 9 | 5 | 8 | 9 | 771 |
| Waterford County | 2 | 2 | 5 | 8 | 11 | 11 | 9 | 12 | 8 | 6 | 6 | 5 | 15 | 966 |
| Galway City | 1 | 1 | 4 | 5 | 10 | 13 | 12 | 12 | 9 | 7 | 6 | 6 | 14 | 715 |
| Galway County | 2 | 2 | 5 | 7 | 11 | 11 | 10 | 11 | 10 | 6 | 4 | 7 | 13 | 3,266 |
| Leitrim | 2 | – | 1 | 5 | 11 | 10 | 9 | 19 | 13 | 7 | 4 | 9 | 10 | 336 |
| Mayo | 2 | 1 | 5 | 7 | 12 | 12 | 9 | 11 | 9 | 7 | 5 | 6 | 14 | 1,669 |
| Roscommon | 1 | 1 | 3 | 6 | 8 | 10 | 9 | 13 | 10 | 9 | 4 | 10 | 16 | 669 |
| Sligo | 1 | 1 | 3 | 6 | 14 | 10 | 9 | 11 | 10 | 7 | 4 | 7 | 17 | 994 |
| Cavan | 1 | 1 | 4 | 7 | 12 | 12 | 8 | 12 | 9 | 7 | 5 | 7 | 14 | 787 |
| Donegal | 2 | 3 | 5 | 8 | 10 | 11 | 9 | 14 | 9 | 7 | 5 | 6 | 12 | 1,668 |
| Monaghan | 1 | 3 | 4 | 8 | 10 | 9 | 9 | 12 | 7 | 9 | 5 | 7 | 15 | 629 |
| Total | 2 | 2 | 4 | 7 | 12 | 12 | 10 | 12 | 9 | 6 | 5 | 7 | 13 | 65,075 |
| – No non-domestic unit received this BER in this county | ||||||||||||||
| Table 5 BERs by Dublin Postal District (Non-Domestic) 2009-2021 | ||||||||||||||
| % of row | ||||||||||||||
| Dublin Postal District | Energy Rating | Total | ||||||||||||
| A | B1 | B2 | B3 | C1 | C2 | C3 | D1 | D2 | E1 | E2 | F | G | ||
| Dublin 1 | 2 | 1 | 2 | 6 | 11 | 9 | 9 | 14 | 11 | 7 | 4 | 8 | 17 | 1,613 |
| Dublin 2 | 3 | 2 | 4 | 5 | 9 | 11 | 10 | 13 | 11 | 7 | 6 | 8 | 12 | 2,617 |
| Dublin 3 | 0 | 2 | 2 | 6 | 8 | 14 | 10 | 15 | 7 | 7 | 5 | 9 | 16 | 464 |
| Dublin 4 | 3 | 5 | 5 | 5 | 8 | 9 | 12 | 13 | 11 | 7 | 6 | 5 | 11 | 783 |
| Dublin 5 | 2 | 2 | 2 | 8 | 13 | 12 | 9 | 12 | 7 | 7 | 5 | 6 | 16 | 334 |
| Dublin 6 | 1 | 1 | 4 | 6 | 9 | 8 | 9 | 10 | 12 | 8 | 7 | 10 | 14 | 511 |
| Dublin 6W | 1 | 0 | 2 | 3 | 7 | 13 | 6 | 15 | 9 | 10 | 6 | 10 | 18 | 255 |
| Dublin 7 | 1 | 4 | 3 | 4 | 10 | 12 | 11 | 12 | 10 | 7 | 5 | 6 | 15 | 814 |
| Dublin 8 | 2 | 2 | 4 | 5 | 10 | 8 | 10 | 13 | 9 | 8 | 6 | 7 | 18 | 1,104 |
| Dublin 9 | 2 | 1 | 5 | 8 | 14 | 12 | 11 | 14 | 7 | 7 | 4 | 6 | 9 | 706 |
| Dublin 10 | 1 | 2 | 4 | 7 | 7 | 15 | 11 | 11 | 11 | 9 | 8 | 5 | 10 | 259 |
| Dublin 11 | 3 | 2 | 5 | 7 | 11 | 12 | 10 | 11 | 11 | 9 | 4 | 6 | 11 | 866 |
| Dublin 12 | 0 | 1 | 3 | 5 | 11 | 11 | 11 | 16 | 10 | 7 | 5 | 7 | 12 | 1,533 |
| Dublin 13 | 2 | 2 | 4 | 11 | 12 | 11 | 9 | 9 | 11 | 7 | 8 | 4 | 10 | 253 |
| Dublin 14 | 1 | 1 | 5 | 7 | 14 | 13 | 9 | 12 | 11 | 5 | 3 | 7 | 12 | 552 |
| Dublin 15 | 3 | 3 | 5 | 13 | 15 | 15 | 10 | 11 | 7 | 4 | 3 | 3 | 7 | 1,356 |
| Dublin 16 | 1 | 0 | 4 | 6 | 12 | 15 | 9 | 12 | 14 | 6 | 3 | 6 | 13 | 214 |
| Dublin 17 | 1 | 2 | 4 | 8 | 16 | 11 | 14 | 12 | 8 | 6 | 5 | 4 | 8 | 440 |
| Dublin 18 | 1 | 5 | 5 | 8 | 10 | 13 | 11 | 15 | 8 | 6 | 4 | 4 | 9 | 944 |
| Dublin 20 | 1 | 1 | 5 | 5 | 11 | 10 | 9 | 13 | 11 | 5 | 9 | 6 | 13 | 79 |
| Dublin 22 | 2 | 1 | 6 | 8 | 15 | 14 | 11 | 12 | 10 | 5 | 4 | 4 | 8 | 739 |
| Dublin 24 | 2 | 2 | 4 | 8 | 15 | 12 | 10 | 12 | 9 | 5 | 3 | 4 | 13 | 1,371 |
| Total | 2 | 2 | 4 | 7 | 11 | 11 | 10 | 13 | 10 | 7 | 5 | 6 | 12 | 17,807 |
| Table 6 BERs by Main Space Heating System Fuel (Non-Domestic) 2009-2021 | ||||||||||||||
| % of row | ||||||||||||||
| Heating System Fuel | Energy Rating | Total | ||||||||||||
| A | B1 | B2 | B3 | C1 | C2 | C3 | D1 | D2 | E1 | E2 | F | G | ||
| Mains Gas | 3 | 3 | 7 | 9 | 12 | 10 | 8 | 10 | 8 | 6 | 4 | 4 | 15 | 17,327 |
| Heating Oil | 1 | 2 | 5 | 8 | 12 | 12 | 11 | 16 | 12 | 7 | 5 | 4 | 4 | 6,572 |
| Electricity | 1 | 1 | 3 | 6 | 12 | 12 | 10 | 12 | 9 | 6 | 5 | 8 | 13 | 39,188 |
| LPG | 6 | 5 | 12 | 13 | 15 | 11 | 9 | 10 | 7 | 4 | 3 | 3 | 2 | 1,158 |
| Other Fuels | 3 | 6 | 4 | 8 | 6 | 10 | 8 | 11 | 8 | 7 | 5 | 7 | 16 | 830 |
| Total | 2 | 2 | 4 | 7 | 12 | 12 | 10 | 12 | 9 | 6 | 5 | 7 | 13 | 65,075 |
| Table 7 Main Space Heating System Fuel by County (Non-Domestic) 2009-2021 | ||||||
| % of row | ||||||
| County | Heating System Fuel | Total | ||||
| Mains Gas | Heating Oil | Electricity | LPG | Other | ||
| Carlow | 27 | 10 | 59 | 2 | 2 | 834 |
| Dublin 01-24 | 39 | 4 | 56 | 0 | 1 | 17,809 |
| Dublin County | 36 | 5 | 58 | 0 | 1 | 4,665 |
| Kildare | 26 | 8 | 64 | 1 | 1 | 2,719 |
| Kilkenny | 27 | 14 | 54 | 3 | 2 | 1,013 |
| Laois | 24 | 16 | 57 | 1 | 2 | 757 |
| Longford | 13 | 21 | 60 | 5 | 1 | 493 |
| Louth | 30 | 8 | 60 | 1 | 1 | 1,848 |
| Meath | 29 | 11 | 57 | 1 | 1 | 2,168 |
| Offaly | 17 | 18 | 61 | 2 | 2 | 795 |
| Westmeath | 19 | 16 | 60 | 4 | 1 | 1,361 |
| Wexford | 11 | 16 | 66 | 6 | 2 | 1,771 |
| Wicklow | 27 | 9 | 61 | 1 | 2 | 1,920 |
| Clare | 21 | 18 | 58 | 2 | 1 | 1,752 |
| Cork City | 32 | 3 | 64 | – | 1 | 583 |
| Cork County | 25 | 8 | 64 | 2 | 1 | 5,829 |
| Kerry | 9 | 16 | 66 | 6 | 2 | 1,603 |
| Limerick City | 27 | 2 | 70 | 0 | 0 | 519 |
| Limerick County | 25 | 10 | 63 | 1 | 1 | 2,319 |
| Tipperary | 19 | 19 | 58 | 2 | 2 | 1,847 |
| Waterford City | 32 | 5 | 60 | 1 | 2 | 771 |
| Waterford County | 23 | 10 | 62 | 3 | 2 | 966 |
| Galway City | 11 | 6 | 81 | 1 | 0 | 715 |
| Galway County | 12 | 14 | 69 | 3 | 2 | 3,266 |
| Leitrim | 7 | 24 | 62 | 4 | 3 | 336 |
| Mayo | 9 | 20 | 66 | 3 | 2 | 1,669 |
| Roscommon | 12 | 23 | 59 | 4 | 3 | 669 |
| Sligo | 9 | 19 | 66 | 5 | 1 | 994 |
| Cavan | 13 | 20 | 57 | 7 | 2 | 787 |
| Donegal | 12 | 27 | 54 | 6 | 2 | 1,668 |
| Monaghan | 15 | 21 | 58 | 4 | 2 | 629 |
| Total | 27 | 10 | 60 | 2 | 1 | 65,075 |
| – No non-domestic unit indicated the usage of this main space heating fuel type for this county | ||||||
| Table 8 Main Space Heating System Fuel by Type of Building (Non-Domestic) 2009-2021 | ||||||
| % of row | ||||||
| Building Type | Heating System Fuel | Total | ||||
| Mains Gas | Heating Oil | Electricity | LPG | Other | ||
| Retail | 18 | 4 | 76 | 1 | 1 | 24,814 |
| Office | 31 | 7 | 60 | 1 | 1 | 15,057 |
| Restaurant/public house | 28 | 24 | 41 | 4 | 3 | 6,091 |
| Hotel | 46 | 29 | 12 | 12 | 1 | 910 |
| Warehouses | 32 | 10 | 54 | 2 | 1 | 8,531 |
| Workshops/maintenance depot | 28 | 14 | 54 | 3 | 1 | 2,367 |
| Industrial process building | 30 | 25 | 37 | 4 | 4 | 1,401 |
| Hospitals and primary health care | 32 | 12 | 52 | 2 | 1 | 1,203 |
| Community/day centre | 36 | 25 | 34 | 4 | 1 | 1,142 |
| Nursing residential homes and hostels | 42 | 31 | 14 | 12 | 2 | 606 |
| Schools and colleges | 40 | 23 | 29 | 5 | 2 | 1,179 |
| Sports facilities | 41 | 10 | 42 | 6 | 1 | 514 |
| Other | 33 | 12 | 50 | 4 | 2 | 1,260 |
| Total | 27 | 10 | 60 | 2 | 1 | 65,075 |
| Table 9 Main Ventilation System by Type of Building (Non-Domestic) 2009-2021 | ||||
| % of row | ||||
| Building Type | Main Ventilation System | Total | ||
| Air Conditioning | Mechanical Ventilation | Natural Ventilation | ||
| Retail | 46 | 6 | 47 | 24,814 |
| Office | 35 | 7 | 58 | 15,057 |
| Restaurant/public house | 34 | 11 | 55 | 6,091 |
| Hotel | 26 | 8 | 66 | 910 |
| Warehouses | 15 | 7 | 79 | 8,531 |
| Workshops/maintenance depot | 16 | 5 | 79 | 2,367 |
| Industrial process building | 20 | 13 | 66 | 1,401 |
| Hospitals and primary health care | 22 | 7 | 71 | 1,203 |
| Community/day centre | 8 | 6 | 85 | 1,142 |
| Nursing residential homes and hostels | 2 | 7 | 91 | 606 |
| Schools and colleges | 13 | 8 | 79 | 1,179 |
| Sports facilities | 29 | 15 | 56 | 514 |
| Other | 18 | 9 | 73 | 1,260 |
| Total | 33 | 7 | 59 | 65,075 |
| Table 10 Average Floor Area by Type of Building and County (Non-Domestic) 2009-2021 | ||||||||||||||
| m2 | ||||||||||||||
| County | Retail | Office | Restaurant/ public house | Hotel | Warehouses | Workshops/ maintenance depot | Industrial process building | Hospitals and primary health care | Community/ day centre | Nursing residential homes and hostels | Schools and colleges | Sports facilities | Other | All building types |
| Carlow | 419 | 360 | 362 | 2,299 | 826 | 689 | 3,318 | 215 | 211 | 1,289 | 1,656 | 680 | 921 | 592 |
| Dublin 01-24 | 364 | 1,209 | 319 | 4,152 | 1,360 | 573 | 3,095 | 630 | 375 | 1,888 | 2,406 | 1,312 | 826 | 936 |
| Dublin County | 295 | 587 | 332 | 4,770 | 1,524 | 1,108 | 3,642 | 525 | 431 | 3,060 | 2,322 | 981 | 1,093 | 723 |
| Kildare | 227 | 389 | 348 | 4,377 | 1,045 | 601 | 7,196 | 680 | 267 | 2,297 | 1,369 | 1,391 | 527 | 602 |
| Kilkenny | 364 | 327 | 258 | 2,520 | 1,151 | 763 | 1,454 | 445 | 222 | 1,936 | 1,874 | 479 | 496 | 552 |
| Laois | 300 | 271 | 277 | 5,085 | 878 | 533 | 3,632 | 599 | 229 | 1,685 | 1,941 | 1,735 | 1,222 | 555 |
| Longford | 361 | 285 | 277 | 1,140 | 1,223 | 659 | 5,411 | 412 | 387 | 1,520 | 913 | 3,777 | 294 | 645 |
| Louth | 290 | 643 | 306 | 4,360 | 1,517 | 602 | 4,324 | 513 | 198 | 2,111 | 1,130 | 1,625 | 833 | 699 |
| Meath | 234 | 404 | 301 | 4,181 | 1,154 | 508 | 2,339 | 570 | 289 | 1,507 | 1,330 | 978 | 3,064 | 639 |
| Offaly | 278 | 492 | 227 | 1,828 | 832 | 647 | 1,723 | 773 | 307 | 1,585 | 2,088 | 371 | 292 | 542 |
| Westmeath | 306 | 538 | 250 | 2,089 | 1,395 | 618 | 2,901 | 1,117 | 242 | 912 | 1,618 | 997 | 591 | 587 |
| Wexford | 316 | 491 | 273 | 2,709 | 840 | 624 | 2,120 | 412 | 352 | 1,299 | 1,509 | 678 | 562 | 529 |
| Wicklow | 214 | 395 | 281 | 3,214 | 629 | 439 | 2,307 | 637 | 346 | 1,849 | 1,599 | 774 | 283 | 506 |
| Clare | 217 | 503 | 282 | 2,203 | 1,058 | 425 | 3,001 | 294 | 254 | 596 | 978 | 503 | 496 | 621 |
| Cork City | 373 | 921 | 210 | 1,722 | 1,177 | 408 | 2,801 | 229 | 144 | – | 975 | 790 | 560 | 613 |
| Cork County | 303 | 704 | 266 | 3,111 | 997 | 478 | 3,057 | 626 | 330 | 1,728 | 1,679 | 812 | 620 | 619 |
| Kerry | 289 | 284 | 268 | 2,324 | 692 | 310 | 2,844 | 556 | 309 | 847 | 943 | 938 | 338 | 492 |
| Limerick City | 243 | 456 | 263 | 7,630 | 988 | 395 | 1,454 | 380 | 475 | 1,521 | 1,341 | 677 | 2,430 | 533 |
| Limerick County | 301 | 453 | 293 | 4,347 | 1,124 | 468 | 2,993 | 772 | 380 | 1,777 | 2,214 | 794 | 1,535 | 661 |
| Tipperary | 296 | 408 | 249 | 2,108 | 1,390 | 435 | 3,858 | 624 | 332 | 1,306 | 936 | 654 | 271 | 604 |
| Waterford City | 301 | 459 | 322 | 3,785 | 750 | 681 | 2,322 | 159 | 659 | 785 | 624 | 342 | 747 | 543 |
| Waterford County | 589 | 311 | 285 | 2,911 | 1,185 | 673 | 2,518 | 1,256 | 233 | 1,177 | 1,022 | 764 | 1,065 | 768 |
| Galway City | 280 | 357 | 209 | 4,050 | 578 | 298 | 3,139 | 285 | 587 | 1,490 | 2,677 | 447 | 469 | 495 |
| Galway County | 299 | 466 | 272 | 3,221 | 1,068 | 486 | 2,062 | 389 | 286 | 1,977 | 1,783 | 909 | 637 | 619 |
| Leitrim | 212 | 711 | 268 | 1,280 | 556 | 691 | 477 | 1,558 | 376 | 1,364 | 965 | – | 123 | 428 |
| Mayo | 259 | 287 | 275 | 3,204 | 874 | 617 | 1,983 | 882 | 314 | 1,562 | 507 | 1,041 | 493 | 478 |
| Roscommon | 268 | 389 | 257 | 1,889 | 852 | 523 | 3,887 | 655 | 392 | 1,416 | 1,243 | 634 | 952 | 471 |
| Sligo | 320 | 382 | 293 | 1,211 | 928 | 452 | 3,184 | 898 | 294 | 1,300 | 1,131 | 665 | 724 | 531 |
| Cavan | 218 | 353 | 247 | 1,964 | 667 | 403 | 2,947 | 342 | 393 | 2,993 | 906 | 621 | 353 | 431 |
| Donegal | 259 | 391 | 322 | 2,375 | 1,242 | 492 | 2,647 | 663 | 422 | 900 | 912 | 776 | 516 | 556 |
| Monaghan | 306 | 176 | 349 | 4,574 | 1,121 | 640 | 1,928 | 140 | 436 | 1,219 | 1,459 | 946 | 702 | 590 |
| All | 307 | 770 | 291 | 3,223 | 1,172 | 573 | 2,937 | 591 | 336 | 1,677 | 1,683 | 1,011 | 799 | 692 |
| – No data is available for this building type and county | ||||||||||||||
| Table 11 Average Primary Energy Use by Type of Building and County (Non-Domestic) 2009-2021 | ||||||||||||||
| kWh/m2/year | ||||||||||||||
| County | Retail | Office | Restaurant/ public house | Hotel | Warehouses | Workshops/ maintenance depot | Industrial process building | Hospitals and primary health care | Community/ day centre | Nursing residential homes and hostels | Schools and colleges | Sports facilities | Other | All building types |
| Carlow | 1,299 | 483 | 825 | 685 | 730 | 835 | 868 | 460 | 488 | 395 | 136 | 644 | 681 | 852 |
| Dublin 01-24 | 1,048 | 430 | 1,030 | 548 | 432 | 713 | 660 | 378 | 487 | 388 | 304 | 1,184 | 889 | 550 |
| Dublin County | 1,040 | 438 | 1,017 | 622 | 303 | 647 | 746 | 321 | 413 | 349 | 145 | 1,047 | 643 | 534 |
| Kildare | 1,075 | 648 | 896 | 890 | 465 | 776 | 731 | 255 | 349 | 475 | 182 | 887 | 806 | 696 |
| Kilkenny | 1,413 | 767 | 871 | 565 | 443 | 562 | 658 | 332 | 402 | 424 | 138 | 1,399 | 583 | 790 |
| Laois | 1,493 | 760 | 942 | 480 | 469 | 847 | 903 | 259 | 421 | 406 | 118 | 1,161 | 923 | 846 |
| Longford | 1,284 | 877 | 1,069 | 639 | 510 | 888 | 811 | 319 | 751 | 337 | 201 | 581 | 894 | 825 |
| Louth | 1,062 | 493 | 955 | 628 | 558 | 757 | 804 | 368 | 474 | 344 | 100 | 811 | 693 | 685 |
| Meath | 1,179 | 471 | 987 | 614 | 586 | 931 | 590 | 251 | 333 | 440 | 147 | 1,384 | 347 | 649 |
| Offaly | 898 | 386 | 944 | 557 | 559 | 861 | 600 | 191 | 439 | 423 | 145 | 1,064 | 674 | 603 |
| Westmeath | 1,044 | 630 | 978 | 729 | 553 | 1,297 | 644 | 345 | 462 | 341 | 127 | 667 | 823 | 718 |
| Wexford | 1,529 | 449 | 996 | 825 | 586 | 917 | 453 | 552 | 961 | 591 | 149 | 1,196 | 951 | 837 |
| Wicklow | 967 | 461 | 999 | 692 | 395 | 631 | 546 | 302 | 382 | 421 | 123 | 863 | 744 | 581 |
| Clare | 1,063 | 662 | 923 | 654 | 514 | 756 | 613 | 1,091 | 552 | 611 | 426 | 1,319 | 837 | 685 |
| Cork City | 1,379 | 602 | 960 | 536 | 601 | 843 | 1,010 | 494 | 385 | – | 267 | 972 | 558 | 824 |
| Cork County | 1,022 | 427 | 974 | 648 | 514 | 612 | 504 | 407 | 519 | 556 | 163 | 1,006 | 688 | 609 |
| Kerry | 960 | 680 | 935 | 644 | 614 | 773 | 848 | 336 | 379 | 464 | 225 | 673 | 741 | 736 |
| Limerick City | 1,057 | 1,354 | 1,069 | 502 | 709 | 782 | 835 | 397 | 375 | 944 | 174 | 766 | 310 | 865 |
| Limerick County | 1,111 | 745 | 1,025 | 651 | 714 | 647 | 917 | 410 | 377 | 350 | 195 | 829 | 498 | 773 |
| Tipperary | 958 | 585 | 904 | 737 | 490 | 907 | 748 | 221 | 595 | 388 | 248 | 932 | 777 | 703 |
| Waterford City | 1,218 | 549 | 996 | 745 | 382 | 637 | 616 | 486 | 381 | 428 | 361 | 1,192 | 1,036 | 710 |
| Waterford County | 1,300 | 589 | 1,110 | 732 | 624 | 949 | 494 | 349 | 443 | 361 | 224 | 867 | 300 | 831 |
| Galway City | 1,090 | 606 | 1,185 | 485 | 754 | 739 | 876 | 318 | 323 | 268 | 137 | 1,074 | 905 | 747 |
| Galway County | 1,181 | 666 | 902 | 586 | 803 | 701 | 649 | 339 | 369 | 327 | 153 | 863 | 705 | 730 |
| Leitrim | 967 | 791 | 858 | 851 | 939 | 870 | 618 | 94 | 411 | 481 | 154 | – | 570 | 772 |
| Mayo | 1,098 | 803 | 897 | 640 | 523 | 694 | 658 | 221 | 307 | 373 | 327 | 594 | 2,264 | 768 |
| Roscommon | 1,843 | 482 | 1,067 | 673 | 669 | 624 | 656 | 314 | 686 | 401 | 150 | 1,157 | 638 | 938 |
| Sligo | 1,430 | 860 | 941 | 589 | 939 | 644 | 782 | 329 | 413 | 547 | 235 | 1,197 | 701 | 935 |
| Cavan | 996 | 608 | 1,033 | 654 | 653 | 641 | 640 | 352 | 605 | 440 | 251 | 762 | 820 | 712 |
| Donegal | 996 | 603 | 977 | 644 | 720 | 785 | 578 | 266 | 373 | 570 | 198 | 732 | 651 | 707 |
| Monaghan | 991 | 541 | 856 | 743 | 459 | 1,222 | 589 | 514 | 341 | 351 | 210 | 946 | 256 | 672 |
| All | 1,113 | 480 | 978 | 629 | 497 | 735 | 675 | 352 | 471 | 415 | 213 | 990 | 721 | 642 |
| – No data is available for this building type and county | ||||||||||||||
| Table 12 Average Carbon Dioxide Emissions by Type of Building and County (Non-Domestic) 2009-2021 | ||||||||||||||
| kgCO2/m2/year | ||||||||||||||
| County | Retail | Office | Restaurant/ public house | Hotel | Warehouses | Workshops/ maintenance depot | Industrial process building | Hospitals and primary health care | Community/ day centre | Nursing residential homes and hostels | Schools and colleges | Sports facilities | Other | All building types |
| Carlow | 306 | 111 | 189 | 153 | 172 | 192 | 203 | 104 | 107 | 84 | 28 | 145 | 156 | 199 |
| Dublin 01-24 | 244 | 96 | 233 | 119 | 97 | 163 | 149 | 85 | 108 | 80 | 67 | 257 | 204 | 124 |
| Dublin County | 240 | 99 | 231 | 139 | 69 | 142 | 166 | 69 | 90 | 70 | 31 | 229 | 145 | 120 |
| Kildare | 251 | 148 | 205 | 201 | 107 | 180 | 167 | 56 | 79 | 104 | 39 | 191 | 187 | 159 |
| Kilkenny | 309 | 173 | 203 | 120 | 102 | 130 | 155 | 73 | 88 | 94 | 29 | 328 | 135 | 177 |
| Laois | 352 | 177 | 222 | 104 | 110 | 197 | 212 | 56 | 97 | 92 | 25 | 227 | 209 | 197 |
| Longford | 302 | 206 | 253 | 144 | 120 | 202 | 192 | 74 | 178 | 78 | 46 | 124 | 192 | 192 |
| Louth | 246 | 110 | 220 | 142 | 128 | 173 | 186 | 81 | 106 | 71 | 21 | 183 | 156 | 157 |
| Meath | 276 | 108 | 230 | 134 | 136 | 218 | 134 | 56 | 74 | 96 | 34 | 311 | 74 | 149 |
| Offaly | 211 | 90 | 222 | 123 | 129 | 204 | 141 | 42 | 103 | 97 | 33 | 250 | 155 | 141 |
| Westmeath | 245 | 146 | 228 | 165 | 128 | 305 | 150 | 80 | 104 | 72 | 28 | 155 | 186 | 167 |
| Wexford | 361 | 104 | 233 | 191 | 138 | 218 | 107 | 128 | 226 | 137 | 35 | 220 | 217 | 196 |
| Wicklow | 222 | 104 | 230 | 158 | 90 | 148 | 126 | 67 | 84 | 95 | 27 | 190 | 169 | 133 |
| Clare | 249 | 155 | 215 | 150 | 118 | 173 | 138 | 250 | 126 | 138 | 100 | 313 | 192 | 158 |
| Cork City | 308 | 138 | 216 | 115 | 136 | 191 | 208 | 111 | 83 | – | 59 | 215 | 124 | 185 |
| Cork County | 239 | 98 | 224 | 143 | 117 | 142 | 116 | 92 | 120 | 116 | 35 | 214 | 158 | 139 |
| Kerry | 224 | 159 | 219 | 145 | 143 | 182 | 201 | 78 | 85 | 107 | 53 | 157 | 175 | 171 |
| Limerick City | 249 | 318 | 245 | 107 | 166 | 186 | 185 | 90 | 83 | 225 | 38 | 182 | 65 | 200 |
| Limerick County | 257 | 172 | 236 | 137 | 165 | 151 | 215 | 91 | 86 | 76 | 45 | 192 | 113 | 178 |
| Tipperary | 223 | 135 | 210 | 164 | 115 | 209 | 176 | 49 | 140 | 88 | 58 | 216 | 186 | 164 |
| Waterford City | 283 | 125 | 227 | 166 | 89 | 146 | 131 | 110 | 77 | 90 | 78 | 275 | 230 | 161 |
| Waterford County | 306 | 136 | 259 | 154 | 145 | 217 | 112 | 77 | 98 | 75 | 49 | 190 | 67 | 192 |
| Galway City | 255 | 142 | 277 | 111 | 176 | 175 | 209 | 75 | 73 | 64 | 30 | 232 | 206 | 175 |
| Galway County | 273 | 155 | 211 | 132 | 190 | 165 | 149 | 77 | 83 | 72 | 33 | 196 | 159 | 169 |
| Leitrim | 228 | 187 | 200 | 204 | 224 | 197 | 147 | 12 | 97 | 112 | 34 | – | 122 | 182 |
| Mayo | 259 | 188 | 212 | 149 | 124 | 166 | 154 | 50 | 71 | 81 | 78 | 128 | 533 | 180 |
| Roscommon | 436 | 111 | 251 | 154 | 157 | 149 | 158 | 66 | 165 | 92 | 33 | 264 | 148 | 220 |
| Sligo | 336 | 202 | 219 | 138 | 220 | 147 | 185 | 77 | 96 | 130 | 56 | 234 | 158 | 219 |
| Cavan | 234 | 144 | 241 | 151 | 153 | 148 | 144 | 81 | 141 | 79 | 59 | 181 | 182 | 165 |
| Donegal | 234 | 141 | 230 | 151 | 170 | 182 | 131 | 61 | 89 | 100 | 45 | 173 | 149 | 165 |
| Monaghan | 231 | 127 | 202 | 170 | 105 | 289 | 132 | 122 | 77 | 82 | 38 | 199 | 47 | 154 |
| All | 259 | 109 | 225 | 140 | 114 | 169 | 155 | 79 | 107 | 89 | 47 | 217 | 164 | 147 |
| – No data is available for this building type and county | ||||||||||||||
| Table 13 BERs by Period of Construction (Non-Domestic) 2009-2021 | ||||||||||||||
| % of row | ||||||||||||||
| Period of Construction | Energy Rating | Total | ||||||||||||
| A | B1 | B2 | B3 | C1 | C2 | C3 | D1 | D2 | E1 | E2 | F | G | ||
| 1900-1929 | 0 | 0 | 1 | 3 | 8 | 9 | 10 | 16 | 13 | 9 | 7 | 10 | 12 | 6,720 |
| 1930-1949 | 0 | 0 | 2 | 4 | 10 | 12 | 9 | 15 | 11 | 8 | 7 | 8 | 13 | 1,607 |
| 1950-1966 | 0 | 1 | 2 | 5 | 10 | 10 | 10 | 13 | 12 | 9 | 7 | 8 | 14 | 3,065 |
| 1967-1977 | 0 | 1 | 3 | 5 | 10 | 12 | 10 | 13 | 11 | 8 | 6 | 8 | 13 | 3,323 |
| 1978-1982 | 0 | 2 | 2 | 5 | 10 | 11 | 11 | 13 | 10 | 9 | 6 | 9 | 13 | 2,788 |
| 1983-1993 | 0 | 1 | 3 | 7 | 13 | 12 | 9 | 13 | 10 | 7 | 6 | 7 | 12 | 5,134 |
| 1994-1999 | 0 | 1 | 4 | 9 | 16 | 15 | 11 | 14 | 9 | 6 | 4 | 5 | 6 | 5,146 |
| 2000-2004 | 0 | 1 | 5 | 10 | 16 | 15 | 12 | 11 | 8 | 5 | 3 | 4 | 8 | 7,916 |
| 2005-2009 | 1 | 2 | 7 | 11 | 14 | 13 | 9 | 9 | 7 | 4 | 3 | 5 | 16 | 14,537 |
| 2010-2014 | 8 | 9 | 10 | 11 | 11 | 9 | 8 | 10 | 5 | 3 | 4 | 4 | 8 | 2,114 |
| 2015-2021 | 21 | 15 | 11 | 9 | 7 | 6 | 5 | 5 | 4 | 2 | 2 | 2 | 11 | 1,623 |
| Total | 1 | 2 | 5 | 8 | 13 | 12 | 10 | 12 | 9 | 6 | 5 | 6 | 12 | 53,973 |
| Table 14 Main Space Heating System Fuel by Period of Construction (Non-Domestic) 2009-2021 | ||||||
| % of row | ||||||
| Period of Construction | Fuel Type | Total | ||||
| Mains Gas | Heating Oil | Electricity | LPG | Other | ||
| 1900-1929 | 19 | 16 | 62 | 2 | 2 | 6,720 |
| 1930-1949 | 19 | 16 | 62 | 2 | 1 | 1,607 |
| 1950-1966 | 23 | 17 | 58 | 1 | 1 | 3,065 |
| 1967-1977 | 25 | 19 | 53 | 2 | 1 | 3,323 |
| 1978-1982 | 24 | 17 | 57 | 2 | 1 | 2,788 |
| 1983-1993 | 24 | 10 | 64 | 1 | 1 | 5,134 |
| 1994-1999 | 27 | 8 | 63 | 1 | 1 | 5,146 |
| 2000-2004 | 28 | 5 | 65 | 2 | 0 | 7,916 |
| 2005-2009 | 31 | 5 | 62 | 2 | 1 | 14,537 |
| 2010-2014 | 31 | 13 | 51 | 4 | 2 | 2,114 |
| 2015-2021 | 45 | 7 | 42 | 5 | 1 | 1,623 |
| Total | 27 | 10 | 61 | 2 | 1 | 53,973 |
The European Union Energy Performance of Buildings Directive (EPBD) contains a range of provisions to improve the energy performance of new and existing buildings. The EPBD obliges specific forms of information and advice on energy performance to be provided to building purchasers, tenants and users for consideration in property transactions. A Building Energy Rating (BER) is an indication of the energy performance of a building represented in units of kWh/m2/year. A BER is based on the characteristics of major components of the building. The BER certificate indicates the annual primary energy usage and carbon dioxide emissions associated with the provision of space heating, water heating, ventilation, lighting, and associated pumps and fans. The average annual primary energy use figures and carbon dioxide emissions are not based on actual energy use and emissions data.
These Background notes provide a very general overview together with some specific information on the detailed tables in the release. The SEAI website should be consulted for detailed information on the non-domestic energy assessment procedure (NEAP), see https://www.seai.ie/grants/supports-for-contractors/neap/
The figures in this release will be updated on a quarterly basis. Changes to data for the previous quarters will arise mainly from some buildings having another BER audit undertaken and the previous certificate being marked as expired. The difference in the number of BER certificates included in Tables 1 and 2 gives an indication of the number of buildings that have had more than one BER audit undertaken.
Full site surveys have to be carried out for New-final and Existing building assessments. New-provisional ratings do not require a site survey as the assessment is done based on design stage plans – new provisional ratings have been excluded from this release. Some buildings are excluded from the EPBD requirements: national monuments; protected structures; places of worship; temporary buildings; industrial and agricultural buildings not intended for occupancy and below a specified installed heating capacity; and buildings with a total useful floor area of less than 50 square metres. Short-term lettings are not exempt.
A BER for new non-domestic buildings was introduced in July 2008 and for renting of existing non-domestic buildings in January 2009. New regulations came into effect in January 2013 requiring the inclusion of BER information in property sale and rental advertisements.
The data have not been adjusted to represent all non-domestic buildings in the State and hence the tables only represent buildings that have been assessed.
The BER rating scale is divided into categories from G (largest primary energy usage) to an A1 rating (lowest primary energy usage). Energy consumption is expressed in kWh per square metre of floor area of the building per year (kWh/m2/year) and CO2 emissions are expressed in kilograms of carbon dioxide per square metre per year (kgCO2/m2/year). For the purposes of this release A1, A2, and A3 have been combined because of the small number of certificates in these categories. The certificate is valid for 10 years unless changes are made to the building.
Table 1 presents the number of BERs published by month since January 2009. A premises that has had BERs conducted in different years is included in each year. This table gives an overview of the number of BER assessments being performed each month.
Tables 2-14 only include the latest BER published for each building i.e. the BER is on the public register - the number is lower than the total in Table 1 because replaced certificates have been excluded.
Table 2 shows the number of BER certificates by energy rating and year.
Table 3 classifies the number of BER certificates by energy rating and building type. This relates to the current building use and it is displayed on the BER certificate. Some building types have been combined for the purposes of this release e.g. schools and colleges.
Tables 4-5 profile Building Energy Ratings by county and Dublin postal district. Table 4 is in county within province order.
Table 6 profiles Building Energy Ratings by type of main space heating system fuel. The heating system fuel options are: Mains gas; Heating Oil; Electricity; LPG; Biogas; Oil; Coal; Biomass; Waste heat; Anthracite; Smokeless fuel; Dual fuel appliances; and Other. Categories with only a small number of responses have been amalgamated in Table 6.
Tables 7-8 cross-classify main space heating system fuel by county and building type.
Table 9 cross-classifies main ventilation system by building type.
Table 10 shows the average floor area by building type and county.
Tables 11-12 show the average primary energy use and average carbon dioxide figures by building type and county.
Table 13 shows the relationship between period of construction and building energy ratings. It can be linked with changes to the Building Regulations that require new buildings to be more energy efficient.
Table 14 cross-classifies main space heating fuel by period of construction.
 Hide Background Notes
Scan the QR code below to view this release online or go to
http://www.cso.ie/en/releasesandpublications/er/ndber/non-domesticbuildingenergyratingsq42021/
 Show Table 1 BER Certificates (Non-Domestic) 2009-2021
 Hide Table 1 BER Certificates (Non-Domestic) 2009-2021