
| Seasonally adjusted number of persons unemployed | Seasonally adjusted unemployment rate (%) | ||
| July 2017 | 158,700 | 6.8 | |
| June 2018 | 120,700 | 5.1 | |
| July 2018 | 120,500 | 5.1 | |
| Percentage Points | |||
| Change in month | - 200 | 0.0 | |
| Change in year | - 38,200 | - 1.7 |
|
The data included in this release have been revised with the publication of the Q2 2018 Labour Force Survey (LFS) on 28 August 2018. These revisions to the monthly series have occurred as there are new benchmark figures available from this LFS publication. In addition, it should be noted that larger revisions can occur when the most recent LFS data are included in the calculation process. As a result of the availability of these LFS benchmark figures the data contained in this release are no longer current. The revised Monthly Unemployment estimates are included in the Q2 2018 LFS release in tables A3, A4 and A5 at the following link: https://www.cso.ie/en/csolatestnews/presspages/2018/labourforcesurveyq22018/ |
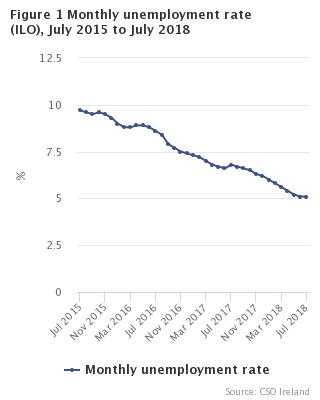
The seasonally adjusted unemployment rate for July 2018 was 5.1%, unchanged from June 2018 and down from 6.8% in July 2017. The seasonally adjusted number of persons unemployed was 120,500 in July 2018, down from 120,700 when compared to the June 2018 figure and a decrease of 38,200 when compared to July 2017.
Summary points for July
| Table 1a Seasonally adjusted monthly unemployment by sex - All persons aged 15-74 years | |||||||||
| Number of persons | Unemployment rate (%) | ||||||||
| Males | Females | All Persons | Males | Females | All Persons | ||||
| 2016 | July | 117,700 | 81,900 | 199,700 | 9.3 | 7.7 | 8.6 | ||
| August | 114,800 | 80,000 | 194,800 | 9.1 | 7.5 | 8.4 | |||
| September | 108,100 | 76,100 | 184,200 | 8.6 | 7.2 | 7.9 | |||
| October | 102,600 | 76,100 | 178,700 | 8.1 | 7.2 | 7.7 | |||
| November | 97,500 | 76,400 | 173,900 | 7.7 | 7.2 | 7.5 | |||
| December | 95,100 | 76,800 | 171,900 | 7.6 | 7.2 | 7.4 | |||
| 2017 | January | 93,300 | 77,200 | 170,500 | 7.4 | 7.2 | 7.3 | ||
| February | 92,900 | 75,700 | 168,600 | 7.4 | 7.1 | 7.2 | |||
| March | 92,900 | 70,800 | 163,700 | 7.4 | 6.6 | 7.0 | |||
| April | 93,100 | 65,500 | 158,600 | 7.4 | 6.1 | 6.8 | |||
| May | 92,600 | 62,900 | 155,500 | 7.3 | 5.9 | 6.7 | |||
| June | 91,500 | 63,500 | 155,100 | 7.2 | 6.0 | 6.6 | |||
| July | 90,600 | 68,200 | 158,700 | 7.1 | 6.4 | 6.8 | |||
| August | 89,000 | 67,400 | 156,300 | 7.0 | 6.3 | 6.7 | |||
| September | 88,000 | 67,100 | 155,100 | 6.9 | 6.2 | 6.6 | |||
| October | 88,200 | 65,400 | 153,600 | 6.9 | 6.1 | 6.5 | |||
| November | 85,600 | 64,000 | 149,600 | 6.7 | 5.9 | 6.3 | |||
| December | 83,100 | 63,300 | 146,400 | 6.5 | 5.9 | 6.2 | |||
| 2018 | January | 79,200 | 62,700 | 142,000 | 6.2 | 5.8 | 6.0 | ||
| February | 75,700 | 61,400 | 137,100 | 5.9 | 5.7 | 5.8 | |||
| March | 72,500 | 59,500 | 132,000 | 5.7 | 5.5 | 5.6 | |||
| April | 69,400 | 57,000 | 126,400 | 5.4 | 5.3 | 5.4 | |||
| May | 67,200 | 56,100 | 123,300 | 5.3 | 5.2 | 5.2 | |||
| June | 65,100 | 55,600 | 120,700 | 5.1 | 5.2 | 5.1 | |||
| July | 64,000 | 56,500 | 120,500 | 5.0 | 5.2 | 5.1 | |||
| Table 1b Seasonally adjusted monthly unemployment by sex - persons aged 15-24 years | |||||||||
| Number of persons | Unemployment rate (%) | ||||||||
| Males | Females | All Persons | Males | Females | All Persons | ||||
| 2016 | July | 31,900 | 19,100 | 51,000 | 19.8 | 13.5 | 16.9 | ||
| August | 31,800 | 18,500 | 50,300 | 19.8 | 13.1 | 16.7 | |||
| September | 30,200 | 17,900 | 48,100 | 19.0 | 12.8 | 16.1 | |||
| October | 29,100 | 18,900 | 48,000 | 18.7 | 13.5 | 16.2 | |||
| November | 27,400 | 19,000 | 46,400 | 18.0 | 13.6 | 15.9 | |||
| December | 25,200 | 18,800 | 44,000 | 16.9 | 13.5 | 15.2 | |||
| 2017 | January | 22,200 | 17,600 | 39,800 | 15.2 | 12.7 | 14.0 | ||
| February | 21,300 | 16,800 | 38,100 | 14.8 | 12.2 | 13.5 | |||
| March | 23,300 | 16,300 | 39,600 | 16.0 | 11.9 | 14.0 | |||
| April | 25,400 | 16,300 | 41,600 | 17.3 | 12.0 | 14.7 | |||
| May | 26,200 | 16,400 | 42,600 | 18.0 | 12.2 | 15.2 | |||
| June | 25,400 | 17,200 | 42,600 | 17.9 | 13.0 | 15.5 | |||
| July | 23,600 | 18,400 | 42,000 | 17.2 | 14.3 | 15.8 | |||
| August | 22,400 | 17,800 | 40,200 | 16.6 | 14.3 | 15.5 | |||
| September | 21,500 | 16,700 | 38,200 | 15.6 | 13.4 | 14.5 | |||
| October | 21,400 | 14,900 | 36,300 | 14.8 | 11.8 | 13.4 | |||
| November | 21,100 | 14,100 | 35,200 | 14.3 | 11.0 | 12.8 | |||
| December | 21,200 | 14,900 | 36,200 | 14.2 | 11.6 | 13.0 | |||
| 2018 | January | 21,400 | 16,300 | 37,700 | 14.4 | 12.7 | 13.6 | ||
| February | 20,700 | 16,400 | 37,200 | 14.2 | 12.9 | 13.6 | |||
| March | 19,600 | 15,300 | 34,900 | 13.8 | 12.4 | 13.1 | |||
| April | 18,500 | 13,400 | 31,900 | 13.2 | 11.2 | 12.3 | |||
| May | 17,800 | 12,400 | 30,200 | 13.0 | 10.6 | 11.9 | |||
| June | 16,900 | 11,800 | 28,700 | 12.6 | 10.3 | 11.5 | |||
| July | 16,400 | 12,100 | 28,500 | 12.5 | 10.8 | 11.7 | |||
| Table 1c Seasonally adjusted monthly unemployment by sex - persons aged 25-74 years | |||||||||
| Number of persons | Unemployment rate (%) | ||||||||
| Males | Females | All Persons | Males | Females | All Persons | ||||
| 2016 | July | 85,900 | 62,800 | 148,600 | 7.8 | 6.8 | 7.3 | ||
| August | 83,000 | 61,500 | 144,500 | 7.5 | 6.7 | 7.1 | |||
| September | 78,000 | 58,100 | 136,100 | 7.1 | 6.3 | 6.7 | |||
| October | 73,500 | 57,200 | 130,700 | 6.7 | 6.2 | 6.5 | |||
| November | 70,100 | 57,400 | 127,500 | 6.3 | 6.2 | 6.3 | |||
| December | 69,900 | 58,000 | 128,000 | 6.3 | 6.3 | 6.3 | |||
| 2017 | January | 71,100 | 59,600 | 130,800 | 6.4 | 6.4 | 6.4 | ||
| February | 71,500 | 58,900 | 130,400 | 6.4 | 6.3 | 6.4 | |||
| March | 69,600 | 54,400 | 124,000 | 6.2 | 5.8 | 6.0 | |||
| April | 67,700 | 49,200 | 116,900 | 6.1 | 5.3 | 5.7 | |||
| May | 66,400 | 46,500 | 112,900 | 5.9 | 5.0 | 5.5 | |||
| June | 66,100 | 46,300 | 112,400 | 5.9 | 5.0 | 5.5 | |||
| July | 66,900 | 49,800 | 116,700 | 5.9 | 5.3 | 5.6 | |||
| August | 66,600 | 49,600 | 116,200 | 5.9 | 5.2 | 5.6 | |||
| September | 66,500 | 50,400 | 116,900 | 5.9 | 5.3 | 5.6 | |||
| October | 66,800 | 50,500 | 117,300 | 5.9 | 5.3 | 5.6 | |||
| November | 64,500 | 49,900 | 114,400 | 5.7 | 5.2 | 5.5 | |||
| December | 61,900 | 48,400 | 110,300 | 5.5 | 5.1 | 5.3 | |||
| 2018 | January | 57,900 | 46,400 | 104,300 | 5.1 | 4.9 | 5.0 | ||
| February | 55,000 | 45,000 | 100,000 | 4.8 | 4.7 | 4.8 | |||
| March | 52,900 | 44,300 | 97,100 | 4.6 | 4.7 | 4.6 | |||
| April | 50,900 | 43,600 | 94,500 | 4.5 | 4.6 | 4.5 | |||
| May | 49,400 | 43,700 | 93,100 | 4.3 | 4.6 | 4.4 | |||
| June | 48,200 | 43,800 | 92,000 | 4.2 | 4.6 | 4.4 | |||
| July | 47,600 | 44,400 | 92,000 | 4.1 | 4.6 | 4.3 | |||
Purpose
The purpose of this release is to provide a detailed series of monthly unemployment estimates. The release contains both monthly unemployment rates and monthly unemployment volumes.
Calculation of Monthly Estimates
The Labour Force Survey (LFS) provides benchmark estimates of employment and unemployment for each quarter since the beginning of 1998. These quarterly benchmark estimates are then used to compile monthly data using the Proportional Denton method. The main characteristic of this method is that the monthly Live Register series is used as an indicator to disaggregate the quarterly LFS unemployment series into a monthly series in such a way as to minimise the differences between two consecutive months. It also ensures that the average of three months in a particular calendar quarter is equal to the corresponding LFS estimate.
For months where the quarterly unemployment data is not yet available, the ratio of the LFS monthly estimate to the Live Register monthly estimate (i.e. the benchmark to indicator ratio) is forecast forward in order to extrapolate a monthly LFS estimate. The monthly series is revised each quarter when the latest quarterly data becomes available. This approach adheres to agreed international practice.
Seasonal Adjustment
To correct for typical seasonal patterns, the data series included have been concurrently seasonally adjusted. This seasonal adjustment is completed by applying the X-12-ARIMA model, developed by the U.S. Census Bureau. In the case of these monthly unemployment estimates, seasonal adjustment is conducted using the indirect approach, where each individual series is independently adjusted. To preserve consistency between the individual and aggregate series, the series for gender, age group and total monthly unemployed are then created from these component series. The series for monthly unemployment rates are likewise created from these component series.
Additional Background Information
Further information regarding the LFS and Live Register series are available from each respective release, while specific information regarding the new LFS and the impact of the revisions arising from the Census of Population 2016 is available in an additional information note.
 Hide Background Notes
Scan the QR code below to view this release online or go to
http://www.cso.ie/en/releasesandpublications/er/mue/monthlyunemploymentjuly2018/
 Show Table 1a Seasonally adjusted monthly unemployment by sex - all persons aged 15-74 years
 Hide Table 1a Seasonally adjusted monthly unemployment by sex - all persons aged 15-74 years