
| Supply | Exports | Domestic uses | |
| '000 tonnes (carcass weight equivalent) | |||
| 2018 | 1,466 | 1,027 | 439 |
| 2019 | 1,449 | 1,009 | 440 |
| 2020 | 1,457 | 1,018 | 439 |
The supply of meat in Ireland in 2020 is estimated at 1.457 million tonnes, an increase of 8,000 tonnes (+0.6%) on 2019.
Livestock slaughterings increased by 39,000 tonnes (+3.4%) to 1.197 million tonnes. Imports decreased from 292,000 tonnes in 2019 to 261,000 tonnes, a decrease of 10.6%. Meat exports rose by 9,000 tonnes (+0.9%), up from 1.009 million tonnes in 2019 to 1.018 million tonnes in 2020.
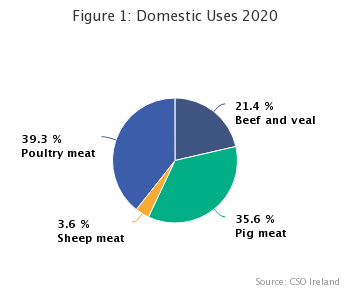
Of the total available supply of meat, exports accounted for 69.9% of the total, while the remaining 439,000 tonnes were consumed domestically. GIP increased by 4.3%, from 1.214 million tonnes to 1.266 million tonnes.
Self-sufficiency in meat increased from 276% in 2019 to 288% in 2020.
| Table 1: Meat Supply Balance 2018–2020 | ||||||||||
| Slaughterings | Imports of | Supplies | Exports of | Variation | Domestic | Human | Gross indigenous | Self- | ||
| meat | = Uses | meat | in stocks | Uses | consumption | production | Sufficiency | |||
| Category | 1 | 2 | 1+2=3+4+5 | 3 | 4 | 5 | 6 | 7 | 7/5 | |
| '000 tonnes (carcass weight equivalent) | kg per capita | '000 tonnes | % | |||||||
| Total meat | 2018 | 1,151 | 315 | 1,466 | 1,027 | 0 | 439 | 90.4 | 1,205 | 275 |
| 20191 | 1,157 | 292 | 1,449 | 1,009 | 0 | 440 | 89.4 | 1,214 | 276 | |
| 2020 | 1,197 | 261 | 1,457 | 1,018 | 0 | 439 | 88.2 | 1,266 | 288 | |
| Beef and veal | 2018 | 623 | 41 | 663 | 568 | 0 | 95 | 19.6 | 647 | 681 |
| 2019 | 620 | 36 | 656 | 561 | 0 | 96 | 19.4 | 650 | 681 | |
| 2020 | 633 | 35 | 668 | 574 | 0 | 94 | 18.9 | 670 | 712 | |
| Pig meat | 2018 | 303 | 124 | 427 | 277 | 0 | 150 | 30.9 | 344 | 230 |
| 2019 | 304 | 109 | 413 | 257 | 0 | 156 | 31.8 | 341 | 218 | |
| 2020 | 320 | 94 | 414 | 258 | 0 | 156 | 31.4 | 363 | 232 | |
| Sheep meat | 2018 | 68 | 6 | 74 | 56 | 0 | 18 | 3.7 | 58 | 319 |
| 2019 | 66 | 7 | 73 | 55 | 0 | 18 | 3.7 | 56 | 311 | |
| 2020 | 66 | 7 | 73 | 57 | 0 | 16 | 3.2 | 57 | 358 | |
| Poultry meat | 2018 | 157 | 145 | 302 | 126 | 0 | 176 | 36.2 | 157 | 89 |
| 20191 | 167 | 140 | 307 | 136 | 0 | 170 | 34.6 | 167 | 98 | |
| 2020 | 177 | 125 | 302 | 129 | 0 | 173 | 34.7 | 177 | 102 | |
| 1 Revised | ||||||||||
| Totals may not equal the sum of the categories due to rounding differences. | ||||||||||
| X-axis label | 2018 | 2019 | 2020 |
|---|---|---|---|
| Beef and veal | 53.6 | 53.5 | 52.9 |
| Pig meat | 28.6 | 28.1 | 28.6 |
| Sheep meat | 4.8 | 4.6 | 4.5 |
| Poultry meat | 13 | 13.8 | 14 |
The objective of a supply balance is to reconcile the total supplies of a product with the various uses of that product, including changes in stock levels. Supply balance sheets are compiled using harmonised concepts agreed between European Union member states.
The total supply of meat consists of the meat available from livestock slaughterings and imports. This supply may be used for exports, domestic uses or held in stock for future use. Only exports of meat and meat products need to be accounted for as animals exported live do not constitute part of the supply. Imports of live animals are also not accounted for separately as the imported live animals are slaughtered in the country and accounted for on the supply side as meat.
Supply and use must balance each other, i.e. the following equation must hold in any given year
Slaughterings + Imports of meat = Exports of meat + Domestic uses + Change in stocks
To ensure that the above equation always holds, one item in each product balance is always calculated as a balancing residual. The balancing item depends on the type of meat. For beef and veal and sheep, the balancing item is exports, while for pig meat and poultry, the balancing item is domestic uses.
The figures for livestock slaughterings include those carried out at both meat establishments approved by the Department of Agriculture, Food and the Marine (DAFM) and slaughterhouses and meat plants approved by Local Authorities under S.I. 432 of 2009. Poultry slaughtering figures are derived from data received from DAFM.
The figures for imports and exports of meat and meat products are derived from the CSO’s external trade statistics. The raw tonnage of internationally traded meat and meat products is converted to its carcass weight equivalent using a set of conversion factors agreed with European and national industry experts.
Variation in stocks is the net difference between the movement of products into and out of stock during the year. The variation in the stock of meat and meat products is usually very small compared to other items of the balance and, for this release, is assumed to be negligible.
Estimates for domestic uses of beef and veal and sheep meat are provided by Bord Bia. These include mainly human consumption both in households (retail) and services establishments such as restaurants and bars. It is assumed that the amount of meat used for other purposes, such as animal feed, and losses are negligible.
The estimates of per capita human consumption are derived by dividing the total domestic uses by the population estimate produced annually by the CSO. No account is taken of meat consumed while on overseas and cross-border trips.
Gross indigenous production (GIP) is calculated as livestock slaughterings plus exports of live animals minus imports of live animals, with all three items converted to carcass weight equivalent.
GIP = Livestock slaughterings + Live exports – Live imports
Self-sufficiency is defined as gross indigenous production expressed as a percentage of domestic uses. Self-sufficiency in excess of 100% for any of the products means that the country is a net exporter of the given product.
All figures in the release are shown in carcass weight equivalent.
Average carcass weights used for conversion are provided by DAFM (finished animals) and industry experts (calves and young cattle). The numbers of live animals traded in and out of the country are provided by DAFM.
For cattle, the carcass weight is defined as the slaughtered animal’s cold body weight after being skinned, bled and eviscerated and after removal of external genitalia, the limbs at the carpus and tarsus, head, tail, kidneys and kidney fats and the udder.
For sheep, the carcass weight is defined as the slaughtered animal’s cold body weight after being skinned, bled and eviscerated and after removal of the head, feet, tail and genital organs including the udder. Kidneys and kidney fats are included in the carcass weight.
For pigs, the carcass weight is defined as the slaughtered animal’s cold body weight either whole or divided in half along the mid-line, after being bled and eviscerated and after the removal of the tongue, bristles, hooves, genitalia, flare fat, kidneys and diaphragm.
When preparing the estimates for the current year’s release (year T), routine revisions are made to the estimates for the two previous years also (i.e. years T-1 and T-2). These revisions to previously published meat supply estimates tend to be minor and do not significantly impact on the overall results. For further details on the revisions policy, please refer to the release’s Quality Report.
Individual figures have been rounded independently and therefore the component items may not add to the totals shown or, in the case of percentages, to 100%.
 Hide Background Notes
Scan the QR code below to view this release online or go to
http://www.cso.ie/en/releasesandpublications/er/msb/meatsupplybalance2020/
 Show Table 1 Meat Supply Balance 2018–2020
 Hide Table 1 Meat Supply Balance 2018–2020