
| Domestic Milk Intake | |||||
| 2020 | 2021 | % change | |||
| million litres | |||||
| October | 646.8 | 662.5 | 2.4% | ||
| January - October | 7,587.4 | 8,046.2 | 6.0% | ||
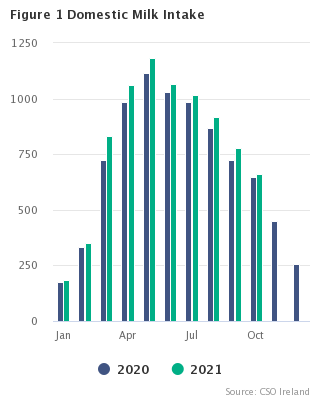
Domestic milk intake by creameries and pasteurisers was estimated at 662.5 million litres for October 2021. This represents an increase of 2.4% over October 2020. See figure 1.
The Protein content decreased from 3.99 % in October 2020 to 3.96% in October 2021. The Fat content increased from 4.71% to 4.76% for the same period.
During the period January to October 2021, domestic intake was estimated at 8046.2 million litres, an increase of 6% when compared to the corresponding period for 2020.
The information used to compile this release was collected under EU Directive 96/16/EC.
| Table 1 Milk Statistics | |||||||||||||||
| Category | Year | Unit | Jan | Feb | Mar | Apr | May | Jun | Jul | Aug | Sep | Oct | Nov | Dec | Year |
| Domestic milk intake | 2019 | million | 175.3 | 303.6 | 708.7 | 953.3 | 1072.2 | 1001.0 | 943.2 | 842.8 | 721.9 | 604.7 | 418.1 | 241.4 | 7986.2 |
| by creameries and | 2020 | litres | 176.2 | 331.7 | 725.7 | 982.7 | 1115.3 | 1031.0 | 985.0 | 867.6 | 725.4 | 646.8 | 449.8 | 255.8 | 8293.0 |
| pasteurisers | 2021 | 182.2 | 352.4 | 829.7 | 1060.5 | 1181.0 | 1067.3 | 1017.3 | 917.4 | 776 1 | 662.5 | ||||
| Fat content | 2019 | % | 4.21 | 4.32 | 4.23 | 3.94 | 3.85 | 3.92 | 3.96 | 4.16 | 4.42 | 4.74 | 4.84 | 4.58 | 4.17 |
| 2020 | 4.31 | 4.29 | 4.27 | 3.97 | 3.87 | 3.97 | 4.04 | 4.17 | 4.43 | 4.71 | 4.86 | 4.67 | 4.20 | ||
| 2021 | 4.42 | 4.45 | 4.32 | 3.98 | 3.94 | 3.97 | 3.99 | 4.19 | 4.43 | 4.76 | |||||
| Protein content | 2019 | % | 3.42 | 3.47 | 3.32 | 3.40 | 3.44 | 3.46 | 3.46 | 3.55 | 3.79 | 3.94 | 3.85 | 3.62 | 3.54 |
| 2020 | 3.48 | 3.38 | 3.29 | 3.43 | 3.46 | 3.45 | 3.51 | 3.57 | 3.78 | 3.99 | 3.85 | 3.67 | 3.55 | ||
| 2021 | 3.51 | 3.44 | 3.33 | 3.45 | 3.49 | 3.47 | 3.43 | 3.54 | 3.74 | 3.96 | |||||
| Imported milk intake 2 | 2019 | million | 71.3 | 71.1 | 72.0 | 56.9 | 55.5 | 60.1 | 53.3 | * | 58.9 | * | * | * | 710.6 |
| 2020 | litres | * | * | * | * | * | * | * | * | * | * | * | * | * | |
| 2021 | * | * | * | * | * | * | * | * | * | * | |||||
| Total milk sold for human | 2019 | million | 44.8 | 41.9 | 46.7 | 45.2 | 45.3 | 45.0 | 44.7 | 45.1 | 43.4 | 45.4 | 43.7 | 41.8 | 533.2 |
| consumption 3 | 2020 | litres | 43.1 | 42.5 | 45.8 | 47.1 | 47.3 | 45.7 | 47.4 | 44.4 | 41.7 | 41.1 | 39.5 | 39.9 | 525.4 |
| 2021 | 40.4 | 36.3 | 42.1 | 42.9 | 46.6 | 44.7 | 45.2 | 44.8 | 41.7 1 | 41.9 | |||||
| of which: | 2019 | million | 26.9 | 25.3 | 29.0 | 28.5 | 28.2 | 29.4 | 29.1 | 28.6 | 26.8 | 28.9 | 26.8 | 25.8 | 333.1 |
| Whole milk sales | 2020 | litres | 26.1 | 25.8 | 29.1 | 32.0 | 31.6 | 30.6 | 31.5 | 28.9 | 26.7 | 26.3 | 25.0 | 25.1 | 338.6 |
| 2021 | 25.1 | 22.4 | 26.5 | 27.7 | 30.8 | 29.7 | 30.2 | 29.0 | 26.6 1 | 26.1 | |||||
| . | . | ||||||||||||||
| Skimmed & semi- | 2019 | million | 17.9 | 16.6 | 17.7 | 16.8 | 17.2 | 15.6 | 15.7 | 16.6 | 16.7 | 16.5 | 16.9 | 16.1 | 200.1 |
| skimmed milk sales | 2020 | litres | 17.0 | 16.7 | 16.7 | 15.2 | 15.7 | 15.1 | 15.9 | 15.4 | 15.0 | 14.8 | 14.5 | 14.8 | 186.8 |
| 2021 | 15.3 | 13.9 | 15.6 | 15.2 | 15.8 | 15.0 | 15.1 | 15.8 | 15.1 1 | 15.8 | |||||
| Butter | 2019 | '000 | 8.2 | 10.6 | 22.2 | 28.4 | 31.0 | 28.1 | 28.2 | 25.5 | 22.3 | 20.2 | 15.1 | 10.9 | 250.8 |
| 2020 | tonnes | 7.2 | 11.2 | 22.6 | 29.0 | 29.8 | 30.3 | 30.9 | 26.2 | 24.0 | 22.9 | 17.6 | 13.0 | 264.7 | |
| 2021 | 6.5 | 10.7 | 26.9 | 30.5 | 31.4 | 31.5 | 30.8 | 28.8 | 26.5 1 | 22.4 4 | |||||
| Skimmed milk powder | 2019 | '000 | 5.2 | * | 5.8 | 21.4 | 24.2 | 18.4 | 19.1 | 12.3 | 9.1 | 8.6 | * | 10.2 | 142.5 |
| 2020 | tonnes | * | 2.8 | 7.3 | 18.9 | 24.6 | 20.1 | 20.3 | 17.8 | 12.5 | 8.3 | * | * | 150.1 | |
| 2021 | * | * | 11.4 | 17.7 | 27.7 | 20.6 | 26.1 | 24.6 1 | 12.3 | 8.1 | |||||
| Cheese | 2018 | tonnes | 3.5 | 11.6 | 25.4 | 25.6 | 30.7 | 32.9 | 26.6 | 29.9 | 31.0 | 27.1 | 20.0 | 5.2 | 269.4 |
| 2019 | 3.6 | 9.2 | 25.0 | 27.7 | 31.7 | 33.3 | 28.6 | 31.4 | 32.2 | 26.8 | 23.5 | 5.4 | 278.4 | ||
| 2020 | 3.3 | 9.3 | 30.6 | 28.2 | 31.6 | 34.3 | 28.7 | 29.7 | 33.9 | 27.8 | 21.4 | 6.8 | 285.4 | ||
| 1 Revised. | |||||||||||||||
| 2 Raw milk imports and imported milk for processing on contract. This does not include imported packaged milk for retail sale. | |||||||||||||||
| 3 Does not include imported packaged milk for retail sale. | |||||||||||||||
| 4 Provisional | |||||||||||||||
| * Confidential. | |||||||||||||||
| Table 2 EU Milk intake by creameries and pasteurisers | ‘000 tonnes | ||
| Country | Jan - Sep 20 | Jan - Sep 21 | % change |
| Austria | 2,403 | 2,395 | -0.3 |
| Belgium | 3,356 | 3331 1 | -0.7 |
| Bulgaria | 536 | 534 | -0.4 |
| Croatia | 330 | 329 | -0.3 |
| Cyprus | 200 | 225 | 12.5 |
| Czech Republic | 2,427 | 2,364 | -2.6 |
| Denmark | 4,283 | 4,270 | -0.3 |
| Estonia | 598 | 601 | 0.6 |
| Finland | 1,797 | 1,726 | -4.0 |
| France | 18662 2 | ||
| Germany | 24,758 | 24,361 | -1.6 |
| Greece | 495 | 502 | 1.4 |
| Hungary | 1,229 | 1,304 | 6.0 |
| Ireland | 7,147 | 7,603 | 6.4 |
| Italy | 8958 2 | 9375 2 | 4.7 |
| Latvia | 600 | 616 2 | 2.8 |
| Lithuania | 1,037 | 1,019 | -1.7 |
| Luxembourg | * | * | |
| Malta | 32 | 30 | -7.0 |
| Netherlands | 10,557 | 10,335 | -2.1 |
| Poland | 9,483 | 9,511 | 0.3 |
| Portugal | 1,467 | 1,463 | -0.3 |
| Romania | 875 2 | 874 2 | -0.1 |
| Slovakia | 636 | 625 | -1.6 |
| Slovenia | 440 | 448 | 1.9 |
| Spain | 5623 2 | ||
| Sweden | 2,092 | 2,114 | 1.0 |
| Source: New Cronos database, Eurostat (except Ireland, CSO). | |||
| 1 Estimate. | |||
| 2 Provisional. | |||
| * Confidential. | |||
The monthly milk and milk products inquiry is a census of creameries and pasteurisers.
Whole milk purchased by creameries and pasteurisers from domestic producers through collection depots and separating stations including whole milk obtained from herds owned by the creameries and pasteurisers. The fat content of the whole milk is also collected. To convert milk intake from million litres to ‘000 tonnes use the following formula:
1 tonne liquid milk = 971.16 litres.
Milk with less than or equal to 0.3% fat content.
Milk with between 1.5% and 1.8% fat content.
Milk powder with not more than 1.5% milk fat content.
The cheese figures are not adjusted to a calendar month basis.
Raw milk imports and imported milk for processing on contract. This does not include milk already packaged for retail sale.
 Hide Background Notes
Scan the QR code below to view this release online or go to
http://www.cso.ie/en/releasesandpublications/er/ms/milkstatisticsoctober2021/
 Show Table 1 Milk Statistics
 Hide Table 1 Milk Statistics