
The data in this release for 2020 would have been impacted by Covid-19
| Metered Electricity Consumption by Tariff Group 2020 | |||||
| Gigawatt hours | % change | ||||
| Tariff Groups | 2015 | 2019 | 2020 | 2020/2019 | 2020/2015 |
| Urban Residential | 5,490 | 5,416 | 6,010 | +11% | +9% |
| Rural Residential | 2,880 | 2,923 | 3,220 | +10% | +12% |
| Public Lighting | 53 | 56 | 56 | 0% | +6% |
| Non-Metered | 231 | 217 | 209 | -4% | -10% |
| Low Voltage Business (Non Maximum Demand) | 3,595 | 3,518 | 3,248 | -8% | -10% |
| Low Voltage Business (Maximum Demand) | 3,546 | 3,772 | 3,344 | -11% | -6% |
| Medium Voltage (Maximum Demand) | 5,171 | 5,490 | 5,379 | -2% | +4% |
| Large Customers | 3,633 | 5,113 | 5,589 | +9% | +54% |
| Total | 24,600 | 26,505 | 27,056 | +2% | +10% |
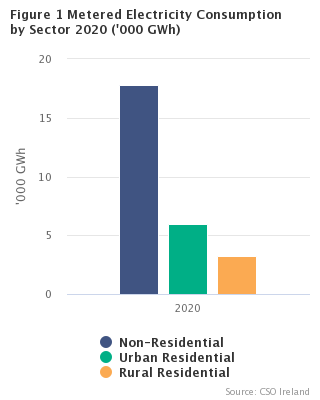
The total metered electricity consumption in 2020 was 27,056 gigawatt hours of which 21% was consumed by the large customer DUoS groups (see Headline table and Table 1). Metered electricity consumption increased by 2.1% in 2020 compared with 2019. The consumption by Urban Residential and Rural Residential tariff groups rose by 11% and 10.2% respectively in 2020 compared with 2019. There were decreases in consumption across all non-residential groups except the large customer DUoS groups which increased by 9.3% - this category comprises a small number of customers such as the largest data centres and the highest electricity consumers in other business sectors such as IT and cement manufacturing. The consumption of the large customer DUoS groups increased by 54% between 2015 and 2020.
On a quarterly basis, the main seasonal variation was in the residential sector with 29% of consumption in 2020 in the first quarter compared with 22% in the third quarter (see Tables 2A and 2C).
Dublin postal districts had the highest proportion of residential consumption in 2020 with 18.7% (see Table 3B). Cork (12%), Dublin county (6.9%), Galway (5.7%), and Kildare (4.6%) were the next highest. Counties with dwellings using electricity as their main space heating fuel as well as number of meters are likely to be the main underlying factors determining residential demand. Table 8 of the CSO Domestic Building Energy Ratings release classifies dwellings by county and main space heating fuel.
Dublin 2 with 12.6% had the highest proportion of non-residential electricity consumption in 2020 for the Dublin postal districts area (see Table 4A). In contrast, Dublin 15 (10.2%) and Dublin 24 (8.5%) were the postal districts with the highest proportions of consumption of Dublin post districts residential electricity (see Table 4B).
| Median consumption | |
| Carlow | 3.815 |
| Cavan | 3.546 |
| Clare | 3.48 |
| Cork | 3.696 |
| Donegal | 2.896 |
| Dublin County | 3.833 |
| Dublin Postal Districts | 3.552 |
| Galway | 3.855 |
| Kerry | 3.348 |
| Kildare | 4.224 |
| Kilkenny | 3.875 |
| Laois | 3.874 |
| Leitrim | 2.945 |
| Limerick | 3.67 |
| Longford | 3.508 |
| Louth | 3.629 |
| Mayo | 3.215 |
| Meath | 4.114 |
| Monaghan | 3.579 |
| Offaly | 3.835 |
| Roscommon | 3.162 |
| Sligo | 3.342 |
| Tipperary | 3.721 |
| Waterford | 3.634 |
| Westmeath | 3.855 |
| Wexford | 3.765 |
| Wicklow | 4.072 |
| Not Coded | 2.444 |
Tables 5A to 5E show median residential electricity consumption by year, quarter, county, and Dublin postal district. January to March had the highest median consumption. Donegal (2,896 kWh), Leitrim (2,945 kWh), and Roscommon (3,162 kWh) had the lowest median residential consumption in 2020. Kildare with 4,224 kWh had the highest figure (see Table 5B).
The number of non-residential electricity meters increased from 274,094 in 2015 to 287,420 in 2020 (see Table 6A). The number of residential electricity meters increased by around 83,000 meters in the 2015-2020 period. There were 2.1 million residential meters in 2020 (see Table 6B) - see note below regarding the inclusion of small businesses in the residential categories.
Electricity consumption can be used as an indirect indicator of vacant and holiday dwellings. Around 10% of residential customers consumed less than 1,000 kilowatt hours in 2020 which was well below the median of 3,658 kilowatt hours.
|
The residential DUoS groups include some small non-residential consumption such as newsagents and farms. The allocation of customers to counties was mainly done by the CSO using the addresses provided. In some cases, these addresses contained placenames only and not the county name. |
| Consumption size class | |
| 0<50kWh | 47.756 |
| 50<100kWh | 12.857 |
| 100<500kWh | 69.653 |
| 500<1,000kWh | 81.434 |
| 1,000<2,500kWh | 427.318 |
| 2,500<5,000kWh | 834.594 |
| 5,000<7,500kWh | 410.098 |
| 7,500<10,000kWh | 136.352 |
| 10,000kWh + | 102.625 |
| Table 1 Total Metered Electricity Consumption by Tariff Group 2015-2020 (GWh) | ||||||
| Gigawatt hours | ||||||
| Tariff Group | 2015 | 2016 | 2017 | 2018 | 2019 | 2020 |
| Urban Residential | 5,490 | 5,486 | 5,489 | 5,644 | 5,416 | 6,010 |
| Rural Residential | 2,880 | 2,911 | 2,925 | 3,027 | 2,923 | 3,220 |
| Public Lighting | 53 | 55 | 56 | 56 | 56 | 56 |
| Non-Metered | 231 | 230 | 228 | 224 | 217 | 209 |
| Low Voltage Business (Non Maximum Demand) | 3,595 | 3,591 | 3,573 | 3,658 | 3,518 | 3,248 |
| Low Voltage Business (Maximum Demand) | 3,546 | 3,750 | 3,731 | 3,780 | 3,772 | 3,344 |
| Medium Voltage (Maximum Demand) | 5,171 | 5,243 | 5,387 | 5,579 | 5,490 | 5,379 |
| Large Customers | 3,633 | 4,090 | 4,337 | 4,762 | 5,113 | 5,589 |
| Total | 24,600 | 25,356 | 25,725 | 26,730 | 26,505 | 27,056 |
| Table 2A Total Metered Electricity Consumption by Quarter 2015-2020 (GWh) | |||||||||
| Gigawatt hours | % of row | ||||||||
| Year | Jan-Mar | Apr-Jun | Jul-Sep | Oct-Dec | Total | % Q1 | % Q2 | % Q3 | % Q4 |
| 2015 | 6,565 | 6,086 | 5,783 | 6,165 | 24,600 | 27 | 25 | 24 | 25 |
| 2016 | 6,651 | 6,471 | 5,926 | 6,307 | 25,356 | 26 | 26 | 23 | 25 |
| 2017 | 6,867 | 6,429 | 5,969 | 6,461 | 25,725 | 27 | 25 | 23 | 25 |
| 2018 | 7,097 | 6,845 | 6,187 | 6,601 | 26,730 | 27 | 26 | 23 | 25 |
| 2019 | 7,128 | 6,349 | 6,300 | 6,728 | 26,505 | 27 | 24 | 24 | 25 |
| 2020 | 7,399 | 6,429 | 6,381 | 6,847 | 27,056 | 27 | 24 | 24 | 25 |
| Table 2B Non-Residential Metered Electricity Consumption by Quarter for 2015-2020 (GWh) | |||||||||
| Gigawatt hours | % of row | ||||||||
| Non-Residential | Jan-Mar | Apr-Jun | Jul-Sep | Oct-Dec | Total | % Q1 | % Q2 | % Q3 | % Q4 |
| 2015 | 4,060 | 4,007 | 3,954 | 4,209 | 16,230 | 25 | 25 | 24 | 26 |
| 2016 | 4,194 | 4,312 | 4,112 | 4,341 | 16,959 | 25 | 25 | 24 | 26 |
| 2017 | 4,315 | 4,357 | 4,178 | 4,462 | 17,312 | 25 | 25 | 24 | 26 |
| 2018 | 4,463 | 4,584 | 4,399 | 4,614 | 18,059 | 25 | 25 | 24 | 26 |
| 2019 | 4,550 | 4,488 | 4,437 | 4,690 | 18,165 | 25 | 25 | 24 | 26 |
| 2020 | 4,709 | 4,151 | 4,312 | 4,654 | 17,825 | 26 | 23 | 24 | 26 |
| Table 2C Residential Metered Electricity Consumption by Quarter for 2015-2020 (GWh) | |||||||||
| Gigawatt hours | % of row | ||||||||
| Residential | Jan-Mar | Apr-Jun | Jul-Sep | Oct-Dec | Total | % Q1 | % Q2 | % Q3 | % Q4 |
| 2015 | 2,505 | 2,079 | 1,830 | 1,957 | 8,370 | 30 | 25 | 22 | 23 |
| 2016 | 2,457 | 2,159 | 1,814 | 1,967 | 8,397 | 29 | 26 | 22 | 23 |
| 2017 | 2,552 | 2,072 | 1,790 | 1,999 | 8,414 | 30 | 25 | 21 | 24 |
| 2018 | 2,634 | 2,261 | 1,789 | 1,987 | 8,671 | 30 | 26 | 21 | 23 |
| 2019 | 2,578 | 1,861 | 1,863 | 2,038 | 8,340 | 31 | 22 | 22 | 24 |
| 2020 | 2,690 | 2,278 | 2,069 | 2,193 | 9,231 | 29 | 25 | 22 | 24 |
| Table 3A Non-Residential Metered Electricity Consumption by County for 2015-2020 (GWh) | ||||||
| Gigawatt hours | ||||||
| County | 2015 | 2016 | 2017 | 2018 | 2019 | 2020 |
| Carlow | 142 | 146 | 150 | 156 | 155 | 144 |
| Cavan | 324 | 338 | 329 | 328 | 331 | 327 |
| Clare | 324 | 331 | 334 | 334 | 326 | 290 |
| Cork | 1,810 | 1,854 | 1,864 | 1,919 | 1,901 | 1,815 |
| Donegal | 333 | 338 | 346 | 354 | 352 | 334 |
| Dublin County | 812 | 830 | 835 | 857 | 850 | 804 |
| Dublin Postal Districts | 3,344 | 3,382 | 3,433 | 3,519 | 3,419 | 3,111 |
| Galway | 638 | 655 | 657 | 677 | 655 | 601 |
| Kerry | 389 | 393 | 393 | 407 | 349 | 310 |
| Kildare | 549 | 555 | 557 | 571 | 566 | 537 |
| Kilkenny | 207 | 218 | 217 | 233 | 235 | 209 |
| Laois | 159 | 162 | 163 | 168 | 165 | 160 |
| Leitrim | 61 | 61 | 61 | 63 | 61 | 55 |
| Limerick | 660 | 674 | 695 | 718 | 712 | 684 |
| Longford | 134 | 138 | 141 | 146 | 151 | 150 |
| Louth | 316 | 328 | 333 | 337 | 315 | 286 |
| Mayo | 344 | 350 | 350 | 365 | 354 | 334 |
| Meath | 307 | 318 | 327 | 336 | 335 | 328 |
| Monaghan | 219 | 228 | 231 | 236 | 234 | 222 |
| Offaly | 156 | 161 | 163 | 173 | 167 | 162 |
| Roscommon | 132 | 133 | 133 | 137 | 135 | 133 |
| Sligo | 183 | 185 | 178 | 177 | 173 | 164 |
| Tipperary | 459 | 472 | 475 | 483 | 466 | 454 |
| Waterford | 450 | 447 | 456 | 469 | 467 | 455 |
| Westmeath | 282 | 288 | 295 | 289 | 271 | 276 |
| Wexford | 326 | 338 | 347 | 356 | 350 | 332 |
| Wicklow | 290 | 290 | 279 | 287 | 291 | 277 |
| Not Coded | 2,882 | 3,345 | 3,570 | 3,963 | 4,379 | 4,871 |
| Total | 16,230 | 16,959 | 17,312 | 18,059 | 18,165 | 17,825 |
| Table 3B Residential Metered Electricity Consumption by County for 2015-2020 (GWh) | ||||||
| Gigawatt hours | ||||||
| County | 2015 | 2016 | 2017 | 2018 | 2019 | 2020 |
| Carlow | 107 | 109 | 110 | 113 | 111 | 122 |
| Cavan | 138 | 137 | 138 | 142 | 137 | 151 |
| Clare | 205 | 202 | 205 | 210 | 201 | 224 |
| Cork | 1,001 | 1,010 | 1,009 | 1,046 | 998 | 1,108 |
| Donegal | 273 | 272 | 272 | 279 | 271 | 297 |
| Dublin County | 582 | 575 | 575 | 589 | 571 | 637 |
| Dublin Postal Districts | 1,612 | 1,612 | 1,602 | 1,645 | 1,561 | 1,724 |
| Galway | 474 | 474 | 478 | 496 | 478 | 527 |
| Kerry | 300 | 298 | 300 | 311 | 299 | 325 |
| Kildare | 372 | 377 | 378 | 390 | 378 | 425 |
| Kilkenny | 163 | 165 | 166 | 172 | 167 | 184 |
| Laois | 131 | 132 | 134 | 139 | 136 | 151 |
| Leitrim | 65 | 64 | 64 | 66 | 64 | 70 |
| Limerick | 362 | 367 | 369 | 377 | 363 | 400 |
| Longford | 76 | 77 | 78 | 80 | 77 | 86 |
| Louth | 229 | 228 | 228 | 233 | 225 | 250 |
| Mayo | 240 | 237 | 236 | 244 | 235 | 258 |
| Meath | 317 | 324 | 325 | 338 | 331 | 369 |
| Monaghan | 113 | 115 | 115 | 118 | 115 | 126 |
| Offaly | 125 | 127 | 128 | 133 | 127 | 141 |
| Roscommon | 100 | 96 | 96 | 100 | 97 | 107 |
| Sligo | 119 | 118 | 119 | 121 | 116 | 128 |
| Tipperary | 316 | 322 | 325 | 336 | 320 | 355 |
| Waterford | 226 | 230 | 230 | 236 | 230 | 251 |
| Westmeath | 179 | 177 | 179 | 185 | 179 | 196 |
| Wexford | 290 | 293 | 295 | 303 | 295 | 327 |
| Wicklow | 256 | 260 | 261 | 268 | 258 | 291 |
| Not Coded | 0 | 0 | 0 | 0 | 0 | 0 |
| Total | 8,370 | 8,397 | 8,414 | 8,671 | 8,340 | 9,231 |
| Table 4A Non-Residential Metered Electricity Consumption by Dublin Postal District for 2015-2020 (GWh) | ||||||
| Gigawatt hours | ||||||
| Non-Residential | 2015 | 2016 | 2017 | 2018 | 2019 | 2020 |
| Dublin 01 | 325 | 322 | 320 | 324 | 317 | 258 |
| Dublin 02 | 492 | 500 | 486 | 494 | 492 | 393 |
| Dublin 03 | 88 | 90 | 89 | 92 | 91 | 79 |
| Dublin 04 | 275 | 297 | 289 | 293 | 279 | 243 |
| Dublin 05 | 64 | 63 | 64 | 65 | 62 | 60 |
| Dublin 06 | 55 | 58 | 59 | 59 | 57 | 52 |
| Dublin 06W | 15 | 17 | 17 | 17 | 16 | 14 |
| Dublin 07 | 131 | 131 | 130 | 134 | 133 | 121 |
| Dublin 08 | 168 | 166 | 166 | 170 | 170 | 157 |
| Dublin 09 | 109 | 109 | 107 | 108 | 106 | 95 |
| Dublin 10 | 54 | 53 | 53 | 52 | 52 | 48 |
| Dublin 11 | 120 | 122 | 119 | 122 | 122 | 125 |
| Dublin 12 | 216 | 212 | 220 | 219 | 217 | 205 |
| Dublin 13 | 36 | 35 | 34 | 34 | 34 | 32 |
| Dublin 14 | 62 | 66 | 66 | 65 | 62 | 57 |
| Dublin 15 | 306 | 299 | 320 | 345 | 349 | 349 |
| Dublin 16 | 59 | 60 | 58 | 57 | 54 | 43 |
| Dublin 17 | 120 | 128 | 151 | 121 | 114 | 103 |
| Dublin 18 | 133 | 131 | 131 | 131 | 130 | 119 |
| Dublin 20 | 14 | 14 | 14 | 14 | 14 | 13 |
| Dublin 22 | 207 | 203 | 214 | 235 | 267 | 283 |
| Dublin 24 | 294 | 303 | 324 | 367 | 282 | 262 |
| Total | 3,344 | 3,382 | 3,433 | 3,519 | 3,419 | 3,111 |
| Table 4B Residential Metered Electricity Consumption by Dublin Postal District for 2015-2020 (GWh) | ||||||
| Gigawatt hours | ||||||
| Residential | 2015 | 2016 | 2017 | 2018 | 2019 | 2020 |
| Dublin 01 | 68 | 60 | 59 | 63 | 60 | 64 |
| Dublin 02 | 34 | 35 | 34 | 35 | 32 | 35 |
| Dublin 03 | 74 | 66 | 66 | 68 | 66 | 70 |
| Dublin 04 | 83 | 91 | 90 | 92 | 85 | 95 |
| Dublin 05 | 75 | 74 | 74 | 75 | 72 | 78 |
| Dublin 06 | 72 | 82 | 81 | 84 | 76 | 87 |
| Dublin 06W | 37 | 42 | 42 | 42 | 39 | 45 |
| Dublin 07 | 107 | 93 | 93 | 96 | 93 | 98 |
| Dublin 08 | 104 | 103 | 101 | 105 | 98 | 107 |
| Dublin 09 | 87 | 84 | 83 | 85 | 83 | 89 |
| Dublin 10 | 28 | 28 | 28 | 29 | 27 | 30 |
| Dublin 11 | 88 | 86 | 86 | 88 | 84 | 91 |
| Dublin 12 | 70 | 81 | 80 | 81 | 74 | 84 |
| Dublin 13 | 62 | 56 | 57 | 58 | 57 | 63 |
| Dublin 14 | 69 | 78 | 77 | 79 | 73 | 83 |
| Dublin 15 | 158 | 155 | 156 | 161 | 157 | 175 |
| Dublin 16 | 72 | 80 | 79 | 79 | 77 | 86 |
| Dublin 17 | 27 | 31 | 32 | 33 | 28 | 34 |
| Dublin 18 | 78 | 69 | 69 | 72 | 71 | 77 |
| Dublin 20 | 20 | 19 | 19 | 20 | 18 | 21 |
| Dublin 22 | 68 | 64 | 64 | 65 | 63 | 68 |
| Dublin 24 | 130 | 134 | 133 | 137 | 130 | 146 |
| Total | 1,612 | 1,612 | 1,602 | 1,645 | 1,561 | 1,724 |
| Table 5A Residential Median Metered Electricity Consumption by Quarter for 2015-2020 (kWh) | |||||
| Median kilowatt hours | |||||
| Year | Jan-Mar | Apr-Jun | Jul-Sep | Oct-Dec | Annual |
| 2015 | 941 | 809 | 707 | 758 | 3,450 |
| 2016 | 926 | 804 | 694 | 752 | 3,499 |
| 2017 | 950 | 770 | 674 | 755 | 3,471 |
| 2018 | 952 | 816 | 662 | 739 | 3,506 |
| 2019 | 930 | 666 | 685 | 746 | 3,324 |
| 2020 | 943 | 818 | 752 | 794 | 3,658 |
| Table 5B Residential Median Metered Electricity Consumption by County for 2015-2020 (kWh) | ||||||
| Median kilowatt hours | ||||||
| County | 2015 | 2016 | 2017 | 2018 | 2019 | 2020 |
| Carlow | 3,437 | 3,583 | 3,572 | 3,624 | 3,506 | 3,815 |
| Cavan | 3,305 | 3,349 | 3,323 | 3,383 | 3,210 | 3,546 |
| Clare | 3,224 | 3,227 | 3,235 | 3,271 | 3,108 | 3,480 |
| Cork | 3,466 | 3,507 | 3,469 | 3,533 | 3,338 | 3,696 |
| Donegal | 2,679 | 2,732 | 2,715 | 2,760 | 2,641 | 2,896 |
| Dublin County | 3,722 | 3,724 | 3,675 | 3,657 | 3,463 | 3,833 |
| Dublin Postal Districts | 3,446 | 3,487 | 3,440 | 3,457 | 3,245 | 3,552 |
| Galway | 3,563 | 3,616 | 3,608 | 3,680 | 3,521 | 3,855 |
| Kerry | 3,145 | 3,175 | 3,172 | 3,224 | 3,082 | 3,348 |
| Kildare | 4,023 | 4,053 | 4,015 | 4,020 | 3,820 | 4,224 |
| Kilkenny | 3,628 | 3,681 | 3,655 | 3,692 | 3,527 | 3,875 |
| Laois | 3,494 | 3,598 | 3,604 | 3,671 | 3,543 | 3,874 |
| Leitrim | 2,679 | 2,734 | 2,745 | 2,822 | 2,694 | 2,945 |
| Limerick | 3,393 | 3,481 | 3,477 | 3,495 | 3,339 | 3,670 |
| Longford | 3,134 | 3,268 | 3,281 | 3,342 | 3,184 | 3,508 |
| Louth | 3,536 | 3,532 | 3,492 | 3,510 | 3,313 | 3,629 |
| Mayo | 2,986 | 3,018 | 2,983 | 3,071 | 2,922 | 3,215 |
| Meath | 3,954 | 4,016 | 3,958 | 3,962 | 3,789 | 4,114 |
| Monaghan | 3,357 | 3,444 | 3,405 | 3,469 | 3,304 | 3,579 |
| Offaly | 3,543 | 3,620 | 3,618 | 3,696 | 3,471 | 3,835 |
| Roscommon | 2,963 | 2,904 | 2,893 | 2,990 | 2,860 | 3,162 |
| Sligo | 3,135 | 3,193 | 3,184 | 3,226 | 3,028 | 3,342 |
| Tipperary | 3,410 | 3,512 | 3,506 | 3,556 | 3,357 | 3,721 |
| Waterford | 3,396 | 3,493 | 3,458 | 3,472 | 3,334 | 3,634 |
| Westmeath | 3,631 | 3,636 | 3,655 | 3,698 | 3,530 | 3,855 |
| Wexford | 3,433 | 3,539 | 3,517 | 3,546 | 3,378 | 3,765 |
| Wicklow | 3,800 | 3,907 | 3,897 | 3,902 | 3,660 | 4,072 |
| Not Coded | 3,925 | 3,690 | 3,333 | 3,530 | 3,305 | 2,444 |
| State | 3,450 | 3,499 | 3,471 | 3,506 | 3,324 | 3,658 |
| Table 5C Residential Median Metered Electricity Consumption by Dublin Postal District for 2015-2020 (kWh) | ||||||
| Median kilowatt hours | ||||||
| Dublin Postal District | 2015 | 2016 | 2017 | 2018 | 2019 | 2020 |
| Dublin 01 | 3,948 | 3,452 | 3,412 | 3,597 | 3,412 | 3,550 |
| Dublin 02 | 3,219 | 3,367 | 3,271 | 3,347 | 2,893 | 3,140 |
| Dublin 03 | 3,653 | 3,244 | 3,228 | 3,288 | 3,196 | 3,357 |
| Dublin 04 | 2,973 | 3,354 | 3,319 | 3,347 | 3,037 | 3,451 |
| Dublin 05 | 3,384 | 3,383 | 3,350 | 3,370 | 3,200 | 3,473 |
| Dublin 06 | 2,743 | 3,173 | 3,124 | 3,217 | 2,915 | 3,372 |
| Dublin 06W | 3,146 | 3,606 | 3,575 | 3,562 | 3,202 | 3,672 |
| Dublin 07 | 3,589 | 3,128 | 3,097 | 3,131 | 3,022 | 3,180 |
| Dublin 08 | 3,089 | 3,114 | 3,079 | 3,098 | 2,884 | 3,151 |
| Dublin 09 | 3,335 | 3,250 | 3,222 | 3,245 | 3,100 | 3,300 |
| Dublin 10 | 3,301 | 3,325 | 3,275 | 3,245 | 3,109 | 3,332 |
| Dublin 11 | 3,271 | 3,294 | 3,232 | 3,265 | 3,072 | 3,369 |
| Dublin 12 | 2,726 | 3,168 | 3,122 | 3,150 | 2,830 | 3,201 |
| Dublin 13 | 4,076 | 3,650 | 3,593 | 3,537 | 3,407 | 3,589 |
| Dublin 14 | 3,276 | 3,695 | 3,588 | 3,580 | 3,266 | 3,710 |
| Dublin 15 | 3,801 | 3,715 | 3,668 | 3,666 | 3,505 | 3,853 |
| Dublin 16 | 3,466 | 3,871 | 3,788 | 3,742 | 3,551 | 3,926 |
| Dublin 17 | 3,156 | 3,705 | 3,643 | 3,702 | 3,160 | 3,843 |
| Dublin 18 | 4,091 | 3,571 | 3,495 | 3,502 | 3,407 | 3,632 |
| Dublin 20 | 3,486 | 3,518 | 3,486 | 3,555 | 3,257 | 3,711 |
| Dublin 22 | 3,985 | 3,798 | 3,767 | 3,740 | 3,577 | 3,840 |
| Dublin 24 | 3,897 | 4,050 | 3,955 | 3,950 | 3,705 | 4,072 |
| Dublin Postal Districts | 3,446 | 3,487 | 3,440 | 3,457 | 3,245 | 3,552 |
| Table 5D Residential Median Metered Electricity Consumption by County and Quarter for 2020 (kWh) | |||||
| Median kilowatt hours | |||||
| County | Jan-Mar | Apr-Jun | Jul-Sep | Oct-Dec | Ratio Q1/Q3 |
| Carlow | 927 | 929 | 765 | 859 | 1.2 |
| Cavan | 916 | 743 | 748 | 763 | 1.2 |
| Clare | 902 | 732 | 728 | 738 | 1.2 |
| Cork | 989 | 820 | 766 | 776 | 1.3 |
| Donegal | 727 | 620 | 610 | 625 | 1.2 |
| Dublin County | 964 | 874 | 823 | 877 | 1.2 |
| Dublin Postal Districts | 903 | 826 | 717 | 797 | 1.3 |
| Galway | 1,014 | 857 | 770 | 802 | 1.3 |
| Kerry | 857 | 721 | 688 | 720 | 1.2 |
| Kildare | 1,110 | 929 | 902 | 898 | 1.2 |
| Kilkenny | 985 | 853 | 800 | 865 | 1.2 |
| Laois | 986 | 877 | 803 | 851 | 1.2 |
| Leitrim | 803 | 602 | 620 | 588 | 1.3 |
| Limerick | 944 | 818 | 735 | 800 | 1.3 |
| Longford | 894 | 798 | 686 | 754 | 1.3 |
| Louth | 978 | 787 | 777 | 774 | 1.3 |
| Mayo | 839 | 698 | 661 | 658 | 1.3 |
| Meath | 1,084 | 934 | 873 | 893 | 1.2 |
| Monaghan | 922 | 796 | 745 | 782 | 1.2 |
| Offaly | 946 | 899 | 780 | 857 | 1.2 |
| Roscommon | 880 | 627 | 695 | 621 | 1.3 |
| Sligo | 854 | 742 | 672 | 721 | 1.3 |
| Tipperary | 947 | 853 | 740 | 819 | 1.3 |
| Waterford | 928 | 787 | 740 | 814 | 1.3 |
| Westmeath | 1,046 | 819 | 835 | 793 | 1.3 |
| Wexford | 967 | 841 | 763 | 819 | 1.3 |
| Wicklow | 1,015 | 959 | 809 | 957 | 1.3 |
| Not Coded | 1,046 | 670 | 720 | 597 | 1.5 |
| State | 943 | 818 | 752 | 794 | 1.3 |
| Table 5E Residential Median Metered Electricity Consumption by Dublin Postal Districts and Quarter for 2020 (kWh) | |||||
| Median kilowatt hours | |||||
| Dublin Postal District | Jan-Mar | Apr-Jun | Jul-Sep | Oct-Dec | Ratio Q1/Q3 |
| Dublin 01 | 1,362 | 609 | 884 | 536 | 1.5 |
| Dublin 02 | 750 | 756 | 472 | 734 | 1.6 |
| Dublin 03 | 1,213 | 555 | 946 | 555 | 1.3 |
| Dublin 04 | 708 | 1,073 | 492 | 993 | 1.4 |
| Dublin 05 | 899 | 794 | 712 | 798 | 1.3 |
| Dublin 06 | 668 | 1,114 | 474 | 980 | 1.4 |
| Dublin 06W | 712 | 1,178 | 542 | 1,188 | 1.3 |
| Dublin 07 | 1,151 | 534 | 849 | 513 | 1.4 |
| Dublin 08 | 878 | 723 | 581 | 655 | 1.5 |
| Dublin 09 | 942 | 661 | 776 | 665 | 1.2 |
| Dublin 10 | 887 | 727 | 705 | 715 | 1.3 |
| Dublin 11 | 818 | 780 | 712 | 782 | 1.1 |
| Dublin 12 | 611 | 1,039 | 486 | 992 | 1.3 |
| Dublin 13 | 1,134 | 628 | 1,004 | 670 | 1.1 |
| Dublin 14 | 731 | 1,144 | 578 | 1,131 | 1.3 |
| Dublin 15 | 995 | 860 | 887 | 825 | 1.1 |
| Dublin 16 | 752 | 1,227 | 629 | 1,167 | 1.2 |
| Dublin 17 | 701 | 1,255 | 575 | 1,228 | 1.2 |
| Dublin 18 | 1,271 | 606 | 1,101 | 613 | 1.2 |
| Dublin 20 | 785 | 990 | 659 | 993 | 1.2 |
| Dublin 22 | 1,126 | 747 | 964 | 759 | 1.2 |
| Dublin 24 | 1,050 | 901 | 897 | 884 | 1.2 |
| Dublin Postal Districts | 903 | 826 | 717 | 797 | 1.3 |
| Table 6A Number of Non-Residential Electricity Meters by County for 2015-2020 | ||||||
| Number of Meters | ||||||
| County | 2015 | 2016 | 2017 | 2018 | 2019 | 2020 |
| Carlow | 3,509 | 3,554 | 3,588 | 3,625 | 3,670 | 3,668 |
| Cavan | 4,478 | 4,517 | 4,571 | 4,600 | 4,628 | 4,669 |
| Clare | 7,258 | 7,316 | 7,407 | 7,431 | 7,510 | 7,553 |
| Cork | 32,760 | 32,936 | 33,159 | 33,414 | 33,766 | 34,055 |
| Donegal | 9,595 | 9,666 | 9,684 | 9,780 | 9,846 | 9,968 |
| Dublin County | 22,130 | 22,374 | 22,636 | 22,886 | 23,172 | 23,345 |
| Dublin Postal Districts | 53,448 | 53,863 | 54,325 | 54,812 | 55,391 | 55,715 |
| Galway | 15,223 | 15,311 | 15,402 | 15,481 | 15,552 | 15,660 |
| Kerry | 9,814 | 9,875 | 9,958 | 10,025 | 10,054 | 10,087 |
| Kildare | 10,316 | 10,454 | 10,530 | 10,659 | 10,925 | 11,103 |
| Kilkenny | 4,933 | 5,026 | 5,075 | 5,108 | 5,151 | 5,193 |
| Laois | 4,524 | 4,580 | 4,604 | 4,651 | 4,727 | 4,785 |
| Leitrim | 2,444 | 2,491 | 2,589 | 2,619 | 2,643 | 2,667 |
| Limerick | 11,836 | 11,975 | 12,078 | 12,186 | 12,343 | 12,396 |
| Longford | 2,665 | 2,708 | 2,726 | 2,737 | 2,772 | 2,806 |
| Louth | 6,981 | 7,025 | 7,099 | 7,168 | 7,233 | 7,295 |
| Mayo | 8,657 | 8,787 | 9,064 | 9,113 | 9,182 | 9,219 |
| Meath | 8,645 | 8,794 | 8,890 | 9,062 | 9,267 | 9,398 |
| Monaghan | 3,837 | 3,963 | 4,177 | 4,228 | 4,267 | 4,292 |
| Offaly | 4,092 | 4,121 | 4,139 | 4,180 | 4,235 | 4,291 |
| Roscommon | 3,866 | 3,897 | 4,016 | 4,059 | 4,097 | 4,122 |
| Sligo | 4,079 | 4,117 | 4,255 | 4,283 | 4,300 | 4,346 |
| Tipperary | 10,320 | 10,370 | 10,409 | 10,515 | 10,588 | 10,619 |
| Waterford | 7,147 | 7,208 | 7,246 | 7,283 | 7,317 | 7,371 |
| Westmeath | 5,550 | 5,650 | 5,683 | 5,725 | 5,801 | 5,828 |
| Wexford | 8,133 | 8,293 | 8,376 | 8,440 | 8,562 | 8,637 |
| Wicklow | 7,666 | 7,762 | 7,812 | 7,904 | 8,059 | 8,136 |
| Not Coded | 188 | 178 | 161 | 153 | 143 | 196 |
| State | 274,094 | 276,811 | 279,659 | 282,127 | 285,201 | 287,420 |
| Table 6B Number of Residential Electricity Meters by County for 2015-2020 | ||||||
| Number of Meters | ||||||
| County | 2015 | 2016 | 2017 | 2018 | 2019 | 2020 |
| Carlow | 25,845 | 26,011 | 26,131 | 26,342 | 26,574 | 26,835 |
| Cavan | 34,128 | 34,218 | 34,421 | 34,636 | 34,803 | 35,070 |
| Clare | 54,069 | 54,186 | 54,543 | 54,819 | 55,181 | 55,611 |
| Cork | 235,022 | 236,089 | 237,603 | 239,468 | 241,617 | 244,287 |
| Donegal | 84,428 | 84,451 | 84,733 | 85,169 | 85,591 | 86,139 |
| Dublin County | 131,882 | 133,025 | 134,967 | 137,585 | 140,192 | 141,931 |
| Dublin Postal Districts | 400,411 | 402,358 | 405,258 | 409,121 | 413,253 | 417,216 |
| Galway | 114,980 | 115,277 | 115,942 | 116,662 | 117,661 | 118,866 |
| Kerry | 76,334 | 76,325 | 76,573 | 77,033 | 77,432 | 78,098 |
| Kildare | 81,022 | 81,598 | 82,577 | 83,829 | 85,730 | 87,501 |
| Kilkenny | 36,091 | 36,185 | 36,446 | 36,713 | 37,049 | 37,457 |
| Laois | 30,831 | 30,907 | 31,056 | 31,340 | 31,601 | 31,976 |
| Leitrim | 19,717 | 19,681 | 19,727 | 19,847 | 19,930 | 20,004 |
| Limerick | 88,943 | 89,019 | 89,443 | 90,001 | 90,473 | 91,046 |
| Longford | 19,855 | 19,909 | 20,014 | 20,116 | 20,279 | 20,400 |
| Louth | 55,851 | 56,048 | 56,448 | 57,046 | 57,805 | 58,481 |
| Mayo | 67,475 | 67,460 | 67,585 | 67,873 | 68,286 | 68,750 |
| Meath | 68,651 | 69,207 | 70,383 | 71,912 | 73,694 | 75,307 |
| Monaghan | 26,182 | 26,202 | 26,332 | 26,503 | 26,817 | 27,040 |
| Offaly | 29,936 | 29,952 | 30,088 | 30,214 | 30,440 | 30,651 |
| Roscommon | 28,722 | 28,697 | 28,802 | 28,969 | 29,164 | 29,365 |
| Sligo | 32,269 | 32,263 | 32,387 | 32,572 | 32,746 | 32,943 |
| Tipperary | 73,559 | 73,593 | 73,819 | 74,099 | 74,577 | 74,991 |
| Waterford | 55,295 | 55,410 | 55,721 | 56,139 | 56,626 | 57,201 |
| Westmeath | 42,065 | 42,137 | 42,304 | 42,552 | 42,855 | 43,146 |
| Wexford | 69,996 | 70,306 | 70,702 | 71,233 | 71,868 | 72,562 |
| Wicklow | 56,223 | 56,536 | 56,973 | 57,509 | 58,655 | 59,706 |
| Not Coded | 87 | 84 | 82 | 80 | 79 | 107 |
| Total | 2,039,869 | 2,047,134 | 2,061,060 | 2,079,382 | 2,100,978 | 2,122,687 |
| Table 6C Number of Residential Electricity Meters by Dublin Postal District for 2015-2020 | ||||||
| Number of Meters | ||||||
| Dublin Postal District | 2015 | 2016 | 2017 | 2018 | 2019 | 2020 |
| Dublin 01 | 14,668 | 14,684 | 14,725 | 14,763 | 14,870 | 15,169 |
| Dublin 02 | 8,541 | 8,535 | 8,607 | 8,726 | 8,854 | 8,910 |
| Dublin 03 | 17,061 | 17,121 | 17,111 | 17,240 | 17,292 | 17,382 |
| Dublin 04 | 20,021 | 20,024 | 20,085 | 20,143 | 20,225 | 20,339 |
| Dublin 05 | 19,540 | 19,607 | 19,659 | 19,776 | 19,822 | 19,918 |
| Dublin 06 | 20,699 | 20,632 | 20,641 | 20,683 | 20,700 | 20,830 |
| Dublin 06W | 10,329 | 10,341 | 10,389 | 10,447 | 10,652 | 10,788 |
| Dublin 07 | 25,136 | 25,148 | 25,235 | 25,250 | 25,284 | 25,359 |
| Dublin 08 | 27,397 | 27,417 | 27,451 | 27,564 | 27,750 | 28,030 |
| Dublin 09 | 22,239 | 22,323 | 22,335 | 22,567 | 22,891 | 23,082 |
| Dublin 10 | 7,706 | 7,706 | 7,733 | 7,802 | 7,877 | 7,882 |
| Dublin 11 | 23,264 | 23,346 | 23,470 | 23,628 | 23,763 | 23,874 |
| Dublin 12 | 22,480 | 22,483 | 22,586 | 22,647 | 22,809 | 22,933 |
| Dublin 13 | 13,583 | 13,732 | 14,078 | 14,436 | 14,742 | 15,209 |
| Dublin 14 | 18,266 | 18,401 | 18,551 | 18,847 | 19,095 | 19,216 |
| Dublin 15 | 36,711 | 37,271 | 37,902 | 38,704 | 39,406 | 39,983 |
| Dublin 16 | 18,676 | 18,803 | 18,989 | 19,225 | 19,563 | 19,690 |
| Dublin 17 | 7,703 | 7,866 | 7,950 | 7,956 | 7,949 | 7,959 |
| Dublin 18 | 15,566 | 15,932 | 16,249 | 16,582 | 16,920 | 17,269 |
| Dublin 20 | 4,879 | 4,852 | 4,919 | 4,921 | 4,931 | 4,946 |
| Dublin 22 | 15,561 | 15,559 | 15,643 | 15,781 | 15,876 | 15,981 |
| Dublin 24 | 30,385 | 30,575 | 30,950 | 31,433 | 31,982 | 32,467 |
| Total | 400,411 | 402,358 | 405,258 | 409,121 | 413,253 | 417,216 |
| Table 7 Number of Residential Electricity Meters by Consumption Size Class for 2015-2020 | ||||||
| Number of Meters | ||||||
| Consumption Size Class | 2015 | 2016 | 2017 | 2018 | 2019 | 2020 |
| No consumption | 17 | 22 | 11 | 21 | 15 | 14 |
| 0<50 kWh | 54,966 | 50,332 | 48,406 | 47,247 | 47,960 | 47,742 |
| 50<100 kWh | 13,221 | 12,843 | 12,784 | 12,558 | 13,174 | 12,857 |
| 100<500 kWh | 67,371 | 65,869 | 66,168 | 65,885 | 70,028 | 69,653 |
| 500<1,000 kWh | 85,812 | 81,981 | 83,145 | 83,063 | 92,329 | 81,434 |
| 1,000<2,500 kWh | 455,294 | 445,167 | 456,047 | 453,386 | 499,994 | 427,318 |
| 2,500<5,000 kWh | 797,249 | 828,184 | 838,376 | 840,538 | 852,398 | 834,594 |
| 5,000<7,500 kWh | 363,892 | 374,193 | 369,837 | 373,080 | 345,657 | 410,098 |
| 7,500<10,000 kWh | 117,455 | 110,033 | 108,439 | 115,327 | 101,352 | 136,352 |
| 10,000 kWh or more | 84,592 | 78,510 | 77,847 | 88,277 | 78,071 | 102,625 |
| Total | 2,039,869 | 2,047,134 | 2,061,060 | 2,079,382 | 2,100,978 | 2,122,687 |
This release contains quarterly metered electricity consumption data for 2015 to 2020. The data were received from the Electricity Supply Board (ESB Networks) for all connections to the mains electricity network.
The data are expressed in kilowatt hours (kWh) or gigawatt hours (GWh). A kilowatt hour is a unit of energy equivalent to one kilowatt of power sustained over an hour. A gigawatt hour is equivalent to one million kWh. Kilowatt hours are used for presenting median figures and gigawatt hours for presenting aggregates.
The CSO extracted the county and Dublin postal district from the address details provided by ESB Networks. The CSO matched the address with other data sources such as the SEAI Building Energy Ratings and GeoDirectory to assign a county or Dublin postal district to any records that were not coded using the ESB address details. In a small number of cases it was not possible to assign a county to a meter. A small number of very large customers have not been classified by county for confidentiality reasons.
The CSO extracted the Dublin postal district from the address files. Where an Eircode was available, the postal district could be extracted directly from the routing key. In other cases, there was uncertainty between some postal districts being derived from the street name. Hence the coding at this level should be regarded as only broadly correct.
The data provided to the CSO covered all customers connected to the mains electricity network. This includes both non-residential and residential customers. Locations such as bus shelters and street lighting were included.
The meter readings data were converted to quarterly consumption estimates by ESB Networks. Meter readings can be actual or estimated. Actual readings can be from a meter reader or from the customer. The data file provided to the CSO did not provide information on whether the consumption in a period was based on an actual or estimated reading. The total electricity consumption figures are broadly consistent with the Commission for Regulation of Utilities reports and with the Sustainable Energy Authority of Ireland energy balances.
Data for all years are subject to revision. The most likely revisions will arise from an adjustment to move non-domestic customers from Distribution Use of System (DUoS) groups 1 and 2 to a non-residential DUoS group. Amendments could also arise from correcting errors in the county coding.
The CSO received the administrative microdata under Section 30 of the Statistics Act, 1993. The CSO received quarterly data for 2015-2020 for all metered electricity customers. Daily data were received for a small number of large customers.
The median can be regarded as typical usage as it is not influenced by outliers in the same way that the mean or average is. The annual median is calculated independently of the quarterly medians, e.g. in Table 5A.
This release will be published on an annual basis.
The data received by the CSO were classified by tariff category (DUoS). DG1 is urban domestic and DG2 is rural domestic. However, small commercial customers (newsagents, farms, etc.) are sometimes included in these categories. Hence the total consumption by the residential sector is an over-estimate. The Large Customers category is a combination of DUoS groups DG8, DG9, DG10 and TCON.
The DUoS is determined by factors such as the type of use, maximum import capacity (MIC), and the nature of the connecting network. A domestic customer premises is defined as any premises whose main purpose is that of a single residence and where the connection agreement is with a private individual with an MIC up to 29,000 voltamperes.
Urban domestic connections are defined as domestic connections that are fed from three-phase overhead or underground low voltage network. Rural domestic connections are defined as domestic connections that are fed from single-phase overhead network. A non-domestic customer premises is defined as any premises whose main purpose is that of carrying out a business.
Public lighting connections with loads up to 2,000 voltampere are unmetered. Connections to street kiosks, bus shelters, etc. are unmetered up to the 2kVA load.
| DUoS Group |
Description |
| DG1 | Urban Domestic |
| DG2 | Rural Domestic |
| DG3 | Public Lighting |
| DG4 | Unmetered Connections |
| DG5 | Low Voltage Business (Non MD) |
| DG5a | Low Voltage Exporting Autoproducers1 (Non MD) |
| DG5b | Low Voltage Importing Autoproducers1 (Non MD) |
| DG6 | Low Voltage Business (MD) |
| DG6a | Low Voltage Exporting Autoproducers (MD) |
| DG6b | LV Importing Autoproducers (MD) |
| DG7 | Medium Voltage (Maximum Demand) |
| DG7a | Medium Voltage Exporting Autoproducers (MD) |
| DG7b | Medium Voltage Importing Autoproducers (MD) |
| DG8 | 38,000 Volt Looped Maximum Demand |
| DG8a | 38,000 Volt Looped Exporting Autoproducers (MD) |
| DG8b | 38,000 Volt Looped Importing Autoproducers (MD) |
| DG9 | 38,000 Volt Tailed (Maximum Demand) |
| DG9a | 38,000 Volt Tailed Exporting Autoproducers (MD) |
| DG9b | 38,000 Volt Tailed Importing Autoproducers (MD) |
| DG10 | 110,000 Volt Maximum Demand |
| TCON | Connected to the Electricity Transmission System |
A similar statistical release for networked gas consumption is published by the CSO on an annual basis using a similar analysis structure. Gas consumption is more seasonal as it is used more for main space heating. Hence a comparison of consumption in January to March with July to September shows more seasonality for gas than for electricity.
 Hide Background Notes
Scan the QR code below to view this release online or go to
http://www.cso.ie/en/releasesandpublications/er/mec/meteredelectricityconsumption2020/
 Show Table 1 Total Metered Electricity Consumption by Tariff Group 2015-2020 (GWh)
 Hide Table 1 Total Metered Electricity Consumption by Tariff Group 2015-2020 (GWh)