
Statistics in this publication are based on population estimates which have not been updated following Census 2022. See LFS Background Notes.
| Indicator | Q2 12 | Q2 13 | Q2 14 | Q2 15 | Q2 16 | Q2 17 | Q2 18 | Change Q2 17 to Q2 18 |
| Proportion of persons aged 0-17 living in jobless households | 20.1% | 18.0% | 16.1% | 14.7% | 13.2% | 11.9% | 11.8% | - 0.1 percentage points |
| Proportion of persons aged 18-59 living in jobless households | 15.7% | 14.6% | 13.1% | 11.8% | 11.1% | 9.9% | 9.5% | - 0.4 percentage points |
| Proportion of all persons aged 0-59 living in jobless households | 17.0% | 15.7% | 14.0% | 12.7% | 11.7% | 10.5% | 10.2% | - 0.3 percentage points |
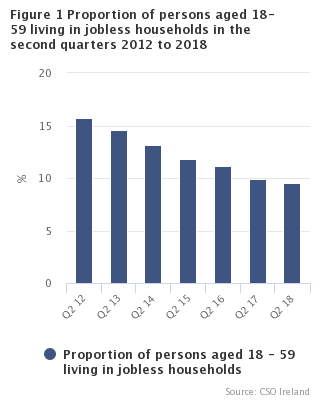
The proportion of persons aged 0-59 years of age living in jobless households in the second quarter of 2018 was 10.2%. This compares with 10.5% in the second quarter of 2017. The proportion of persons aged 18-59 living in jobless households in Q2 2018 was 9.5% compared with 9.9% in Q2 2017. The proportion of persons aged 0-17 living in jobless households in Q2 2018 was 11.8% compared with 11.9% in Q2 2017.
In Q2 2018, the Mid-East region had the lowest proportion of persons aged 0-59 living in jobless households (8.5%), while the Midland region had the highest proportion (17.2%). In Q2 2012 the Mid-East region again had the lowest proportion of persons aged 0-59 living in jobless households (15.2%), while the Midland region also had the highest proportion (22.0%). See Table 1.
Household Composition
One and two person households together accounted for more than half (55.6%) of all the households in the State in Q2 2018, while 12.2% of households contained five or more persons. See Tables 2 and 3.
The proportion of households in the State that did not contain a person aged less than 18 in Q2 2018 was 65.1%. The Mid-East region had the lowest proportion of households without a person aged less than 18 at 58.1%, while the Dublin region had the highest proportion of households without a person aged less than 18 at 67.4%. See Tables 4 and 5.
Household Composition and Family Unit Type
There were 490,200 single person households in the State in the second quarter of 2018. The number of households consisting of a couple without children was 401,500, while the number of family units consisting of a couple with children was 639,100. There were 211,900 lone parent family households in Q2 2018. See Table 6.
Family Units and ILO Status
There were 2,388,800 adult members of family units in the second quarter of 2018 of whom 1,552,600 were classified as employed, 65,400 as unemployed and 770,800 as not in the labour force. See Tables 7 and 8.
Family Units and Employment Rate
The employment rate for all persons aged 15-64 was 68.5% in Q2 2018. This compares with 67.4% in Q2 2017 and 59.8% in Q2 2012. In Q2 2018, the employment rate of lone parents (aged 15-64) was 63.0%. This compares with 75.7% for the adult members of couples without children and 78.5% for the adult members of couples with children. See Tables 9 and 10.
The employment rate of lone parents (aged 15-64) whose youngest child was aged 0 to 5 years was 55.8% in Q2 2018 compared to 67.7% where the youngest child was aged 6 to 11 and 69.1% where the youngest child was aged 12 to 17. See Tables 9 and 10.
Family Units and Unemployment Rate
The unemployment rate for all persons aged 15-74 was 6.0% in Q2 2018. The adult members (aged 15-74) of couples without children had a 3.8% unemployment rate, while the adult members of couples with children had an unemployment rate of 3.6% in Q2 2018. The unemployment rate of lone parents was 8.2% in the same period. See Tables 11 and 12.
Family Units and Participation Rate
The participation rates for all males and females aged 15 and over in Q2 2018 were 68.6% and 56.4% respectively. The participation rate of males in couples with children was 87.9% in Q2 2018, while the corresponding participation rate for females was 69.1%. The participation rate of the adult members of couples without children was 52.2% in Q2 2018, compared to a participation rate of 78.6% for the adult members of couples with children and 62.1% for lone parents. See Tables 13 and 14.
Family Units and Duration of Unemployment
65,400 adult members of all family units were unemployed in Q2 2018 compared to 186,400 in Q2 2012. Where the duration of unemployment was stated, the number of persons unemployed for less than a year was 38,100 (60.7%) in Q2 2018 compared to 67,300 (39.3%) for the same period in 2012. On the other hand, 24,700 (36.4%) of members were unemployed for a year or more in Q2 2018 compared to 117,800 (63.6%) in Q2 2012. See Table 15.
| Table 1 Proportion of persons in jobless households by NUTS2 and NUTS3 regions, age and gender | ||||||||||
| % | ||||||||||
| Region/Jobless households | Q2 12 | Q2 13 | Q2 14 | Q2 15 | Q2 16 | Q2 17 | Q2 18 | |||
| Northern and Western | ||||||||||
| Proportion of persons aged 0-17 living in jobless household | 20.2 | 18.8 | 17.1 | 14.5 | 12.4 | 13.9 | 11.9 | |||
| Proportion of male persons aged 18-59 living in jobless household | 17.9 | 14.9 | 14.2 | 10.7 | 10.9 | 10.2 | 10.2 | |||
| Proportion of female persons aged 18-59 living in jobless household | 18.3 | 15.9 | 15.0 | 12.8 | 12.1 | 12.9 | 11.2 | |||
| Proportion of persons aged 18-59 living in jobless households | 18.1 | 15.4 | 14.6 | 11.8 | 11.5 | 11.5 | 10.7 | |||
| Proportion of all persons aged 0-59 living in jobless households | 18.7 | 16.5 | 15.4 | 12.6 | 11.8 | 12.3 | 11.1 | |||
| Border | ||||||||||
| Proportion of persons aged 0-17 living in jobless household | 24.4 | 22.3 | 16.8 | 14.6 | 11.7 | 13.7 | 8.4 | |||
| Proportion of male persons aged 18-59 living in jobless household | 20.2 | 16.2 | 15.0 | 10.5 | 10.8 | 9.9 | 9.3 | |||
| Proportion of female persons aged 18-59 living in jobless household | 20.6 | 17.3 | 14.2 | 12.7 | 12.3 | 13.2 | 9.6 | |||
| Proportion of persons aged 18-59 living in jobless households | 20.4 | 16.7 | 14.6 | 11.6 | 11.6 | 11.6 | 9.5 | |||
| Proportion of all persons aged 0-59 living in jobless households | 21.7 | 18.5 | 15.3 | 12.6 | 11.6 | 12.3 | 9.1 | |||
| West | ||||||||||
| Proportion of persons aged 0-17 living in jobless household | 16.1 | 15.6 | 17.4 | 14.4 | 13.0 | 14.0 | 15.1 | |||
| Proportion of male persons aged 18-59 living in jobless household | 15.8 | 13.8 | 13.5 | 10.8 | 11.0 | 10.4 | 11.0 | |||
| Proportion of female persons aged 18-59 living in jobless household | 16.2 | 14.7 | 15.7 | 13.0 | 11.8 | 12.5 | 12.6 | |||
| Proportion of persons aged 18-59 living in jobless households | 16.0 | 14.3 | 14.6 | 11.9 | 11.4 | 11.5 | 11.8 | |||
| Proportion of all persons aged 0-59 living in jobless households | 16.0 | 14.7 | 15.5 | 12.7 | 11.9 | 12.3 | 12.8 | |||
| Southern | ||||||||||
| Proportion of persons aged 0-17 living in jobless household | 20.1 | 17.1 | 15.4 | 14.4 | 12.4 | 10.7 | 11.4 | |||
| Proportion of male persons aged 18-59 living in jobless household | 15.6 | 14.5 | 12.5 | 11.7 | 11.4 | 9.4 | 8.8 | |||
| Proportion of female persons aged 18-59 living in jobless household | 16.5 | 15.4 | 15.0 | 13.2 | 11.7 | 9.5 | 11.4 | |||
| Proportion of persons aged 18-59 living in jobless households | 16.1 | 15.0 | 13.8 | 12.5 | 11.5 | 9.5 | 10.1 | |||
| Proportion of all persons aged 0-59 living in jobless households | 17.3 | 15.6 | 14.3 | 13.0 | 11.8 | 9.9 | 10.5 | |||
| Mid-West | ||||||||||
| Proportion of persons aged 0-17 living in jobless household | 18.7 | 16.6 | 15.8 | 12.6 | 11.7 | 13.1 | 11.5 | |||
| Proportion of male persons aged 18-59 living in jobless household | 16.9 | 14.6 | 12.3 | 12.0 | 12.1 | 9.7 | 8.2 | |||
| Proportion of female persons aged 18-59 living in jobless household | 16.8 | 14.9 | 13.8 | 13.1 | 11.4 | 11.6 | 11.8 | |||
| Proportion of persons aged 18-59 living in jobless households | 16.9 | 14.7 | 13.1 | 12.6 | 11.8 | 10.7 | 10.0 | |||
| Proportion of all persons aged 0-59 living in jobless households | 17.4 | 15.3 | 13.9 | 12.6 | 11.7 | 11.4 | 10.5 | |||
| South-East | ||||||||||
| Proportion of persons aged 0-17 living in jobless household | 23.9 | 21.1 | 15.7 | 14.7 | 11.0 | 11.0 | 11.5 | |||
| Proportion of male persons aged 18-59 living in jobless household | 16.8 | 19.1 | 13.6 | 11.9 | 12.2 | 12.2 | 10.8 | |||
| Proportion of female persons aged 18-59 living in jobless household | 20.0 | 19.2 | 16.9 | 15.3 | 11.6 | 10.8 | 14.6 | |||
| Proportion of persons aged 18-59 living in jobless households | 18.4 | 19.2 | 15.3 | 13.6 | 11.9 | 11.5 | 12.7 | |||
| Proportion of all persons aged 0-59 living in jobless households | 20.2 | 19.8 | 15.4 | 14.0 | 11.6 | 11.3 | 12.3 | |||
| South-West | ||||||||||
| Proportion of persons aged 0-17 living in jobless household | 18.6 | 14.9 | 14.8 | 15.3 | 13.8 | 8.9 | 11.2 | |||
| Proportion of male persons aged 18-59 living in jobless household | 14.0 | 11.6 | 12.0 | 11.5 | 10.4 | 7.5 | 8.0 | |||
| Proportion of female persons aged 18-59 living in jobless household | 14.1 | 13.6 | 14.7 | 11.9 | 11.9 | 7.4 | 9.3 | |||
| Proportion of persons aged 18-59 living in jobless households | 14.0 | 12.6 | 13.3 | 11.7 | 11.2 | 7.5 | 8.7 | |||
| Proportion of all persons aged 0-59 living in jobless households | 15.4 | 13.3 | 13.8 | 12.8 | 12.0 | 7.9 | 9.5 | |||
| Eastern and Midland | ||||||||||
| Proportion of persons aged 0-17 living in jobless household | 20.2 | 18.2 | 16.1 | 15.1 | 14.0 | 11.9 | 12.0 | |||
| Proportion of male persons aged 18-59 living in jobless household | 13.8 | 13.7 | 11.0 | 10.8 | 10.1 | 9.0 | 8.2 | |||
| Proportion of female persons aged 18-59 living in jobless household | 15.3 | 14.6 | 13.2 | 11.8 | 11.3 | 10.1 | 9.3 | |||
| Proportion of persons aged 18-59 living in jobless households | 14.6 | 14.2 | 12.1 | 11.3 | 10.7 | 9.6 | 8.8 | |||
| Proportion of all persons aged 0-59 living in jobless households | 16.2 | 15.4 | 13.3 | 12.4 | 11.7 | 10.3 | 9.7 | |||
| Dublin | ||||||||||
| Proportion of persons aged 0-17 living in jobless household | 20.3 | 17.9 | 16.3 | 16.1 | 15.2 | 12.7 | 11.5 | |||
| Proportion of male persons aged 18-59 living in jobless household | 12.8 | 12.7 | 9.6 | 9.8 | 9.3 | 8.5 | 7.3 | |||
| Proportion of female persons aged 18-59 living in jobless household | 14.5 | 13.8 | 11.7 | 11.0 | 11.1 | 9.6 | 8.0 | |||
| Proportion of persons aged 18-59 living in jobless households | 13.6 | 13.3 | 10.6 | 10.4 | 10.2 | 9.1 | 7.7 | |||
| Proportion of all persons aged 0-59 living in jobless households | 15.4 | 14.5 | 12.2 | 12.0 | 11.6 | 10.1 | 8.7 | |||
| Mid-East | ||||||||||
| Proportion of persons aged 0-17 living in jobless household | 19.3 | 18.6 | 15.5 | 13.5 | 12.5 | 9.7 | 9.5 | |||
| Proportion of male persons aged 18-59 living in jobless household | 12.5 | 12.9 | 11.3 | 10.4 | 9.5 | 7.5 | 7.5 | |||
| Proportion of female persons aged 18-59 living in jobless household | 14.1 | 15.0 | 13.8 | 11.6 | 10.2 | 8.9 | 8.5 | |||
| Proportion of persons aged 18-59 living in jobless households | 13.3 | 14.0 | 12.6 | 11.0 | 9.8 | 8.2 | 8.0 | |||
| Proportion of all persons aged 0-59 living in jobless households | 15.2 | 15.5 | 13.5 | 11.8 | 10.7 | 8.7 | 8.5 | |||
| Midland | ||||||||||
| Proportion of persons aged 0-17 living in jobless household | 21.8 | 18.5 | 17.2 | 15.1 | 13.3 | 14.3 | 20.0 | |||
| Proportion of male persons aged 18-59 living in jobless household | 21.7 | 19.9 | 17.2 | 16.7 | 15.2 | 14.5 | 14.0 | |||
| Proportion of female persons aged 18-59 living in jobless household | 22.6 | 17.7 | 19.1 | 16.7 | 15.4 | 15.8 | 17.8 | |||
| Proportion of persons aged 18-59 living in jobless households | 22.2 | 18.8 | 18.1 | 16.7 | 15.3 | 15.1 | 15.9 | |||
| Proportion of all persons aged 0-59 living in jobless households | 22.0 | 18.7 | 17.8 | 16.1 | 14.6 | 14.9 | 17.2 | |||
| State | ||||||||||
| Proportion of persons aged 0-17 living in jobless household | 20.1 | 18.0 | 16.1 | 14.7 | 13.2 | 11.9 | 11.8 | |||
| Proportion of male persons aged 18-59 living in jobless household | 15.1 | 14.2 | 12.1 | 11.1 | 10.7 | 9.3 | 8.7 | |||
| Proportion of female persons aged 18-59 living in jobless household | 16.2 | 15.1 | 14.1 | 12.4 | 11.6 | 10.4 | 10.3 | |||
| Proportion of persons aged 18-59 living in jobless households | 15.7 | 14.6 | 13.1 | 11.8 | 11.1 | 9.9 | 9.5 | |||
| Proportion of all persons aged 0-59 living in jobless households | 17.0 | 15.7 | 14.0 | 12.7 | 11.7 | 10.5 | 10.2 | |||
| Note: Households consisting entirely of persons aged 18-24, all of whom have indicated that their Principal Economic Status is Student, are excluded from the above calculations | ||||||||||
| Note: A new Labour Force Survey (LFS) replaced the Quarterly National Household Survey (QNHS) in Q3 2017 and, as a result, care should be taken when comparing data from before and after this period. Please see background notes of the LFS release for additional information. | ||||||||||
| Note: The composition of the NUTS regions changed in 2016 and took effect in the LFS from Q1 2018. Data from Q1 2012 to Q4 2017 has also been revised to reflect these changes. Please see background notes of the Q1 2018 LFS release for additional information. | ||||||||||
| Table 2 Number of households classified by NUTS2 and NUTS3 regions and Size of Household | |||||||||
| '000 | |||||||||
| Region/Household size | Q2 12 | Q2 13 | Q2 14 | Q2 15 | Q2 16 | Q2 17 | Q2 18 | ||
| Northern and Western | |||||||||
| 1 person | 81.7 | 81.7 | 77.8 | 72.5 | 78.1 | 80.1 | 94.7 | ||
| 2 persons | 96.8 | 95.3 | 92.6 | 89.7 | 100.4 | 102.5 | 95.8 | ||
| 3 persons | 50.1 | 53.5 | 50.2 | 51.3 | 52.4 | 51.4 | 52.7 | ||
| 4 persons | 44.3 | 44.3 | 49.4 | 49.1 | 45.9 | 45.5 | 46.6 | ||
| 5 persons | 27.0 | 26.6 | 26.0 | 29.0 | 27.7 | 28.9 | 28.9 | ||
| 6 or more persons | 14.6 | 14.0 | 14.0 | 13.5 | 12.9 | 13.1 | 13.3 | ||
| Total households | 314.4 | 315.5 | 310.0 | 305.2 | 317.4 | 321.7 | 331.9 | ||
| Border | |||||||||
| 1 person | 42.0 | 41.8 | 35.9 | 33.9 | 35.9 | 42.1 | 45.6 | ||
| 2 persons | 44.6 | 43.2 | 43.6 | 41.8 | 48.3 | 46.2 | 43.4 | ||
| 3 persons | 21.2 | 23.7 | 24.2 | 23.6 | 23.7 | 25.4 | 25.2 | ||
| 4 persons | 18.7 | 19.8 | 21.9 | 22.9 | 19.7 | 20.9 | 20.6 | ||
| 5 persons | 13.4 | 13.9 | 13.2 | 14.1 | 13.4 | 12.3 | 14.7 | ||
| 6 or more persons | 8.5 | 6.9 | 6.5 | 6.4 | 6.9 | 6.7 | [6.1] | ||
| Total households | 148.4 | 149.2 | 145.3 | 142.8 | 147.9 | 153.6 | 155.5 | ||
| West | |||||||||
| 1 person | 39.7 | 39.9 | 41.9 | 38.6 | 42.2 | 38.0 | 49.2 | ||
| 2 persons | 52.2 | 52.1 | 49.1 | 47.9 | 52.1 | 56.4 | 52.4 | ||
| 3 persons | 28.9 | 29.8 | 26.0 | 27.7 | 28.7 | 26.0 | 27.5 | ||
| 4 persons | 25.5 | 24.5 | 27.5 | 26.2 | 26.2 | 24.6 | 25.9 | ||
| 5 persons | 13.6 | 12.8 | 12.8 | 14.9 | 14.3 | 16.6 | 14.3 | ||
| 6 or more persons | 6.0 | 7.1 | 7.5 | 7.1 | 6.1 | 6.5 | 7.1 | ||
| Total households | 166.0 | 166.2 | 164.7 | 162.4 | 169.5 | 168.1 | 176.4 | ||
| Southern | |||||||||
| 1 person | 129.7 | 135.9 | 130.0 | 140.1 | 144.9 | 141.3 | 166.5 | ||
| 2 persons | 173.7 | 179.2 | 178.6 | 174.0 | 166.1 | 178.1 | 178.9 | ||
| 3 persons | 103.7 | 102.7 | 101.9 | 100.7 | 105.7 | 96.7 | 95.6 | ||
| 4 persons | 94.9 | 100.0 | 94.9 | 96.0 | 93.9 | 102.5 | 95.0 | ||
| 5 persons | 49.7 | 46.1 | 51.6 | 49.2 | 50.3 | 48.9 | 54.1 | ||
| 6 or more persons | 20.9 | 19.7 | 20.8 | 22.8 | 24.5 | 24.0 | 23.4 | ||
| Total households | 572.6 | 583.5 | 577.7 | 582.9 | 585.6 | 591.5 | 613.5 | ||
| Mid-West | |||||||||
| 1 person | 40.8 | 39.4 | 40.4 | 40.8 | 41.1 | 48.6 | 50.3 | ||
| 2 persons | 54.7 | 53.1 | 53.5 | 51.3 | 49.5 | 53.6 | 52.8 | ||
| 3 persons | 31.1 | 30.6 | 31.0 | 29.9 | 33.8 | 28.5 | 26.7 | ||
| 4 persons | 28.1 | 30.2 | 28.2 | 29.6 | 29.0 | 31.0 | 27.7 | ||
| 5 persons | 15.3 | 14.9 | 15.1 | 15.6 | 13.8 | 13.9 | 18.2 | ||
| 6 or more persons | 6.0 | 6.0 | 6.5 | 6.8 | 7.0 | 6.5 | 7.0 | ||
| Total households | 176.0 | 174.1 | 174.7 | 174.0 | 174.2 | 182.2 | 182.7 | ||
| South-East | |||||||||
| 1 person | 31.1 | 37.0 | 32.2 | 38.4 | 40.2 | 36.6 | 41.2 | ||
| 2 persons | 45.5 | 49.6 | 49.0 | 48.7 | 46.3 | 50.2 | 50.1 | ||
| 3 persons | 27.2 | 26.7 | 26.9 | 27.8 | 28.5 | 24.8 | 25.9 | ||
| 4 persons | 26.3 | 26.8 | 24.2 | 24.0 | 23.2 | 26.7 | 25.0 | ||
| 5 persons | 13.3 | 12.5 | 13.9 | 12.4 | 14.2 | 14.4 | 12.2 | ||
| 6 or more persons | 5.8 | 4.3 | 5.7 | 5.9 | 6.2 | 5.6 | 7.9 | ||
| Total households | 149.2 | 157.0 | 151.8 | 157.3 | 158.6 | 158.3 | 162.3 | ||
| South-West | |||||||||
| 1 person | 57.8 | 59.5 | 57.4 | 60.9 | 63.7 | 56.2 | 74.9 | ||
| 2 persons | 73.4 | 76.5 | 76.1 | 74.0 | 70.4 | 74.2 | 76.0 | ||
| 3 persons | 45.4 | 45.4 | 44.0 | 43.0 | 43.5 | 43.4 | 43.0 | ||
| 4 persons | 40.5 | 42.9 | 42.4 | 42.4 | 41.7 | 44.8 | 42.3 | ||
| 5 persons | 21.2 | 18.7 | 22.6 | 21.2 | 22.3 | 20.5 | 23.8 | ||
| 6 or more persons | 9.0 | 9.4 | 8.6 | 10.2 | 11.3 | 11.9 | 8.5 | ||
| Total households | 247.4 | 252.4 | 251.1 | 251.7 | 252.9 | 251.0 | 268.4 | ||
| Eastern and Midland | |||||||||
| 1 person | 158.5 | 167.7 | 172.4 | 177.4 | 196.6 | 191.8 | 229.1 | ||
| 2 persons | 236.6 | 241.7 | 249.4 | 241.2 | 239.7 | 243.9 | 260.0 | ||
| 3 persons | 141.0 | 148.9 | 147.9 | 155.8 | 157.5 | 150.4 | 156.2 | ||
| 4 persons | 145.8 | 141.4 | 142.0 | 143.3 | 152.1 | 156.0 | 150.2 | ||
| 5 persons | 74.7 | 69.9 | 71.6 | 70.8 | 76.4 | 76.3 | 73.1 | ||
| 6 or more persons | 31.3 | 32.8 | 32.4 | 36.0 | 28.4 | 33.1 | 32.2 | ||
| Total households | 787.8 | 802.3 | 815.7 | 824.4 | 850.7 | 851.4 | 900.7 | ||
| Dublin | |||||||||
| 1 person | 92.4 | 99.5 | 106.4 | 110.6 | 119.1 | 118.7 | 152.0 | ||
| 2 persons | 137.7 | 147.9 | 149.2 | 146.2 | 147.9 | 147.7 | 154.7 | ||
| 3 persons | 83.0 | 86.4 | 86.8 | 89.4 | 92.9 | 88.2 | 93.1 | ||
| 4 persons | 83.2 | 79.2 | 78.1 | 81.0 | 85.4 | 86.9 | 81.8 | ||
| 5 persons | 39.9 | 36.9 | 39.3 | 38.5 | 41.2 | 40.5 | 41.5 | ||
| 6 or more persons | 17.1 | 17.5 | 17.6 | 19.7 | 14.8 | 18.8 | 15.4 | ||
| Total households | 453.3 | 467.3 | 477.4 | 485.4 | 501.2 | 500.9 | 538.5 | ||
| Mid-East | |||||||||
| 1 person | 44.0 | 43.9 | 44.0 | 42.5 | 47.9 | 45.4 | 48.5 | ||
| 2 persons | 67.8 | 63.4 | 68.9 | 63.3 | 61.8 | 66.5 | 70.6 | ||
| 3 persons | 38.4 | 42.8 | 40.6 | 45.7 | 46.0 | 42.4 | 43.8 | ||
| 4 persons | 44.9 | 44.6 | 46.7 | 46.2 | 48.0 | 50.0 | 49.2 | ||
| 5 persons | 24.9 | 23.3 | 22.9 | 23.4 | 26.3 | 26.6 | 23.8 | ||
| 6 or more persons | 10.4 | 11.2 | 10.5 | 11.2 | 9.1 | 9.7 | 12.2 | ||
| Total households | 230.4 | 229.1 | 233.6 | 232.3 | 239.1 | 240.6 | 248.0 | ||
| Midland | |||||||||
| 1 person | 22.1 | 24.2 | 21.9 | 24.3 | 29.5 | 27.7 | 28.6 | ||
| 2 persons | 31.2 | 30.4 | 31.3 | 31.6 | 30.0 | 29.7 | 34.7 | ||
| 3 persons | 19.6 | 19.7 | 20.5 | 20.7 | 18.7 | 19.8 | 19.3 | ||
| 4 persons | 17.6 | 17.6 | 17.2 | 16.1 | 18.7 | 19.0 | 19.2 | ||
| 5 persons | 9.8 | 9.7 | 9.5 | 8.8 | 8.9 | 9.2 | 7.7 | ||
| 6 or more persons | 3.8 | 4.1 | 4.3 | 5.1 | [4.4] | [4.6] | [4.7] | ||
| Total households | 104.1 | 105.8 | 104.7 | 106.7 | 110.3 | 109.9 | 114.2 | ||
| State | |||||||||
| 1 person | 369.9 | 385.3 | 380.2 | 390.0 | 419.6 | 413.2 | 490.2 | ||
| 2 persons | 507.1 | 516.2 | 520.6 | 504.9 | 506.3 | 524.5 | 534.7 | ||
| 3 persons | 294.8 | 305.0 | 300.0 | 307.8 | 315.7 | 298.5 | 304.4 | ||
| 4 persons | 285.0 | 285.7 | 286.3 | 288.4 | 291.9 | 304.0 | 291.7 | ||
| 5 persons | 151.4 | 142.7 | 149.2 | 149.0 | 154.4 | 154.0 | 156.1 | ||
| 6 or more persons | 66.7 | 66.5 | 67.2 | 72.3 | 65.9 | 70.3 | 68.9 | ||
| Total households | 1,674.9 | 1,701.3 | 1,703.4 | 1,712.5 | 1,753.6 | 1,764.5 | 1,846.1 | ||
| Note: The average grossing factor of all members of a household is used to calculate the number of households. The number of households should be treated as indicative only. | |||||||||
| Note: A new Labour Force Survey (LFS) replaced the Quarterly National Household Survey (QNHS) in Q3 2017 and, as a result, care should be taken when comparing data from before and after this period. Please see background notes of the LFS release for additional information. | |||||||||
| Note: The composition of the NUTS regions changed in 2016 and took effect in the LFS from Q1 2018. Data from Q1 2012 to Q4 2017 has also been revised to reflect these changes. Please see background notes of the Q1 2018 LFS release for additional information. | |||||||||
| Table 3 Share of households classified by NUTS2 and NUTS3 regions and Size of Household | |||||||||
| % | |||||||||
| Region/Household size | Q2 12 | Q2 13 | Q2 14 | Q2 15 | Q2 16 | Q2 17 | Q2 18 | ||
| Northern and Western | |||||||||
| 1 person | 26.0 | 25.9 | 25.1 | 23.8 | 24.6 | 24.9 | 28.5 | ||
| 2 persons | 30.8 | 30.2 | 29.9 | 29.4 | 31.6 | 31.9 | 28.9 | ||
| 3 persons | 15.9 | 17.0 | 16.2 | 16.8 | 16.5 | 16.0 | 15.9 | ||
| 4 persons | 14.1 | 14.0 | 15.9 | 16.1 | 14.5 | 14.1 | 14.0 | ||
| 5 persons | 8.6 | 8.4 | 8.4 | 9.5 | 8.7 | 9.0 | 8.7 | ||
| 6 or more persons | 4.6 | 4.5 | 4.5 | 4.4 | 4.1 | 4.1 | 4.0 | ||
| Total households | 100.0 | 100.0 | 100.0 | 100.0 | 100.0 | 100.0 | 100.0 | ||
| Border | |||||||||
| 1 person | 28.3 | 28.0 | 24.7 | 23.7 | 24.3 | 27.4 | 29.3 | ||
| 2 persons | 30.0 | 28.9 | 30.0 | 29.3 | 32.7 | 30.0 | 27.9 | ||
| 3 persons | 14.3 | 15.9 | 16.7 | 16.5 | 16.0 | 16.6 | 16.2 | ||
| 4 persons | 12.6 | 13.2 | 15.1 | 16.0 | 13.3 | 13.6 | 13.3 | ||
| 5 persons | 9.1 | 9.3 | 9.1 | 9.9 | 9.0 | 8.0 | 9.4 | ||
| 6 or more persons | 5.7 | 4.6 | 4.5 | 4.5 | 4.6 | 4.3 | 4.0 | ||
| Total households | 100.0 | 100.0 | 100.0 | 100.0 | 100.0 | 100.0 | 100.0 | ||
| West | |||||||||
| 1 person | 23.9 | 24.0 | 25.4 | 23.8 | 24.9 | 22.6 | 27.9 | ||
| 2 persons | 31.5 | 31.3 | 29.8 | 29.5 | 30.7 | 33.5 | 29.7 | ||
| 3 persons | 17.4 | 17.9 | 15.8 | 17.0 | 16.9 | 15.5 | 15.6 | ||
| 4 persons | 15.4 | 14.8 | 16.7 | 16.2 | 15.5 | 14.6 | 14.7 | ||
| 5 persons | 8.2 | 7.7 | 7.8 | 9.2 | 8.4 | 9.9 | 8.1 | ||
| 6 or more persons | 3.6 | 4.3 | 4.5 | 4.4 | 3.6 | 3.9 | 4.0 | ||
| Total households | 100.0 | 100.0 | 100.0 | 100.0 | 100.0 | 100.0 | 100.0 | ||
| Southern | |||||||||
| 1 person | 22.7 | 23.3 | 22.5 | 24.0 | 24.7 | 23.9 | 27.1 | ||
| 2 persons | 30.3 | 30.7 | 30.9 | 29.9 | 28.4 | 30.1 | 29.2 | ||
| 3 persons | 18.1 | 17.6 | 17.6 | 17.3 | 18.1 | 16.4 | 15.6 | ||
| 4 persons | 16.6 | 17.1 | 16.4 | 16.5 | 16.0 | 17.3 | 15.5 | ||
| 5 persons | 8.7 | 7.9 | 8.9 | 8.4 | 8.6 | 8.3 | 8.8 | ||
| 6 or more persons | 3.6 | 3.4 | 3.6 | 3.9 | 4.2 | 4.1 | 3.8 | ||
| Total households | 100.0 | 100.0 | 100.0 | 100.0 | 100.0 | 100.0 | 100.0 | ||
| Mid-West | |||||||||
| 1 person | 23.2 | 22.6 | 23.1 | 23.5 | 23.6 | 26.7 | 27.6 | ||
| 2 persons | 31.1 | 30.5 | 30.6 | 29.5 | 28.4 | 29.4 | 28.9 | ||
| 3 persons | 17.7 | 17.6 | 17.7 | 17.2 | 19.4 | 15.7 | 14.6 | ||
| 4 persons | 16.0 | 17.3 | 16.1 | 17.0 | 16.6 | 17.0 | 15.2 | ||
| 5 persons | 8.7 | 8.5 | 8.6 | 9.0 | 7.9 | 7.6 | 10.0 | ||
| 6 or more persons | 3.4 | 3.4 | 3.7 | 3.9 | 4.0 | 3.6 | 3.9 | ||
| Total households | 100.0 | 100.0 | 100.0 | 100.0 | 100.0 | 100.0 | 100.0 | ||
| South-East | |||||||||
| 1 person | 20.9 | 23.6 | 21.2 | 24.4 | 25.3 | 23.1 | 25.4 | ||
| 2 persons | 30.5 | 31.6 | 32.2 | 31.0 | 29.2 | 31.7 | 30.9 | ||
| 3 persons | 18.2 | 17.0 | 17.7 | 17.7 | 18.0 | 15.7 | 16.0 | ||
| 4 persons | 17.6 | 17.1 | 15.9 | 15.3 | 14.7 | 16.9 | 15.4 | ||
| 5 persons | 8.9 | 8.0 | 9.1 | 7.9 | 9.0 | 9.1 | 7.5 | ||
| 6 or more persons | 3.9 | 2.7 | 3.7 | 3.7 | 3.9 | 3.5 | 4.9 | ||
| Total households | 100.0 | 100.0 | 100.0 | 100.0 | 100.0 | 100.0 | 100.0 | ||
| South-West | |||||||||
| 1 person | 23.4 | 23.6 | 22.9 | 24.2 | 25.2 | 22.4 | 27.9 | ||
| 2 persons | 29.7 | 30.3 | 30.3 | 29.4 | 27.8 | 29.6 | 28.3 | ||
| 3 persons | 18.4 | 18.0 | 17.5 | 17.1 | 17.2 | 17.3 | 16.0 | ||
| 4 persons | 16.4 | 17.0 | 16.9 | 16.8 | 16.5 | 17.9 | 15.8 | ||
| 5 persons | 8.6 | 7.4 | 9.0 | 8.4 | 8.8 | 8.2 | 8.9 | ||
| 6 or more persons | 3.6 | 3.7 | 3.4 | 4.0 | 4.5 | 4.7 | 3.2 | ||
| Total households | 100.0 | 100.0 | 100.0 | 100.0 | 100.0 | 100.0 | 100.0 | ||
| Eastern and Midland | |||||||||
| 1 person | 20.1 | 20.9 | 21.1 | 21.5 | 23.1 | 22.5 | 25.4 | ||
| 2 persons | 30.0 | 30.1 | 30.6 | 29.3 | 28.2 | 28.6 | 28.9 | ||
| 3 persons | 17.9 | 18.6 | 18.1 | 18.9 | 18.5 | 17.7 | 17.3 | ||
| 4 persons | 18.5 | 17.6 | 17.4 | 17.4 | 17.9 | 18.3 | 16.7 | ||
| 5 persons | 9.5 | 8.7 | 8.8 | 8.6 | 9.0 | 9.0 | 8.1 | ||
| 6 or more persons | 4.0 | 4.1 | 4.0 | 4.4 | 3.3 | 3.9 | 3.6 | ||
| Total households | 100.0 | 100.0 | 100.0 | 100.0 | 100.0 | 100.0 | 100.0 | ||
| Dublin | |||||||||
| 1 person | 20.4 | 21.3 | 22.3 | 22.8 | 23.8 | 23.7 | 28.2 | ||
| 2 persons | 30.4 | 31.6 | 31.3 | 30.1 | 29.5 | 29.5 | 28.7 | ||
| 3 persons | 18.3 | 18.5 | 18.2 | 18.4 | 18.5 | 17.6 | 17.3 | ||
| 4 persons | 18.4 | 16.9 | 16.4 | 16.7 | 17.0 | 17.3 | 15.2 | ||
| 5 persons | 8.8 | 7.9 | 8.2 | 7.9 | 8.2 | 8.1 | 7.7 | ||
| 6 or more persons | 3.8 | 3.7 | 3.7 | 4.1 | 3.0 | 3.8 | 2.9 | ||
| Total households | 100.0 | 100.0 | 100.0 | 100.0 | 100.0 | 100.0 | 100.0 | ||
| Mid-East | |||||||||
| 1 person | 19.1 | 19.2 | 18.8 | 18.3 | 20.0 | 18.9 | 19.5 | ||
| 2 persons | 29.4 | 27.7 | 29.5 | 27.3 | 25.9 | 27.6 | 28.5 | ||
| 3 persons | 16.7 | 18.7 | 17.4 | 19.7 | 19.2 | 17.6 | 17.7 | ||
| 4 persons | 19.5 | 19.5 | 20.0 | 19.9 | 20.1 | 20.8 | 19.8 | ||
| 5 persons | 10.8 | 10.2 | 9.8 | 10.1 | 11.0 | 11.0 | 9.6 | ||
| 6 or more persons | 4.5 | 4.9 | 4.5 | 4.8 | 3.8 | 4.0 | 4.9 | ||
| Total households | 100.0 | 100.0 | 100.0 | 100.0 | 100.0 | 100.0 | 100.0 | ||
| Midland | |||||||||
| 1 person | 21.3 | 22.9 | 20.9 | 22.8 | 26.8 | 25.2 | 25.0 | ||
| 2 persons | 29.9 | 28.7 | 29.9 | 29.6 | 27.2 | 27.0 | 30.3 | ||
| 3 persons | 18.8 | 18.6 | 19.6 | 19.4 | 16.9 | 18.0 | 16.9 | ||
| 4 persons | 16.9 | 16.6 | 16.5 | 15.1 | 17.0 | 17.3 | 16.8 | ||
| 5 persons | 9.4 | 9.2 | 9.1 | 8.3 | 8.1 | 8.3 | 6.8 | ||
| 6 or more persons | 3.6 | 3.9 | 4.1 | 4.8 | 4.0 | 4.2 | 4.1 | ||
| Total households | 100.0 | 100.0 | 100.0 | 100.0 | 100.0 | 100.0 | 100.0 | ||
| State | |||||||||
| 1 person | 22.1 | 22.6 | 22.3 | 22.8 | 23.9 | 23.4 | 26.6 | ||
| 2 persons | 30.3 | 30.3 | 30.6 | 29.5 | 28.9 | 29.7 | 29.0 | ||
| 3 persons | 17.6 | 17.9 | 17.6 | 18.0 | 18.0 | 16.9 | 16.5 | ||
| 4 persons | 17.0 | 16.8 | 16.8 | 16.8 | 16.6 | 17.2 | 15.8 | ||
| 5 persons | 9.0 | 8.4 | 8.8 | 8.7 | 8.8 | 8.7 | 8.5 | ||
| 6 or more persons | 4.0 | 3.9 | 3.9 | 4.2 | 3.8 | 4.0 | 3.7 | ||
| Total households | 100.0 | 100.0 | 100.0 | 100.0 | 100.0 | 100.0 | 100.0 | ||
| Note: The average grossing factor of all members of a household is used to calculate the number of households. The number of households should be treated as indicative only. | |||||||||
| Note: A new Labour Force Survey (LFS) replaced the Quarterly National Household Survey (QNHS) in Q3 2017 and, as a result, care should be taken when comparing data from before and after this period. Please see background notes of the LFS release for additional information. | |||||||||
| Note: The composition of the NUTS regions changed in 2016 and took effect in the LFS from Q1 2018. Data from Q1 2012 to Q4 2017 has also been revised to reflect these changes. Please see background notes of the Q1 2018 LFS release for additional information. | |||||||||
| Table 4 Number of households with or without person aged less than 18 by NUTS2 and NUTS3 regions | |||||||||
| '000 | |||||||||
| Region/Household by age of persons | Q2 12 | Q2 13 | Q2 14 | Q2 15 | Q2 16 | Q2 17 | Q2 18 | ||
| Northern and Western | |||||||||
| Household without person aged less than 18 | 201.6 | 202.2 | 199.7 | 190.4 | 206.6 | 210.3 | 223.0 | ||
| Household with person aged less than 18 | 112.9 | 113.3 | 110.3 | 114.8 | 110.8 | 111.4 | 109.0 | ||
| Total households | 314.4 | 315.5 | 310.0 | 305.2 | 317.4 | 321.7 | 331.9 | ||
| Border | |||||||||
| Household without person aged less than 18 | 94.5 | 96.3 | 91.6 | 88.4 | 95.2 | 99.3 | 104.4 | ||
| Household with person aged less than 18 | 53.9 | 53.0 | 53.7 | 54.5 | 52.7 | 54.3 | 51.1 | ||
| Total households | 148.4 | 149.2 | 145.3 | 142.8 | 147.9 | 153.6 | 155.5 | ||
| West | |||||||||
| Household without person aged less than 18 | 107.1 | 105.9 | 108.1 | 102.1 | 111.4 | 111.0 | 118.5 | ||
| Household with person aged less than 18 | 58.9 | 60.3 | 56.6 | 60.3 | 58.1 | 57.1 | 57.9 | ||
| Total households | 166.0 | 166.2 | 164.7 | 162.4 | 169.5 | 168.1 | 176.4 | ||
| Southern | |||||||||
| Household without person aged less than 18 | 356.8 | 367.6 | 365.7 | 373.2 | 376.1 | 380.8 | 400.1 | ||
| Household with person aged less than 18 | 215.8 | 215.9 | 212.0 | 209.8 | 209.5 | 210.7 | 213.4 | ||
| Total households | 572.6 | 583.5 | 577.7 | 582.9 | 585.6 | 591.5 | 613.5 | ||
| Mid-West | |||||||||
| Household without person aged less than 18 | 111.3 | 108.3 | 110.9 | 111.0 | 112.3 | 119.2 | 120.5 | ||
| Household with person aged less than 18 | 64.8 | 65.8 | 63.8 | 62.9 | 61.9 | 63.0 | 62.2 | ||
| Total households | 176.0 | 174.1 | 174.7 | 174.0 | 174.2 | 182.2 | 182.7 | ||
| South-East | |||||||||
| Household without person aged less than 18 | 89.6 | 98.3 | 95.0 | 99.5 | 101.4 | 99.5 | 105.3 | ||
| Household with person aged less than 18 | 59.6 | 58.7 | 56.8 | 57.8 | 57.2 | 58.8 | 57.0 | ||
| Total households | 149.2 | 157.0 | 151.8 | 157.3 | 158.6 | 158.3 | 162.3 | ||
| South-West | |||||||||
| Household without person aged less than 18 | 156.0 | 160.9 | 159.7 | 162.7 | 162.4 | 162.1 | 174.3 | ||
| Household with person aged less than 18 | 91.4 | 91.5 | 91.4 | 89.0 | 90.5 | 88.9 | 94.2 | ||
| Total households | 247.4 | 252.4 | 251.1 | 251.7 | 252.9 | 251.0 | 268.4 | ||
| Eastern and Midland | |||||||||
| Household without person aged less than 18 | 480.3 | 492.9 | 508.2 | 514.9 | 544.4 | 535.9 | 579.0 | ||
| Household with person aged less than 18 | 307.6 | 309.4 | 307.5 | 309.5 | 306.2 | 315.5 | 321.6 | ||
| Total households | 787.8 | 802.3 | 815.7 | 824.4 | 850.7 | 851.4 | 900.7 | ||
| Dublin | |||||||||
| Household without person aged less than 18 | 288.5 | 303.3 | 315.3 | 317.4 | 337.6 | 331.8 | 363.0 | ||
| Household with person aged less than 18 | 164.8 | 164.0 | 162.1 | 168.0 | 163.7 | 169.1 | 175.5 | ||
| Total households | 453.3 | 467.3 | 477.4 | 485.4 | 501.2 | 500.9 | 538.5 | ||
| Mid-East | |||||||||
| Household without person aged less than 18 | 130.0 | 126.5 | 131.8 | 131.9 | 138.5 | 138.0 | 144.2 | ||
| Household with person aged less than 18 | 100.4 | 102.6 | 101.8 | 100.4 | 100.6 | 102.6 | 103.8 | ||
| Total households | 230.4 | 229.1 | 233.6 | 232.3 | 239.1 | 240.6 | 248.0 | ||
| Midland | |||||||||
| Household without person aged less than 18 | 61.8 | 63.1 | 61.1 | 65.6 | 68.3 | 66.1 | 71.9 | ||
| Household with person aged less than 18 | 42.3 | 42.8 | 43.6 | 41.2 | 41.9 | 43.8 | 42.3 | ||
| Total households | 104.1 | 105.8 | 104.7 | 106.7 | 110.3 | 109.9 | 114.2 | ||
| State | |||||||||
| Household without person aged less than 18 | 1,038.7 | 1,062.7 | 1,073.7 | 1,078.4 | 1,127.1 | 1,127.0 | 1,202.1 | ||
| Household with person aged less than 18 | 636.2 | 638.6 | 629.8 | 634.0 | 626.6 | 637.5 | 644.0 | ||
| Total households | 1,674.9 | 1,701.3 | 1,703.4 | 1,712.5 | 1,753.6 | 1,764.5 | 1,846.1 | ||
| Note: The average grossing factor of all members of a household is used to calculate the number of households. The number of households should be treated as indicative only. | |||||||||
| Note: A new Labour Force Survey (LFS) replaced the Quarterly National Household Survey (QNHS) in Q3 2017 and, as a result, care should be taken when comparing data from before and after this period. Please see background notes of the LFS release for additional information. | |||||||||
| Note: The composition of the NUTS regions changed in 2016 and took effect in the LFS from Q1 2018. Data from Q1 2012 to Q4 2017 has also been revised to reflect these changes. Please see background notes of the Q1 2018 LFS release for additional information. | |||||||||
 Show Table 5 Share of households with or without person aged less than 18 by NUTS2 and NUTS3 regions
| Table 5 Share of households with or without person aged less than 18 by NUTS2 and NUTS3 regions | |||||||||
| % | |||||||||
| Region/Proportional household by age of persons | Q2 12 | Q2 13 | Q2 14 | Q2 15 | Q2 16 | Q2 17 | Q2 18 | ||
| Northern and Western | |||||||||
| Household without person aged less than 18 | 64.1 | 64.1 | 64.4 | 62.4 | 65.1 | 65.4 | 67.2 | ||
| Household with person aged less than 18 | 35.9 | 35.9 | 35.6 | 37.6 | 34.9 | 34.6 | 32.8 | ||
| Total households | 100.0 | 100.0 | 100.0 | 100.0 | 100.0 | 100.0 | 100.0 | ||
| Border | |||||||||
| Household without person aged less than 18 | 63.7 | 64.5 | 63.0 | 61.9 | 64.4 | 64.6 | 67.2 | ||
| Household with person aged less than 18 | 36.3 | 35.5 | 37.0 | 38.1 | 35.6 | 35.4 | 32.8 | ||
| Total households | 100.0 | 100.0 | 100.0 | 100.0 | 100.0 | 100.0 | 100.0 | ||
| West | |||||||||
| Household without person aged less than 18 | 64.5 | 63.7 | 65.6 | 62.9 | 65.7 | 66.0 | 67.2 | ||
| Household with person aged less than 18 | 35.5 | 36.3 | 34.4 | 37.1 | 34.3 | 34.0 | 32.8 | ||
| Total households | 100.0 | 100.0 | 100.0 | 100.0 | 100.0 | 100.0 | 100.0 | ||
| Southern | |||||||||
| Household without person aged less than 18 | 62.3 | 63.0 | 63.3 | 64.0 | 64.2 | 64.4 | 65.2 | ||
| Household with person aged less than 18 | 37.7 | 37.0 | 36.7 | 36.0 | 35.8 | 35.6 | 34.8 | ||
| Total households | 100.0 | 100.0 | 100.0 | 100.0 | 100.0 | 100.0 | 100.0 | ||
| Mid-West | |||||||||
| Household without person aged less than 18 | 63.2 | 62.2 | 63.5 | 63.8 | 64.5 | 65.4 | 66.0 | ||
| Household with person aged less than 18 | 36.8 | 37.8 | 36.5 | 36.2 | 35.5 | 34.6 | 34.0 | ||
| Total households | 100.0 | 100.0 | 100.0 | 100.0 | 100.0 | 100.0 | 100.0 | ||
| South-East | |||||||||
| Household without person aged less than 18 | 60.1 | 62.6 | 62.6 | 63.2 | 64.0 | 62.9 | 64.9 | ||
| Household with person aged less than 18 | 39.9 | 37.4 | 37.4 | 36.8 | 36.0 | 37.1 | 35.1 | ||
| Total households | 100.0 | 100.0 | 100.0 | 100.0 | 100.0 | 100.0 | 100.0 | ||
| South-West | |||||||||
| Household without person aged less than 18 | 63.0 | 63.7 | 63.6 | 64.6 | 64.2 | 64.6 | 64.9 | ||
| Household with person aged less than 18 | 37.0 | 36.3 | 36.4 | 35.4 | 35.8 | 35.4 | 35.1 | ||
| Total households | 100.0 | 100.0 | 100.0 | 100.0 | 100.0 | 100.0 | 100.0 | ||
| Eastern and Midland | |||||||||
| Household without person aged less than 18 | 61.0 | 61.4 | 62.3 | 62.5 | 64.0 | 62.9 | 64.3 | ||
| Household with person aged less than 18 | 39.0 | 38.6 | 37.7 | 37.5 | 36.0 | 37.1 | 35.7 | ||
| Total households | 100.0 | 100.0 | 100.0 | 100.0 | 100.0 | 100.0 | 100.0 | ||
| Dublin | |||||||||
| Household without person aged less than 18 | 63.6 | 64.9 | 66.0 | 65.4 | 67.3 | 66.2 | 67.4 | ||
| Household with person aged less than 18 | 36.4 | 35.1 | 34.0 | 34.6 | 32.7 | 33.8 | 32.6 | ||
| Total households | 100.0 | 100.0 | 100.0 | 100.0 | 100.0 | 100.0 | 100.0 | ||
| Mid-East | |||||||||
| Household without person aged less than 18 | 56.4 | 55.2 | 56.4 | 56.8 | 57.9 | 57.4 | 58.1 | ||
| Household with person aged less than 18 | 43.6 | 44.8 | 43.6 | 43.2 | 42.1 | 42.6 | 41.9 | ||
| Total households | 100.0 | 100.0 | 100.0 | 100.0 | 100.0 | 100.0 | 100.0 | ||
| Midland | |||||||||
| Household without person aged less than 18 | 59.4 | 59.6 | 58.4 | 61.4 | 62.0 | 60.2 | 62.9 | ||
| Household with person aged less than 18 | 40.6 | 40.4 | 41.6 | 38.6 | 38.0 | 39.8 | 37.1 | ||
| Total households | 100.0 | 100.0 | 100.0 | 100.0 | 100.0 | 100.0 | 100.0 | ||
| State | |||||||||
| Household without person aged less than 18 | 62.0 | 62.5 | 63.0 | 63.0 | 64.3 | 63.9 | 65.1 | ||
| Household with person aged less than 18 | 38.0 | 37.5 | 37.0 | 37.0 | 35.7 | 36.1 | 34.9 | ||
| Total households | 100.0 | 100.0 | 100.0 | 100.0 | 100.0 | 100.0 | 100.0 | ||
| Note: The average grossing factor of all members of a household is used to calculate the number of households. The number of households should be treated as indicative only. | |||||||||
| Note: A new Labour Force Survey (LFS) replaced the Quarterly National Household Survey (QNHS) in Q3 2017 and, as a result, care should be taken when comparing data from before and after this period. Please see background notes of the LFS release for additional information. | |||||||||
| Note: The composition of the NUTS regions changed in 2016 and took effect in the LFS from Q1 2018. Data from Q1 2012 to Q4 2017 has also been revised to reflect these changes. Please see background notes of the Q1 2018 LFS release for additional information. | |||||||||
| Table 6 Number of households classified by NUTS2 and NUTS3 regions and family units | |||||||||
| '000 | |||||||||
| Region/Household type | Q2 12 | Q2 13 | Q2 14 | Q2 15 | Q2 16 | Q2 17 | Q2 18 | ||
| Northern and Western | |||||||||
| Single person household | 81.7 | 81.7 | 77.8 | 72.5 | 78.1 | 80.1 | 94.7 | ||
| Couple with no children household (with/without other persons) | 71.5 | 69.6 | 69.5 | 66.6 | 75.9 | 76.7 | 75.3 | ||
| Couple with children household (with/without other persons) | 110.0 | 113.5 | 115.4 | 121.5 | 114.7 | 112.8 | 113.8 | ||
| Lone parent household (with/without other persons) | 34.4 | 34.7 | 32.3 | 32.8 | 33.2 | 35.3 | 33.2 | ||
| Two or more family unit household (with/without other persons) | [3.3] | * | [2.9] | * | * | * | * | ||
| All other households | 13.5 | 13.6 | 12.0 | 9.3 | 12.9 | 13.8 | 12.5 | ||
| Total households | 314.4 | 315.5 | 310.0 | 305.2 | 317.4 | 321.7 | 331.9 | ||
| Border | |||||||||
| Single person household | 42.0 | 41.8 | 35.9 | 33.9 | 35.9 | 42.1 | 45.6 | ||
| Couple with no children household (with/without other persons) | 31.9 | 32.2 | 32.9 | 30.2 | 36.9 | 34.1 | 34.9 | ||
| Couple with children household (with/without other persons) | 50.1 | 54.2 | 55.4 | 56.1 | 53.9 | 53.7 | 53.6 | ||
| Lone parent household (with/without other persons) | 17.3 | 15.9 | 15.9 | 16.8 | 15.5 | 18.2 | 16.3 | ||
| Two or more family unit household (with/without other persons) | * | * | * | * | * | * | * | ||
| All other households | 4.8 | [4.4] | [3.9] | [4.3] | [4.4] | [4.1] | * | ||
| Total households | 148.4 | 149.2 | 145.3 | 142.8 | 147.9 | 153.6 | 155.5 | ||
| West | |||||||||
| Single person household | 39.7 | 39.9 | 41.9 | 38.6 | 42.2 | 38.0 | 49.2 | ||
| Couple with no children household (with/without other persons) | 39.6 | 37.4 | 36.7 | 36.4 | 39.1 | 42.6 | 40.5 | ||
| Couple with children household (with/without other persons) | 59.9 | 59.4 | 60.0 | 65.4 | 60.7 | 59.2 | 60.1 | ||
| Lone parent household (with/without other persons) | 17.1 | 18.8 | 16.4 | 16.0 | 17.7 | 17.2 | 16.9 | ||
| Two or more family unit household (with/without other persons) | * | * | * | * | * | * | * | ||
| All other households | 8.7 | 9.2 | 8.1 | 5.1 | 8.4 | 9.6 | 8.8 | ||
| Total households | 166.0 | 166.2 | 164.7 | 162.4 | 169.5 | 168.1 | 176.4 | ||
| Southern | |||||||||
| Single person household | 129.7 | 135.9 | 130.0 | 140.1 | 144.9 | 141.3 | 166.5 | ||
| Couple with no children household (with/without other persons) | 127.9 | 132.3 | 129.3 | 132.0 | 127.4 | 136.7 | 135.3 | ||
| Couple with children household (with/without other persons) | 216.5 | 219.1 | 219.5 | 218.8 | 225.6 | 224.9 | 214.0 | ||
| Lone parent household (with/without other persons) | 67.9 | 65.4 | 65.2 | 62.1 | 62.9 | 61.2 | 68.5 | ||
| Two or more family unit household (with/without other persons) | 6.1 | 5.6 | 6.1 | 6.3 | 6.4 | 6.6 | 8.8 | ||
| All other households | 24.5 | 25.3 | 27.5 | 23.7 | 18.3 | 20.8 | 20.5 | ||
| Total households | 572.6 | 583.5 | 577.7 | 582.9 | 585.6 | 591.5 | 613.5 | ||
| Mid-West | |||||||||
| Single person household | 40.8 | 39.4 | 40.4 | 40.8 | 41.1 | 48.6 | 50.3 | ||
| Couple with no children household (with/without other persons) | 41.6 | 40.1 | 40.7 | 39.5 | 39.1 | 39.2 | 40.8 | ||
| Couple with children household (with/without other persons) | 66.1 | 66.7 | 65.1 | 68.0 | 69.6 | 65.6 | 63.1 | ||
| Lone parent household (with/without other persons) | 19.2 | 18.6 | 18.4 | 16.3 | 17.9 | 20.2 | 19.7 | ||
| Two or more family unit household (with/without other persons) | * | * | * | * | * | * | * | ||
| All other households | 6.7 | 7.1 | 8.0 | 6.9 | [4.4] | 7.3 | 6.4 | ||
| Total households | 176.0 | 174.1 | 174.7 | 174.0 | 174.2 | 182.2 | 182.7 | ||
| South-East | |||||||||
| Single person household | 31.1 | 37.0 | 32.2 | 38.4 | 40.2 | 36.6 | 41.2 | ||
| Couple with no children household (with/without other persons) | 34.0 | 38.1 | 35.8 | 35.6 | 35.1 | 40.0 | 37.1 | ||
| Couple with children household (with/without other persons) | 58.7 | 57.6 | 59.4 | 57.2 | 58.5 | 60.2 | 55.5 | ||
| Lone parent household (with/without other persons) | 18.5 | 17.4 | 17.7 | 19.2 | 18.2 | 15.9 | 21.4 | ||
| Two or more family unit household (with/without other persons) | * | * | * | * | * | * | * | ||
| All other households | 4.9 | 5.7 | 5.4 | 5.6 | [4.9] | * | * | ||
| Total households | 149.2 | 157.0 | 151.8 | 157.3 | 158.6 | 158.3 | 162.3 | ||
| South-West | |||||||||
| Single person household | 57.8 | 59.5 | 57.4 | 60.9 | 63.7 | 56.2 | 74.9 | ||
| Couple with no children household (with/without other persons) | 52.3 | 54.1 | 52.8 | 56.9 | 53.2 | 57.4 | 57.4 | ||
| Couple with children household (with/without other persons) | 91.6 | 94.8 | 95.0 | 93.5 | 97.5 | 99.1 | 95.4 | ||
| Lone parent household (with/without other persons) | 30.2 | 29.4 | 29.1 | 26.6 | 26.9 | 25.0 | 27.5 | ||
| Two or more family unit household (with/without other persons) | [2.6] | * | [2.6] | [2.8] | * | * | [4.0] | ||
| All other households | 12.9 | 12.5 | 14.1 | 11.1 | 9.1 | 10.1 | 9.3 | ||
| Total households | 247.4 | 252.4 | 251.1 | 251.7 | 252.9 | 251.0 | 268.4 | ||
| Eastern and Midland | |||||||||
| Single person household | 158.5 | 167.7 | 172.4 | 177.4 | 196.6 | 191.8 | 229.1 | ||
| Couple with no children household (with/without other persons) | 165.9 | 171.1 | 176.0 | 176.3 | 177.5 | 169.6 | 191.0 | ||
| Couple with children household (with/without other persons) | 305.0 | 310.6 | 309.5 | 310.8 | 312.0 | 315.1 | 311.3 | ||
| Lone parent household (with/without other persons) | 100.9 | 97.1 | 94.9 | 96.8 | 100.5 | 105.5 | 110.3 | ||
| Two or more family unit household (with/without other persons) | 12.8 | 11.5 | 11.4 | 14.8 | 16.9 | 17.4 | 15.6 | ||
| All other households | 44.7 | 44.4 | 51.6 | 48.3 | 47.2 | 52.0 | 43.5 | ||
| Total households | 787.8 | 802.3 | 815.7 | 824.4 | 850.7 | 851.4 | 900.7 | ||
| Dublin | |||||||||
| Single person household | 92.4 | 99.5 | 106.4 | 110.6 | 119.1 | 118.7 | 152.0 | ||
| Couple with no children household (with/without other persons) | 93.2 | 99.3 | 101.4 | 103.7 | 106.6 | 103.5 | 111.7 | ||
| Couple with children household (with/without other persons) | 164.2 | 165.9 | 165.4 | 165.1 | 162.4 | 163.6 | 170.0 | ||
| Lone parent household (with/without other persons) | 61.9 | 60.3 | 55.3 | 57.4 | 61.5 | 63.4 | 60.7 | ||
| Two or more family unit household (with/without other persons) | 8.9 | 7.8 | 8.0 | 10.0 | 11.7 | 12.6 | 10.0 | ||
| All other households | 32.8 | 34.5 | 40.8 | 38.6 | 39.9 | 39.0 | 34.0 | ||
| Total households | 453.3 | 467.3 | 477.4 | 485.4 | 501.2 | 500.9 | 538.5 | ||
| Mid-East | |||||||||
| Single person household | 44.0 | 43.9 | 44.0 | 42.5 | 47.9 | 45.4 | 48.5 | ||
| Couple with no children household (with/without other persons) | 50.9 | 48.1 | 51.5 | 48.0 | 48.0 | 47.0 | 53.7 | ||
| Couple with children household (with/without other persons) | 97.7 | 103.0 | 100.8 | 103.4 | 106.6 | 107.8 | 101.4 | ||
| Lone parent household (with/without other persons) | 26.9 | 24.7 | 27.0 | 28.0 | 26.7 | 26.9 | 32.9 | ||
| Two or more family unit household (with/without other persons) | [3.0] | [2.8] | * | [3.7] | * | * | [4.2] | ||
| All other households | 7.8 | 6.5 | 7.5 | 6.7 | [5.7] | 9.9 | [7.3] | ||
| Total households | 230.4 | 229.1 | 233.6 | 232.3 | 239.1 | 240.6 | 248.0 | ||
| Midland | |||||||||
| Single person household | 22.1 | 24.2 | 21.9 | 24.3 | 29.5 | 27.7 | 28.6 | ||
| Couple with no children household (with/without other persons) | 21.8 | 23.6 | 23.1 | 24.6 | 22.9 | 19.1 | 25.6 | ||
| Couple with children household (with/without other persons) | 43.1 | 41.8 | 43.3 | 42.2 | 43.0 | 43.7 | 39.9 | ||
| Lone parent household (with/without other persons) | 12.1 | 12.0 | 12.5 | 11.4 | 12.4 | 15.1 | 16.7 | ||
| Two or more family unit household (with/without other persons) | * | * | * | * | * | * | * | ||
| All other households | 4.1 | [3.3] | [3.3] | [3.0] | * | * | * | ||
| Total households | 104.1 | 105.8 | 104.7 | 106.7 | 110.3 | 109.9 | 114.2 | ||
| State | |||||||||
| Single person household | 369.9 | 385.3 | 380.2 | 390.0 | 419.6 | 413.2 | 490.2 | ||
| Couple with no children household (with/without other persons) | 365.3 | 372.9 | 374.8 | 374.9 | 380.9 | 382.9 | 401.5 | ||
| Couple with children household (with/without other persons) | 631.5 | 643.2 | 644.5 | 651.0 | 652.3 | 652.8 | 639.1 | ||
| Lone parent household (with/without other persons) | 203.1 | 197.2 | 192.4 | 191.7 | 196.6 | 202.0 | 211.9 | ||
| Two or more family unit household (with/without other persons) | 22.3 | 19.4 | 20.4 | 23.6 | 25.8 | 27.0 | 26.8 | ||
| All other households | 82.7 | 83.3 | 91.1 | 81.3 | 78.4 | 86.6 | 76.5 | ||
| Total households | 1,674.9 | 1,701.3 | 1,703.4 | 1,712.5 | 1,753.6 | 1,764.5 | 1,846.1 | ||
| Note: The average grossing factor of all members of a household is used to calculate the number of households. The number of households should be treated as indicative only. | |||||||||
| Note: A new Labour Force Survey (LFS) replaced the Quarterly National Household Survey (QNHS) in Q3 2017 and, as a result, care should be taken when comparing data from before and after this period. Please see background notes of the LFS release for additional information. | |||||||||
| Note: The composition of the NUTS regions changed in 2016 and took effect in the LFS from Q1 2018. Data from Q1 2012 to Q4 2017 has also been revised to reflect these changes. Please see background notes of the Q1 2018 LFS release for additional information. | |||||||||
| Table 7 Adult members of family units classified by NUTS2 and NUTS3 regions, composition of family unit, ILO Economic Status and sex | ||||||||||
| '000 | ||||||||||
| Region/Family unit type/ILO Economic Status/Sex | Q2 12 | Q2 13 | Q2 14 | Q2 15 | Q2 16 | Q2 17 | Q2 18 | |||
| Northern and Western | ||||||||||
| Couple without children | ||||||||||
| In employment | ||||||||||
| Male | 35.2 | 36.4 | 35.4 | 34.9 | 39.4 | 41.3 | 39.6 | |||
| Female | 33.6 | 30.8 | 28.3 | 27.9 | 35.0 | 32.2 | 32.5 | |||
| Total | 68.8 | 67.1 | 63.7 | 62.8 | 74.4 | 73.5 | 72.1 | |||
| Unemployed | ||||||||||
| Male | 4.3 | [3.4] | [3.6] | * | * | * | * | |||
| Female | [3.5] | * | * | * | * | * | * | |||
| Total | 7.8 | 6.0 | 5.4 | [3.4] | [4.6] | [3.8] | * | |||
| Not in the labour force | ||||||||||
| Male | 34.0 | 30.5 | 31.6 | 31.4 | 35.0 | 36.3 | 36.3 | |||
| Female | 36.6 | 37.4 | 40.0 | 38.3 | 41.3 | 42.7 | 43.7 | |||
| Total | 70.5 | 68.0 | 71.6 | 69.7 | 76.3 | 79.0 | 80.0 | |||
| Total | ||||||||||
| Male | 73.5 | 70.3 | 70.6 | 68.6 | 76.8 | 79.2 | 77.0 | |||
| Female | 73.7 | 70.8 | 70.1 | 67.3 | 78.4 | 77.0 | 77.3 | |||
| Total | 147.2 | 141.0 | 140.7 | 135.9 | 155.2 | 156.3 | 154.4 | |||
| Couple with children | ||||||||||
| In employment | ||||||||||
| Male | 85.7 | 92.8 | 95.6 | 102.6 | 96.5 | 100.1 | 92.3 | |||
| Female | 63.8 | 65.1 | 68.5 | 76.3 | 73.9 | 73.3 | 74.5 | |||
| Total | 149.5 | 157.9 | 164.2 | 178.9 | 170.4 | 173.5 | 166.8 | |||
| Unemployed | ||||||||||
| Male | 14.7 | 10.2 | 8.8 | 8.7 | 6.5 | [4.8] | * | |||
| Female | 7.5 | 6.9 | 6.4 | [4.9] | [3.8] | * | * | |||
| Total | 22.2 | 17.1 | 15.3 | 13.6 | 10.3 | 7.2 | [7.3] | |||
| Not in the labour force | ||||||||||
| Male | 18.5 | 16.6 | 16.8 | 15.5 | 14.4 | 16.4 | 18.5 | |||
| Female | 40.8 | 41.6 | 39.7 | 40.1 | 36.8 | 37.2 | 36.3 | |||
| Total | 59.4 | 58.2 | 56.6 | 55.5 | 51.2 | 53.7 | 54.7 | |||
| Total | ||||||||||
| Male | 119.0 | 119.7 | 121.3 | 126.7 | 117.4 | 121.3 | 115.3 | |||
| Female | 112.0 | 113.6 | 114.7 | 121.2 | 114.6 | 112.9 | 113.6 | |||
| Total | 231.0 | 233.2 | 236.0 | 248.0 | 232.0 | 234.3 | 228.9 | |||
| Lone parent | ||||||||||
| In employment | ||||||||||
| Male | * | * | * | * | * | * | * | |||
| Female | 13.9 | 15.4 | 13.7 | 13.6 | 13.3 | 16.4 | 17.1 | |||
| Total | 15.6 | 17.1 | 15.6 | 15.0 | 15.7 | 19.3 | 20.8 | |||
| Unemployed | ||||||||||
| Male | * | * | * | * | * | * | * | |||
| Female | [3.2] | [3.4] | * | * | * | * | * | |||
| Total | [3.5] | [3.4] | [3.3] | * | * | * | * | |||
| Not in the labour force | ||||||||||
| Male | * | * | [2.6] | [2.7] | * | * | * | |||
| Female | 15.6 | 14.4 | 14.0 | 15.4 | 15.0 | 14.9 | 9.4 | |||
| Total | 17.8 | 16.2 | 16.6 | 18.1 | 16.8 | 16.5 | 11.3 | |||
| Total | ||||||||||
| Male | 4.2 | [3.7] | 5.0 | 4.6 | 4.5 | [4.6] | [6.0] | |||
| Female | 32.7 | 33.1 | 30.4 | 30.9 | 30.3 | 32.9 | 28.0 | |||
| Total | 36.8 | 36.7 | 35.4 | 35.5 | 34.8 | 37.6 | 34.0 | |||
| All family units | ||||||||||
| In employment | ||||||||||
| Male | 122.7 | 130.9 | 132.9 | 138.8 | 138.3 | 144.3 | 135.7 | |||
| Female | 111.2 | 111.2 | 110.5 | 117.8 | 122.2 | 121.9 | 124.0 | |||
| Total | 233.9 | 242.1 | 243.4 | 256.6 | 260.5 | 266.2 | 259.7 | |||
| Unemployed | ||||||||||
| Male | 19.3 | 13.7 | 13.0 | 11.6 | 9.3 | 6.6 | [6.0] | |||
| Female | 14.1 | 12.8 | 11.0 | 7.9 | 8.0 | [6.2] | [5.5] | |||
| Total | 33.5 | 26.5 | 24.0 | 19.5 | 17.2 | 12.8 | 11.5 | |||
| Not in the labour force | ||||||||||
| Male | 54.7 | 49.0 | 51.0 | 49.6 | 51.2 | 54.3 | 56.6 | |||
| Female | 93.0 | 93.4 | 93.7 | 93.7 | 93.1 | 94.8 | 89.4 | |||
| Total | 147.7 | 142.4 | 144.8 | 143.3 | 144.3 | 149.1 | 146.0 | |||
| Total | ||||||||||
| Male | 196.7 | 193.6 | 196.9 | 200.0 | 198.7 | 205.2 | 198.3 | |||
| Female | 218.3 | 217.4 | 215.2 | 219.4 | 223.3 | 222.9 | 218.9 | |||
| Total | 415.0 | 411.0 | 412.1 | 419.4 | 422.0 | 428.1 | 417.3 | |||
| Border | ||||||||||
| Couple without children | ||||||||||
| In employment | ||||||||||
| Male | 14.3 | 16.3 | 16.4 | 16.8 | 19.8 | 18.5 | 16.8 | |||
| Female | 14.4 | 14.0 | 13.3 | 12.4 | 17.1 | 13.8 | 13.7 | |||
| Total | 28.7 | 30.2 | 29.7 | 29.2 | 36.9 | 32.3 | 30.6 | |||
| Unemployed | ||||||||||
| Male | [2.5] | * | * | * | * | * | * | |||
| Female | * | * | * | * | * | * | * | |||
| Total | 4.3 | * | * | * | * | * | * | |||
| Not in the labour force | ||||||||||
| Male | 16.0 | 14.7 | 15.7 | 13.6 | 16.6 | 16.6 | 18.3 | |||
| Female | 17.3 | 17.8 | 18.6 | 17.7 | 19.6 | 19.3 | 21.7 | |||
| Total | 33.3 | 32.5 | 34.3 | 31.3 | 36.2 | 35.9 | 40.1 | |||
| Total | ||||||||||
| Male | 32.8 | 32.1 | 33.3 | 31.3 | 37.4 | 35.8 | 35.8 | |||
| Female | 33.5 | 32.7 | 32.7 | 30.7 | 37.4 | 33.7 | 35.9 | |||
| Total | 66.3 | 64.9 | 66.0 | 62.0 | 74.8 | 69.5 | 71.7 | |||
| Couple with children | ||||||||||
| In employment | ||||||||||
| Male | 39.6 | 43.1 | 45.4 | 46.7 | 46.3 | 50.4 | 42.8 | |||
| Female | 28.6 | 30.1 | 33.2 | 36.3 | 35.8 | 34.6 | 33.6 | |||
| Total | 68.2 | 73.3 | 78.6 | 83.0 | 82.1 | 85.0 | 76.4 | |||
| Unemployed | ||||||||||
| Male | 6.2 | 4.3 | [3.4] | [3.9] | [2.6] | * | * | |||
| Female | [2.8] | * | * | * | * | * | * | |||
| Total | 9.0 | 7.1 | 6.5 | 5.3 | [4.1] | * | * | |||
| Not in the labour force | ||||||||||
| Male | 10.1 | 9.4 | 8.8 | 8.1 | 7.3 | 7.9 | 8.1 | |||
| Female | 19.9 | 20.4 | 18.1 | 17.9 | 14.7 | 16.3 | 16.8 | |||
| Total | 30.1 | 29.8 | 27.0 | 26.0 | 22.0 | 24.2 | 24.9 | |||
| Total | ||||||||||
| Male | 55.9 | 56.7 | 57.6 | 58.7 | 56.1 | 59.6 | 52.0 | |||
| Female | 51.3 | 53.4 | 54.4 | 55.6 | 52.0 | 51.6 | 52.4 | |||
| Total | 107.2 | 110.2 | 112.0 | 114.3 | 108.2 | 111.2 | 104.4 | |||
| Lone parent | ||||||||||
| In employment | ||||||||||
| Male | * | * | * | * | * | * | * | |||
| Female | 7.2 | 6.7 | 6.6 | 7.8 | 6.5 | 8.9 | 9.3 | |||
| Total | 8.0 | 7.4 | 7.5 | 8.5 | 7.7 | 10.5 | 10.6 | |||
| Unemployed | ||||||||||
| Male | * | * | * | * | * | * | * | |||
| Female | * | * | * | * | * | * | * | |||
| Total | * | * | * | * | * | * | * | |||
| Not in the labour force | ||||||||||
| Male | * | * | * | * | * | * | * | |||
| Female | 8.1 | 7.0 | 7.2 | 7.4 | 7.2 | 7.4 | [4.1] | |||
| Total | 9.4 | 7.9 | 8.3 | 9.0 | 8.2 | 7.9 | [5.3] | |||
| Total | ||||||||||
| Male | * | * | * | [2.6] | * | * | * | |||
| Female | 16.3 | 15.0 | 15.0 | 16.2 | 14.2 | 16.9 | 13.9 | |||
| Total | 18.7 | 16.6 | 17.4 | 18.8 | 16.3 | 19.0 | 16.3 | |||
| All family units | ||||||||||
| In employment | ||||||||||
| Male | 54.8 | 60.1 | 62.7 | 64.2 | 67.2 | 70.5 | 60.9 | |||
| Female | 50.1 | 50.8 | 53.1 | 56.5 | 59.4 | 57.3 | 56.7 | |||
| Total | 104.9 | 110.9 | 115.8 | 120.7 | 126.7 | 127.8 | 117.6 | |||
| Unemployed | ||||||||||
| Male | 8.9 | 5.4 | 5.0 | 5.1 | [3.6] | * | * | |||
| Female | 5.6 | 5.2 | [5.2] | * | * | * | * | |||
| Total | 14.5 | 10.6 | 10.2 | 8.1 | 6.3 | [3.9] | * | |||
| Not in the labour force | ||||||||||
| Male | 27.4 | 25.0 | 25.5 | 23.4 | 24.9 | 25.0 | 27.6 | |||
| Female | 45.4 | 45.2 | 44.0 | 43.0 | 41.5 | 43.0 | 42.7 | |||
| Total | 72.8 | 70.2 | 69.5 | 66.3 | 66.4 | 68.1 | 70.3 | |||
| Total | ||||||||||
| Male | 91.1 | 90.5 | 93.3 | 92.7 | 95.7 | 97.5 | 90.3 | |||
| Female | 101.1 | 101.2 | 102.2 | 102.5 | 103.7 | 102.2 | 102.2 | |||
| Total | 192.2 | 191.7 | 195.5 | 195.2 | 199.3 | 199.7 | 192.5 | |||
| West | ||||||||||
| Couple without children | ||||||||||
| In employment | ||||||||||
| Male | 20.9 | 20.1 | 19.0 | 18.1 | 19.6 | 22.8 | 22.8 | |||
| Female | 19.2 | 16.8 | 14.9 | 15.4 | 17.9 | 18.4 | 18.7 | |||
| Total | 40.1 | 36.9 | 33.9 | 33.5 | 37.5 | 41.2 | 41.5 | |||
| Unemployed | ||||||||||
| Male | * | * | * | * | * | * | * | |||
| Female | * | * | * | * | * | * | * | |||
| Total | [3.5] | [3.8] | [3.4] | * | * | * | * | |||
| Not in the labour force | ||||||||||
| Male | 17.9 | 15.8 | 15.9 | 17.8 | 18.4 | 19.7 | 17.9 | |||
| Female | 19.3 | 19.6 | 21.4 | 20.6 | 21.7 | 23.3 | 22.0 | |||
| Total | 37.2 | 35.5 | 37.4 | 38.4 | 40.1 | 43.0 | 39.9 | |||
| Total | ||||||||||
| Male | 40.7 | 38.2 | 37.3 | 37.3 | 39.4 | 43.4 | 41.2 | |||
| Female | 40.1 | 38.0 | 37.4 | 36.6 | 41.0 | 43.3 | 41.4 | |||
| Total | 80.9 | 76.2 | 74.7 | 73.8 | 80.4 | 86.8 | 82.6 | |||
| Couple with children | ||||||||||
| In employment | ||||||||||
| Male | 46.1 | 49.7 | 50.3 | 55.9 | 50.2 | 49.7 | 49.5 | |||
| Female | 35.2 | 35.0 | 35.4 | 40.0 | 38.1 | 38.7 | 40.9 | |||
| Total | 81.3 | 84.7 | 85.6 | 95.9 | 88.3 | 88.4 | 90.4 | |||
| Unemployed | ||||||||||
| Male | 8.5 | 6.0 | 5.4 | [4.8] | [4.0] | [3.5] | * | |||
| Female | 4.7 | [4.0] | [3.3] | * | * | * | * | |||
| Total | 13.2 | 10.0 | 8.7 | 8.3 | 6.2 | [5.2] | * | |||
| Not in the labour force | ||||||||||
| Male | 8.4 | 7.2 | 8.0 | 7.3 | 7.1 | 8.5 | 10.4 | |||
| Female | 20.9 | 21.2 | 21.6 | 22.2 | 22.1 | 20.9 | 19.5 | |||
| Total | 29.3 | 28.4 | 29.6 | 29.5 | 29.2 | 29.4 | 29.8 | |||
| Total | ||||||||||
| Male | 63.1 | 62.9 | 63.7 | 68.0 | 61.3 | 61.7 | 63.3 | |||
| Female | 60.7 | 60.2 | 60.3 | 65.6 | 62.5 | 61.4 | 61.2 | |||
| Total | 123.8 | 123.1 | 124.0 | 133.7 | 123.8 | 123.1 | 124.5 | |||
| Lone parent | ||||||||||
| In employment | ||||||||||
| Male | * | * | * | * | * | * | * | |||
| Female | 6.7 | 8.7 | 7.1 | 5.8 | 6.7 | 7.6 | 7.8 | |||
| Total | 7.5 | 9.7 | 8.0 | 6.4 | 8.0 | 8.8 | 10.2 | |||
| Unemployed | ||||||||||
| Male | * | * | * | * | * | * | * | |||
| Female | * | * | * | * | * | * | * | |||
| Total | * | * | * | * | * | * | * | |||
| Not in the labour force | ||||||||||
| Male | * | * | * | * | * | * | * | |||
| Female | 7.5 | 7.3 | 6.7 | 8.0 | 7.8 | 7.5 | [5.3] | |||
| Total | 8.4 | 8.3 | 8.3 | 9.1 | 8.6 | 8.6 | [6.0] | |||
| Total | ||||||||||
| Male | * | * | [2.7] | * | * | * | * | |||
| Female | 16.4 | 18.0 | 15.3 | 14.7 | 16.2 | 16.0 | 14.1 | |||
| Total | 18.2 | 20.1 | 18.0 | 16.7 | 18.5 | 18.6 | 17.7 | |||
| All family units | ||||||||||
| In employment | ||||||||||
| Male | 67.9 | 70.8 | 70.2 | 74.6 | 71.1 | 73.8 | 74.8 | |||
| Female | 61.1 | 60.5 | 57.4 | 61.2 | 62.7 | 64.7 | 67.3 | |||
| Total | 128.9 | 131.3 | 127.6 | 135.8 | 133.8 | 138.5 | 142.1 | |||
| Unemployed | ||||||||||
| Male | 10.5 | 8.3 | 8.0 | 6.5 | 5.7 | [4.5] | * | |||
| Female | 8.5 | 7.6 | 5.8 | [4.9] | [5.3] | * | * | |||
| Total | 19.0 | 15.9 | 13.8 | 11.4 | 11.0 | 8.9 | [6.9] | |||
| Not in the labour force | ||||||||||
| Male | 27.2 | 24.0 | 25.5 | 26.2 | 26.3 | 29.3 | 29.0 | |||
| Female | 47.7 | 48.1 | 49.8 | 50.8 | 51.6 | 51.7 | 46.7 | |||
| Total | 74.9 | 72.2 | 75.3 | 77.0 | 77.9 | 81.0 | 75.7 | |||
| Total | ||||||||||
| Male | 105.6 | 103.1 | 103.6 | 107.3 | 103.1 | 107.7 | 108.0 | |||
| Female | 117.2 | 116.2 | 113.0 | 116.9 | 119.7 | 120.8 | 116.7 | |||
| Total | 222.8 | 219.3 | 216.7 | 224.2 | 222.7 | 228.4 | 224.8 | |||
| Southern | ||||||||||
| Couple without children | ||||||||||
| In employment | ||||||||||
| Male | 64.2 | 63.5 | 61.7 | 70.4 | 66.9 | 66.4 | 71.7 | |||
| Female | 56.0 | 58.0 | 54.4 | 59.4 | 56.7 | 62.0 | 56.8 | |||
| Total | 120.2 | 121.5 | 116.1 | 129.9 | 123.6 | 128.4 | 128.5 | |||
| Unemployed | ||||||||||
| Male | 7.6 | 7.0 | 6.2 | 6.0 | [3.7] | * | * | |||
| Female | 4.9 | 5.4 | [5.4] | [4.6] | * | * | * | |||
| Total | 12.5 | 12.4 | 11.6 | 10.7 | 6.8 | [5.7] | [5.7] | |||
| Not in the labour force | ||||||||||
| Male | 61.1 | 65.8 | 66.4 | 61.3 | 61.0 | 68.3 | 66.0 | |||
| Female | 67.7 | 71.2 | 71.0 | 69.5 | 68.3 | 78.8 | 80.4 | |||
| Total | 128.8 | 137.0 | 137.4 | 130.8 | 129.3 | 147.2 | 146.4 | |||
| Total | ||||||||||
| Male | 132.9 | 136.3 | 134.3 | 137.8 | 131.5 | 137.9 | 140.8 | |||
| Female | 128.5 | 134.6 | 130.8 | 133.6 | 128.2 | 143.3 | 139.8 | |||
| Total | 261.5 | 270.9 | 265.1 | 271.4 | 259.7 | 281.3 | 280.6 | |||
| Couple with children | ||||||||||
| In employment | ||||||||||
| Male | 174.9 | 176.9 | 181.6 | 187.5 | 195.8 | 197.1 | 198.6 | |||
| Female | 129.2 | 131.2 | 137.6 | 139.5 | 142.3 | 146.4 | 143.7 | |||
| Total | 304.1 | 308.1 | 319.2 | 327.1 | 338.2 | 343.5 | 342.3 | |||
| Unemployed | ||||||||||
| Male | 29.8 | 23.4 | 19.7 | 17.6 | 12.9 | 8.4 | [7.0] | |||
| Female | 15.0 | 16.3 | 11.9 | 11.3 | 9.1 | * | [4.8] | |||
| Total | 44.7 | 39.7 | 31.6 | 28.9 | 22.0 | 12.4 | 11.8 | |||
| Not in the labour force | ||||||||||
| Male | 29.0 | 28.0 | 27.4 | 24.3 | 27.9 | 27.3 | 25.2 | |||
| Female | 75.7 | 71.0 | 71.6 | 70.2 | 78.7 | 75.6 | 66.3 | |||
| Total | 104.7 | 99.0 | 99.1 | 94.5 | 106.6 | 102.9 | 91.4 | |||
| Total | ||||||||||
| Male | 233.6 | 228.3 | 228.8 | 229.5 | 236.7 | 232.8 | 230.8 | |||
| Female | 219.9 | 218.5 | 221.1 | 221.0 | 230.1 | 226.0 | 214.8 | |||
| Total | 453.6 | 446.8 | 449.9 | 450.5 | 466.8 | 458.9 | 445.6 | |||
| Lone parent | ||||||||||
| In employment | ||||||||||
| Male | 3.9 | 4.5 | 4.7 | 4.5 | [4.1] | [4.0] | [7.2] | |||
| Female | 27.5 | 27.3 | 25.0 | 26.6 | 28.5 | 28.4 | 36.7 | |||
| Total | 31.4 | 31.8 | 29.7 | 31.1 | 32.6 | 32.3 | 43.9 | |||
| Unemployed | ||||||||||
| Male | * | * | * | * | * | * | * | |||
| Female | 8.8 | 8.1 | 6.1 | 7.4 | [4.8] | [4.1] | * | |||
| Total | 9.9 | 9.4 | 7.2 | 8.1 | [5.8] | [4.1] | * | |||
| Not in the labour force | ||||||||||
| Male | 3.7 | 3.6 | 4.4 | [3.3] | [4.1] | [3.7] | * | |||
| Female | 29.6 | 25.7 | 27.9 | 25.7 | 26.5 | 25.6 | 25.9 | |||
| Total | 33.3 | 29.3 | 32.3 | 29.0 | 30.6 | 29.3 | 28.5 | |||
| Total | ||||||||||
| Male | 8.8 | 9.5 | 10.2 | 8.4 | 9.2 | 7.7 | 10.0 | |||
| Female | 65.8 | 61.0 | 59.1 | 59.8 | 59.8 | 58.1 | 65.7 | |||
| Total | 74.6 | 70.5 | 69.3 | 68.2 | 69.0 | 65.7 | 75.7 | |||
| All family units | ||||||||||
| In employment | ||||||||||
| Male | 243.0 | 244.9 | 248.0 | 262.5 | 266.8 | 267.5 | 277.5 | |||
| Female | 212.7 | 216.5 | 217.0 | 225.6 | 227.6 | 236.8 | 237.2 | |||
| Total | 455.7 | 461.4 | 465.0 | 488.1 | 494.3 | 504.3 | 514.7 | |||
| Unemployed | ||||||||||
| Male | 38.5 | 31.7 | 27.0 | 24.3 | 17.6 | 11.6 | 10.2 | |||
| Female | 28.6 | 29.8 | 23.4 | 23.4 | 17.0 | 10.6 | 10.6 | |||
| Total | 67.2 | 61.5 | 50.4 | 47.6 | 34.6 | 22.2 | 20.8 | |||
| Not in the labour force | ||||||||||
| Male | 93.8 | 97.5 | 98.3 | 88.9 | 93.0 | 99.3 | 93.8 | |||
| Female | 173.0 | 167.8 | 170.6 | 165.4 | 173.4 | 180.1 | 172.5 | |||
| Total | 266.8 | 265.3 | 268.9 | 254.4 | 266.5 | 279.3 | 266.4 | |||
| Total | ||||||||||
| Male | 375.4 | 374.1 | 373.3 | 375.7 | 377.4 | 378.4 | 381.5 | |||
| Female | 414.2 | 414.1 | 410.9 | 414.4 | 418.0 | 427.5 | 420.4 | |||
| Total | 789.6 | 788.2 | 784.3 | 790.1 | 795.4 | 805.9 | 801.9 | |||
| Mid-West | ||||||||||
| Couple without children | ||||||||||
| In employment | ||||||||||
| Male | 22.1 | 19.7 | 19.1 | 20.4 | 20.2 | 19.1 | 21.7 | |||
| Female | 18.6 | 17.9 | 16.0 | 18.0 | 18.6 | 16.9 | 17.3 | |||
| Total | 40.8 | 37.7 | 35.2 | 38.3 | 38.8 | 36.0 | 39.0 | |||
| Unemployed | ||||||||||
| Male | [2.6] | * | * | * | * | * | * | |||
| Female | * | * | * | * | * | * | * | |||
| Total | 5.1 | [4.2] | * | [4.0] | * | * | * | |||
| Not in the labour force | ||||||||||
| Male | 18.4 | 20.9 | 20.9 | 19.5 | 18.3 | 18.3 | 19.3 | |||
| Female | 20.6 | 20.3 | 23.5 | 20.9 | 20.6 | 22.6 | 24.3 | |||
| Total | 39.0 | 41.2 | 44.5 | 40.4 | 38.9 | 40.9 | 43.6 | |||
| Total | ||||||||||
| Male | 43.1 | 42.8 | 41.5 | 42.2 | 39.6 | 38.7 | 41.9 | |||
| Female | 41.6 | 40.3 | 41.5 | 40.5 | 40.6 | 40.7 | 42.8 | |||
| Total | 84.8 | 83.0 | 83.0 | 82.7 | 80.2 | 79.5 | 84.7 | |||
| Couple with children | ||||||||||
| In employment | ||||||||||
| Male | 52.7 | 54.3 | 53.9 | 60.0 | 59.3 | 58.1 | 60.5 | |||
| Female | 38.1 | 40.4 | 40.8 | 43.1 | 44.7 | 45.4 | 40.3 | |||
| Total | 90.8 | 94.7 | 94.8 | 103.0 | 104.1 | 103.5 | 100.9 | |||
| Unemployed | ||||||||||
| Male | 9.7 | 9.3 | 6.8 | [5.2] | [4.4] | * | * | |||
| Female | 5.1 | 6.8 | [5.1] | [4.7] | * | * | * | |||
| Total | 14.8 | 16.1 | 11.9 | 9.9 | 8.2 | [4.7] | * | |||
| Not in the labour force | ||||||||||
| Male | 7.9 | 8.1 | 6.9 | 8.2 | 8.4 | 7.6 | 6.8 | |||
| Female | 21.9 | 18.9 | 19.9 | 21.8 | 23.5 | 20.4 | 22.4 | |||
| Total | 29.8 | 27.0 | 26.8 | 30.0 | 31.9 | 28.1 | 29.2 | |||
| Total | ||||||||||
| Male | 70.2 | 71.6 | 67.6 | 73.4 | 72.1 | 69.3 | 69.3 | |||
| Female | 65.1 | 66.2 | 65.9 | 69.5 | 72.1 | 66.9 | 63.8 | |||
| Total | 135.3 | 137.8 | 133.5 | 142.9 | 144.2 | 136.2 | 133.1 | |||
| Lone parent | ||||||||||
| In employment | ||||||||||
| Male | * | * | * | * | * | * | * | |||
| Female | 7.1 | 7.8 | 6.8 | 7.4 | 6.8 | 8.2 | 11.7 | |||
| Total | 8.1 | 8.9 | 8.7 | 9.0 | 8.3 | 9.5 | 13.6 | |||
| Unemployed | ||||||||||
| Male | * | * | * | * | * | * | * | |||
| Female | [3.3] | [3.3] | * | * | * | * | * | |||
| Total | [3.8] | [3.7] | * | * | * | * | * | |||
| Not in the labour force | ||||||||||
| Male | * | * | * | * | * | * | * | |||
| Female | 8.0 | 6.9 | 7.6 | 5.7 | 7.5 | 8.4 | 7.0 | |||
| Total | 8.9 | 8.0 | 8.7 | 6.7 | 8.9 | 10.1 | 7.4 | |||
| Total | ||||||||||
| Male | [2.5] | [2.7] | [3.3] | [2.9] | [3.6] | * | * | |||
| Female | 18.4 | 18.0 | 16.7 | 16.2 | 15.8 | 19.1 | 19.3 | |||
| Total | 20.8 | 20.7 | 20.0 | 19.1 | 19.4 | 22.0 | 21.5 | |||
| All family units | ||||||||||
| In employment | ||||||||||
| Male | 75.8 | 75.1 | 75.0 | 82.0 | 81.0 | 78.6 | 84.1 | |||
| Female | 63.8 | 66.2 | 63.7 | 68.4 | 70.1 | 70.4 | 69.4 | |||
| Total | 139.6 | 141.3 | 138.6 | 150.4 | 151.1 | 149.0 | 153.4 | |||
| Unemployed | ||||||||||
| Male | 12.8 | 11.9 | 8.6 | 7.8 | 6.3 | [4.9] | * | |||
| Female | 10.8 | 12.1 | 9.3 | 9.4 | [6.8] | [4.7] | * | |||
| Total | 23.6 | 24.0 | 17.9 | 17.3 | 13.0 | 9.6 | [5.7] | |||
| Not in the labour force | ||||||||||
| Male | 27.2 | 30.1 | 28.9 | 28.8 | 28.0 | 27.5 | 26.5 | |||
| Female | 50.5 | 46.1 | 51.1 | 48.4 | 51.6 | 51.5 | 53.7 | |||
| Total | 77.7 | 76.2 | 80.0 | 77.1 | 79.7 | 79.0 | 80.2 | |||
| Total | ||||||||||
| Male | 115.8 | 117.1 | 112.5 | 118.6 | 115.3 | 111.0 | 113.3 | |||
| Female | 125.1 | 124.5 | 124.1 | 126.2 | 128.5 | 126.6 | 126.0 | |||
| Total | 240.9 | 241.5 | 236.5 | 244.7 | 243.8 | 237.6 | 239.3 | |||
| South-East | ||||||||||
| Couple without children | ||||||||||
| In employment | ||||||||||
| Male | 17.0 | 17.7 | 16.7 | 17.8 | 18.7 | 19.5 | 19.2 | |||
| Female | 14.6 | 16.6 | 15.9 | 14.9 | 14.2 | 19.1 | 16.2 | |||
| Total | 31.7 | 34.4 | 32.6 | 32.7 | 33.0 | 38.6 | 35.5 | |||
| Unemployed | ||||||||||
| Male | * | [2.2] | * | * | * | * | * | |||
| Female | * | * | * | * | * | * | * | |||
| Total | [2.4] | 3.7 | [2.4] | [2.7] | * | * | * | |||
| Not in the labour force | ||||||||||
| Male | 16.7 | 18.2 | 18.1 | 16.9 | 17.1 | 20.1 | 18.3 | |||
| Female | 18.8 | 21.6 | 19.6 | 19.7 | 18.4 | 23.2 | 21.5 | |||
| Total | 35.5 | 39.8 | 37.7 | 36.6 | 35.6 | 43.3 | 39.7 | |||
| Total | ||||||||||
| Male | 35.1 | 38.2 | 36.4 | 36.5 | 37.1 | 40.2 | 38.3 | |||
| Female | 34.4 | 39.7 | 36.3 | 35.5 | 33.6 | 42.5 | 38.2 | |||
| Total | 69.5 | 77.9 | 72.7 | 72.0 | 70.8 | 82.7 | 76.6 | |||
| Couple with children | ||||||||||
| In employment | ||||||||||
| Male | 45.8 | 43.4 | 46.4 | 47.3 | 49.5 | 49.8 | 48.5 | |||
| Female | 34.2 | 32.2 | 37.2 | 37.9 | 36.0 | 37.6 | 36.6 | |||
| Total | 80.0 | 75.6 | 83.6 | 85.2 | 85.6 | 87.3 | 85.2 | |||
| Unemployed | ||||||||||
| Male | 8.0 | 6.5 | 5.6 | 4.9 | [3.7] | * | * | |||
| Female | 4.7 | 4.5 | * | * | * | * | * | |||
| Total | 12.6 | 11.0 | 7.5 | 6.8 | 6.2 | [3.4] | * | |||
| Not in the labour force | ||||||||||
| Male | 8.8 | 8.3 | 9.1 | 5.5 | 7.0 | 8.8 | 7.6 | |||
| Female | 21.6 | 20.2 | 19.6 | 17.1 | 20.5 | 22.3 | 16.5 | |||
| Total | 30.4 | 28.6 | 28.7 | 22.6 | 27.5 | 31.0 | 24.1 | |||
| Total | ||||||||||
| Male | 62.5 | 58.2 | 61.1 | 57.7 | 60.2 | 60.9 | 58.0 | |||
| Female | 60.4 | 56.9 | 58.7 | 56.9 | 59.1 | 60.8 | 54.4 | |||
| Total | 123.0 | 115.1 | 119.8 | 114.6 | 119.3 | 121.7 | 112.4 | |||
| Lone parent | ||||||||||
| In employment | ||||||||||
| Male | * | * | * | * | * | * | * | |||
| Female | 6.4 | 7.2 | 6.9 | 7.2 | 9.9 | 7.8 | 10.3 | |||
| Total | 7.6 | 8.0 | 7.7 | 8.9 | 10.8 | 9.1 | 12.5 | |||
| Unemployed | ||||||||||
| Male | * | * | * | * | * | * | * | |||
| Female | * | * | * | * | * | * | * | |||
| Total | [2.2] | * | * | * | * | * | * | |||
| Not in the labour force | ||||||||||
| Male | * | * | * | * | * | * | * | |||
| Female | 9.8 | 7.6 | 8.3 | 8.5 | 7.0 | 6.3 | 7.7 | |||
| Total | 11.1 | 8.7 | 9.6 | 9.5 | 8.0 | 7.5 | 9.1 | |||
| Total | ||||||||||
| Male | [2.7] | * | * | [2.7] | * | * | * | |||
| Female | 18.1 | 16.3 | 16.5 | 17.3 | 17.5 | 14.8 | 19.6 | |||
| Total | 20.9 | 18.5 | 18.7 | 20.0 | 19.7 | 17.4 | 23.1 | |||
| All family units | ||||||||||
| In employment | ||||||||||
| Male | 64.0 | 62.0 | 63.9 | 66.7 | 69.2 | 70.6 | 70.0 | |||
| Female | 55.2 | 56.0 | 59.9 | 60.1 | 60.2 | 64.4 | 63.2 | |||
| Total | 119.2 | 118.0 | 123.8 | 126.8 | 129.3 | 135.0 | 133.1 | |||
| Unemployed | ||||||||||
| Male | 9.6 | 9.0 | 7.3 | 6.7 | 5.2 | [3.0] | * | |||
| Female | 7.5 | 7.5 | 4.2 | 4.4 | [4.1] | * | * | |||
| Total | 17.2 | 16.5 | 11.5 | 11.1 | 9.3 | 5.0 | [6.0] | |||
| Not in the labour force | ||||||||||
| Male | 26.7 | 27.6 | 28.6 | 23.4 | 25.2 | 30.1 | 27.2 | |||
| Female | 50.3 | 49.4 | 47.5 | 45.3 | 45.9 | 51.7 | 45.7 | |||
| Total | 77.0 | 77.0 | 76.0 | 68.7 | 71.1 | 81.8 | 72.9 | |||
| Total | ||||||||||
| Male | 100.4 | 98.6 | 99.7 | 96.8 | 99.5 | 103.7 | 99.9 | |||
| Female | 113.0 | 112.9 | 111.5 | 109.7 | 110.2 | 118.1 | 112.2 | |||
| Total | 213.4 | 211.5 | 211.3 | 206.5 | 209.8 | 221.8 | 212.1 | |||
| South-West | ||||||||||
| Couple without children | ||||||||||
| In employment | ||||||||||
| Male | 25.1 | 26.0 | 25.9 | 32.3 | 28.0 | 27.8 | 30.8 | |||
| Female | 22.7 | 23.4 | 22.5 | 26.5 | 23.9 | 26.0 | 23.2 | |||
| Total | 47.8 | 49.4 | 48.3 | 58.8 | 51.9 | 53.9 | 54.0 | |||
| Unemployed | ||||||||||
| Male | 3.6 | [2.6] | [3.2] | * | * | * | * | |||
| Female | * | * | * | * | * | * | * | |||
| Total | 5.0 | 4.5 | 5.8 | [4.0] | * | * | * | |||
| Not in the labour force | ||||||||||
| Male | 26.1 | 26.7 | 27.3 | 24.9 | 25.6 | 29.9 | 28.4 | |||
| Female | 28.2 | 29.3 | 27.9 | 28.9 | 29.3 | 33.1 | 34.6 | |||
| Total | 54.3 | 56.0 | 55.2 | 53.8 | 54.8 | 63.0 | 63.1 | |||
| Total | ||||||||||
| Male | 54.7 | 55.4 | 56.4 | 59.1 | 54.7 | 59.0 | 60.6 | |||
| Female | 52.5 | 54.6 | 52.9 | 57.6 | 54.0 | 60.1 | 58.8 | |||
| Total | 107.1 | 110.0 | 109.3 | 116.7 | 108.7 | 119.1 | 119.3 | |||
| Couple with children | ||||||||||
| In employment | ||||||||||
| Male | 76.4 | 79.2 | 81.3 | 80.3 | 87.0 | 89.3 | 89.5 | |||
| Female | 56.9 | 58.6 | 59.5 | 58.6 | 61.6 | 63.5 | 66.8 | |||
| Total | 133.4 | 137.8 | 140.8 | 138.9 | 148.5 | 152.8 | 156.3 | |||
| Unemployed | ||||||||||
| Male | 12.1 | 7.7 | 7.3 | 7.5 | [4.9] | * | * | |||
| Female | 5.2 | 4.9 | [4.9] | [4.8] | * | * | * | |||
| Total | 17.4 | 12.6 | 12.2 | 12.2 | 7.6 | [4.4] | [5.7] | |||
| Not in the labour force | ||||||||||
| Male | 12.4 | 11.6 | 11.4 | 10.6 | 12.5 | 10.9 | 10.8 | |||
| Female | 32.2 | 31.9 | 32.1 | 31.2 | 34.6 | 32.9 | 27.3 | |||
| Total | 44.6 | 43.4 | 43.6 | 41.9 | 47.1 | 43.8 | 38.1 | |||
| Total | ||||||||||
| Male | 100.9 | 98.5 | 100.0 | 98.4 | 104.4 | 102.6 | 103.5 | |||
| Female | 94.4 | 95.4 | 96.5 | 94.6 | 98.9 | 98.4 | 96.6 | |||
| Total | 195.3 | 193.9 | 196.6 | 193.0 | 203.2 | 201.0 | 200.1 | |||
| Lone parent | ||||||||||
| In employment | ||||||||||
| Male | * | [2.6] | * | * | * | * | * | |||
| Female | 13.9 | 12.3 | 11.4 | 12.0 | 11.8 | 12.4 | 14.6 | |||
| Total | 15.7 | 14.8 | 13.4 | 13.3 | 13.4 | 13.7 | 17.8 | |||
| Unemployed | ||||||||||
| Male | * | * | * | * | * | * | * | |||
| Female | [3.6] | [3.3] | * | * | * | * | * | |||
| Total | 4.0 | [3.8] | * | [3.0] | * | * | * | |||
| Not in the labour force | ||||||||||
| Male | * | * | * | * | * | * | * | |||
| Female | 11.7 | 11.1 | 12.0 | 11.6 | 12.0 | 10.9 | 11.2 | |||
| Total | 13.2 | 12.6 | 14.1 | 12.9 | 13.7 | 11.8 | 12.1 | |||
| Total | ||||||||||
| Male | 3.6 | 4.5 | 4.7 | [2.9] | [3.5] | * | [4.2] | |||
| Female | 29.3 | 26.7 | 25.9 | 26.3 | 26.4 | 24.2 | 26.9 | |||
| Total | 32.9 | 31.3 | 30.6 | 29.1 | 29.9 | 26.3 | 31.1 | |||
| All family units | ||||||||||
| In employment | ||||||||||
| Male | 103.2 | 107.8 | 109.2 | 113.8 | 116.6 | 118.3 | 123.5 | |||
| Female | 93.6 | 94.3 | 93.4 | 97.1 | 97.3 | 102.0 | 104.7 | |||
| Total | 196.8 | 202.1 | 202.6 | 211.0 | 213.9 | 220.3 | 228.1 | |||
| Unemployed | ||||||||||
| Male | 16.1 | 10.8 | 11.1 | 9.7 | 6.2 | * | [4.7] | |||
| Female | 10.3 | 10.1 | 9.9 | 9.6 | [6.2] | * | * | |||
| Total | 26.4 | 20.9 | 21.0 | 19.3 | 12.3 | 7.6 | 9.1 | |||
| Not in the labour force | ||||||||||
| Male | 39.9 | 39.8 | 40.8 | 36.8 | 39.8 | 41.6 | 40.1 | |||
| Female | 72.2 | 72.3 | 72.0 | 71.8 | 75.9 | 76.9 | 73.1 | |||
| Total | 112.1 | 112.1 | 112.8 | 108.5 | 115.7 | 118.5 | 113.3 | |||
| Total | ||||||||||
| Male | 159.2 | 158.4 | 161.1 | 160.3 | 162.6 | 163.7 | 168.3 | |||
| Female | 176.1 | 176.7 | 175.3 | 178.5 | 179.3 | 182.7 | 182.2 | |||
| Total | 335.3 | 335.1 | 336.5 | 338.8 | 341.9 | 346.4 | 350.5 | |||
| Eastern and Midland | ||||||||||
| Couple without children | ||||||||||
| In employment | ||||||||||
| Male | 92.0 | 93.8 | 101.5 | 97.4 | 104.8 | 100.7 | 117.5 | |||
| Female | 80.9 | 81.7 | 89.4 | 85.5 | 94.9 | 90.0 | 102.9 | |||
| Total | 172.9 | 175.5 | 190.9 | 182.9 | 199.6 | 190.7 | 220.5 | |||
| Unemployed | ||||||||||
| Male | 10.0 | 9.0 | 7.8 | 6.0 | [4.9] | * | * | |||
| Female | 6.8 | [5.3] | [4.7] | [5.7] | [5.9] | * | * | |||
| Total | 16.8 | 14.4 | 12.5 | 11.7 | 10.8 | [5.7] | [8.5] | |||
| Not in the labour force | ||||||||||
| Male | 72.9 | 76.4 | 76.2 | 82.5 | 79.5 | 78.5 | 81.1 | |||
| Female | 84.8 | 88.9 | 84.2 | 88.2 | 86.3 | 84.4 | 93.9 | |||
| Total | 157.7 | 165.4 | 160.4 | 170.8 | 165.9 | 162.9 | 175.0 | |||
| Total | ||||||||||
| Male | 174.9 | 179.3 | 185.5 | 185.9 | 189.1 | 182.1 | 202.1 | |||
| Female | 172.5 | 176.0 | 178.3 | 179.4 | 187.1 | 177.2 | 201.9 | |||
| Total | 347.4 | 355.3 | 363.7 | 365.3 | 376.3 | 359.3 | 404.0 | |||
| Couple with children | ||||||||||
| In employment | ||||||||||
| Male | 243.1 | 252.6 | 259.2 | 270.1 | 264.6 | 276.1 | 277.9 | |||
| Female | 177.5 | 182.1 | 182.8 | 188.9 | 191.3 | 203.6 | 212.9 | |||
| Total | 420.6 | 434.7 | 442.0 | 459.0 | 455.9 | 479.7 | 490.8 | |||
| Unemployed | ||||||||||
| Male | 36.0 | 34.6 | 25.8 | 20.2 | 18.6 | 14.2 | 8.9 | |||
| Female | 21.1 | 23.6 | 17.3 | 14.9 | 14.9 | 7.8 | 9.2 | |||
| Total | 57.1 | 58.2 | 43.1 | 35.1 | 33.5 | 22.0 | 18.1 | |||
| Not in the labour force | ||||||||||
| Male | 48.9 | 43.1 | 41.1 | 42.7 | 40.5 | 45.2 | 37.8 | |||
| Female | 119.8 | 118.5 | 118.0 | 114.4 | 113.0 | 118.1 | 97.7 | |||
| Total | 168.6 | 161.7 | 159.1 | 157.2 | 153.5 | 163.3 | 135.5 | |||
| Total | ||||||||||
| Male | 327.9 | 330.3 | 326.1 | 333.0 | 323.7 | 335.6 | 324.6 | |||
| Female | 318.4 | 324.3 | 318.1 | 318.3 | 319.2 | 329.5 | 319.8 | |||
| Total | 646.3 | 654.6 | 644.2 | 651.2 | 642.9 | 665.1 | 644.4 | |||
| Lone parent | ||||||||||
| In employment | ||||||||||
| Male | 4.7 | 5.5 | 5.6 | 5.8 | 6.9 | 7.7 | 13.4 | |||
| Female | 44.3 | 43.5 | 41.9 | 44.2 | 46.9 | 52.1 | 53.6 | |||
| Total | 49.0 | 49.0 | 47.5 | 50.0 | 53.8 | 59.8 | 66.9 | |||
| Unemployed | ||||||||||
| Male | * | * | * | * | * | * | * | |||
| Female | 10.2 | 13.0 | 8.6 | 7.2 | [6.3] | 7.5 | [6.0] | |||
| Total | 11.8 | 14.8 | 10.1 | 8.4 | 7.1 | 8.6 | [6.5] | |||
| Not in the labour force | ||||||||||
| Male | 7.1 | 6.4 | 6.2 | 6.0 | [5.4] | [5.4] | [5.2] | |||
| Female | 47.9 | 40.6 | 42.7 | 46.2 | 44.8 | 47.3 | 42.7 | |||
| Total | 55.0 | 47.0 | 48.9 | 52.2 | 50.2 | 52.7 | 47.9 | |||
| Total | ||||||||||
| Male | 13.4 | 13.7 | 13.2 | 13.1 | 13.0 | 14.1 | 19.1 | |||
| Female | 102.4 | 97.0 | 93.2 | 97.6 | 98.0 | 107.0 | 102.2 | |||
| Total | 115.8 | 110.7 | 106.4 | 110.7 | 111.1 | 121.0 | 121.3 | |||
| All family units | ||||||||||
| In employment | ||||||||||
| Male | 339.7 | 351.8 | 366.3 | 373.3 | 376.3 | 384.4 | 408.8 | |||
| Female | 302.7 | 307.3 | 314.0 | 318.6 | 333.1 | 345.7 | 369.4 | |||
| Total | 642.5 | 659.2 | 680.4 | 691.9 | 709.4 | 730.2 | 778.2 | |||
| Unemployed | ||||||||||
| Male | 47.6 | 45.5 | 35.0 | 27.4 | 24.2 | 18.2 | 12.8 | |||
| Female | 38.1 | 41.9 | 30.6 | 27.8 | 27.1 | 18.1 | 20.3 | |||
| Total | 85.7 | 87.4 | 65.6 | 55.2 | 51.3 | 36.3 | 33.1 | |||
| Not in the labour force | ||||||||||
| Male | 128.9 | 126.0 | 123.5 | 131.3 | 125.4 | 129.1 | 124.1 | |||
| Female | 252.4 | 248.0 | 244.9 | 248.9 | 244.2 | 249.9 | 234.3 | |||
| Total | 381.3 | 374.0 | 368.4 | 380.2 | 369.5 | 378.9 | 358.4 | |||
| Total | ||||||||||
| Male | 516.2 | 523.3 | 524.8 | 532.0 | 525.8 | 531.7 | 545.7 | |||
| Female | 593.3 | 597.3 | 589.5 | 595.2 | 604.4 | 613.7 | 624.0 | |||
| Total | 1,109.5 | 1,120.6 | 1,114.3 | 1,127.2 | 1,130.2 | 1,145.4 | 1,169.7 | |||
| Dublin | ||||||||||
| Couple without children | ||||||||||
| In employment | ||||||||||
| Male | 51.7 | 55.9 | 61.3 | 59.1 | 66.3 | 64.6 | 73.4 | |||
| Female | 47.2 | 49.4 | 55.9 | 52.7 | 59.2 | 58.2 | 66.2 | |||
| Total | 98.9 | 105.3 | 117.2 | 111.8 | 125.4 | 122.8 | 139.5 | |||
| Unemployed | ||||||||||
| Male | [4.4] | [4.7] | [3.7] | [3.7] | * | * | * | |||
| Female | * | * | * | * | * | * | * | |||
| Total | 7.2 | 7.6 | 6.1 | 5.9 | [6.2] | * | * | |||
| Not in the labour force | ||||||||||
| Male | 42.1 | 44.6 | 42.7 | 48.7 | 44.5 | 44.7 | 43.5 | |||
| Female | 47.7 | 50.8 | 45.0 | 49.7 | 50.9 | 49.4 | 49.8 | |||
| Total | 89.8 | 95.3 | 87.7 | 98.4 | 95.4 | 94.1 | 93.3 | |||
| Total | ||||||||||
| Male | 98.2 | 105.2 | 107.7 | 111.5 | 113.5 | 111.2 | 119.3 | |||
| Female | 97.7 | 103.0 | 103.2 | 104.6 | 113.5 | 108.9 | 118.3 | |||
| Total | 195.9 | 208.2 | 211.0 | 216.1 | 227.0 | 220.1 | 237.6 | |||
| Couple with children | ||||||||||
| In employment | ||||||||||
| Male | 131.6 | 134.3 | 138.3 | 145.3 | 135.9 | 147.8 | 151.5 | |||
| Female | 98.3 | 100.5 | 98.9 | 101.6 | 105.8 | 109.1 | 118.3 | |||
| Total | 230.0 | 234.7 | 237.2 | 246.9 | 241.7 | 256.8 | 269.9 | |||
| Unemployed | ||||||||||
| Male | 15.8 | 14.8 | 11.2 | 8.9 | 10.1 | 6.4 | * | |||
| Female | 9.4 | 9.8 | 9.2 | 7.9 | [6.8] | [4.5] | * | |||
| Total | 25.2 | 24.6 | 20.4 | 16.8 | 16.9 | 10.9 | [8.1] | |||
| Not in the labour force | ||||||||||
| Male | 28.9 | 25.9 | 25.1 | 25.2 | 21.8 | 24.0 | 21.3 | |||
| Female | 64.6 | 64.6 | 63.4 | 63.2 | 57.2 | 63.4 | 51.5 | |||
| Total | 93.4 | 90.5 | 88.4 | 88.4 | 79.0 | 87.3 | 72.8 | |||
| Total | ||||||||||
| Male | 176.3 | 174.9 | 174.5 | 179.3 | 167.8 | 178.1 | 176.7 | |||
| Female | 172.2 | 174.9 | 171.5 | 172.7 | 169.7 | 177.0 | 174.0 | |||
| Total | 348.6 | 349.8 | 346.0 | 352.0 | 337.5 | 355.0 | 350.7 | |||
| Lone parent | ||||||||||
| In employment | ||||||||||
| Male | [2.8] | [3.7] | [2.9] | [3.3] | [4.8] | [4.5] | [7.7] | |||
| Female | 27.4 | 27.2 | 24.9 | 27.4 | 27.8 | 33.8 | 32.6 | |||
| Total | 30.2 | 30.9 | 27.8 | 30.7 | 32.7 | 38.3 | 40.3 | |||
| Unemployed | ||||||||||
| Male | * | * | * | * | * | * | * | |||
| Female | [4.8] | 7.0 | [4.3] | [3.3] | * | [4.5] | * | |||
| Total | 5.7 | 8.0 | 5.3 | [4.1] | [3.9] | [4.9] | * | |||
| Not in the labour force | ||||||||||
| Male | 5.1 | [4.1] | [4.1] | * | [3.6] | [4.1] | * | |||
| Female | 30.7 | 26.2 | 25.3 | 29.5 | 29.5 | 28.6 | 21.6 | |||
| Total | 35.7 | 30.3 | 29.4 | 32.3 | 33.1 | 32.7 | 24.1 | |||
| Total | ||||||||||
| Male | 8.8 | 8.7 | 8.0 | 6.8 | 8.9 | 9.0 | 10.4 | |||
| Female | 62.9 | 60.4 | 54.6 | 60.2 | 60.8 | 66.9 | 57.4 | |||
| Total | 71.7 | 69.1 | 62.5 | 67.0 | 69.7 | 75.9 | 67.8 | |||
| All family units | ||||||||||
| In employment | ||||||||||
| Male | 186.2 | 193.9 | 202.6 | 207.7 | 207.1 | 216.8 | 232.6 | |||
| Female | 172.9 | 177.1 | 179.7 | 181.6 | 192.8 | 201.1 | 217.1 | |||
| Total | 359.1 | 371.0 | 382.3 | 389.3 | 399.8 | 417.9 | 449.7 | |||
| Unemployed | ||||||||||
| Male | 21.1 | 20.4 | 15.9 | 13.3 | 13.3 | 8.7 | [6.5] | |||
| Female | 17.0 | 19.7 | 15.9 | 13.4 | 13.7 | 10.3 | 9.8 | |||
| Total | 38.0 | 40.1 | 31.7 | 26.7 | 27.0 | 18.9 | 16.2 | |||
| Not in the labour force | ||||||||||
| Male | 76.0 | 74.6 | 71.9 | 76.7 | 69.9 | 72.7 | 67.3 | |||
| Female | 143.0 | 141.6 | 133.7 | 142.4 | 137.6 | 141.4 | 122.8 | |||
| Total | 219.0 | 216.1 | 205.5 | 219.1 | 207.4 | 214.2 | 190.1 | |||
| Total | ||||||||||
| Male | 283.3 | 288.8 | 290.3 | 297.7 | 290.2 | 298.2 | 306.4 | |||
| Female | 332.8 | 338.3 | 329.3 | 337.4 | 344.1 | 352.8 | 349.7 | |||
| Total | 616.1 | 627.2 | 619.5 | 635.1 | 634.2 | 651.0 | 656.1 | |||
| Mid-East | ||||||||||
| Couple without children | ||||||||||
| In employment | ||||||||||
| Male | 29.7 | 26.9 | 27.7 | 25.6 | 28.2 | 26.6 | 31.1 | |||
| Female | 25.4 | 23.3 | 23.7 | 22.2 | 26.8 | 25.0 | 25.2 | |||
| Total | 55.2 | 50.2 | 51.5 | 47.8 | 55.0 | 51.7 | 56.3 | |||
| Unemployed | ||||||||||
| Male | [3.7] | * | * | * | * | * | * | |||
| Female | * | * | * | * | * | * | * | |||
| Total | 6.4 | [3.7] | [5.0] | [4.0] | * | * | * | |||
| Not in the labour force | ||||||||||
| Male | 20.3 | 20.8 | 23.0 | 22.6 | 22.2 | 22.8 | 24.7 | |||
| Female | 24.3 | 24.6 | 26.7 | 24.7 | 22.6 | 22.9 | 29.8 | |||
| Total | 44.7 | 45.4 | 49.7 | 47.2 | 44.8 | 45.7 | 54.5 | |||
| Total | ||||||||||
| Male | 53.8 | 50.1 | 53.6 | 49.4 | 51.7 | 50.3 | 56.6 | |||
| Female | 52.5 | 49.2 | 52.5 | 49.7 | 51.2 | 49.2 | 56.7 | |||
| Total | 106.3 | 99.2 | 106.2 | 99.0 | 102.9 | 99.4 | 113.4 | |||
| Couple with children | ||||||||||
| In employment | ||||||||||
| Male | 82.2 | 87.5 | 87.5 | 91.2 | 93.0 | 92.3 | 92.5 | |||
| Female | 58.0 | 60.1 | 61.8 | 66.4 | 64.7 | 70.6 | 70.6 | |||
| Total | 140.3 | 147.6 | 149.3 | 157.6 | 157.7 | 162.9 | 163.2 | |||
| Unemployed | ||||||||||
| Male | 13.1 | 13.6 | 9.2 | 6.6 | [6.2] | * | * | |||
| Female | 7.5 | 9.9 | [5.4] | [4.7] | [5.9] | * | * | |||
| Total | 20.6 | 23.5 | 14.7 | 11.3 | 12.0 | [7.0] | [6.1] | |||
| Not in the labour force | ||||||||||
| Male | 12.7 | 10.5 | 10.5 | 13.0 | 13.2 | 13.4 | 11.0 | |||
| Female | 35.6 | 36.4 | 35.6 | 33.6 | 36.5 | 36.5 | 32.6 | |||
| Total | 48.3 | 46.9 | 46.1 | 46.6 | 49.7 | 49.8 | 43.6 | |||
| Total | ||||||||||
| Male | 108.1 | 111.6 | 107.2 | 110.8 | 112.3 | 110.1 | 106.8 | |||
| Female | 101.2 | 106.4 | 102.8 | 104.8 | 107.2 | 109.6 | 106.1 | |||
| Total | 209.3 | 218.0 | 210.0 | 215.5 | 219.5 | 219.7 | 212.9 | |||
| Lone parent | ||||||||||
| In employment | ||||||||||
| Male | * | * | * | * | * | * | * | |||
| Female | 12.3 | 12.0 | 12.3 | 13.0 | 13.9 | 11.6 | 15.3 | |||
| Total | 13.6 | 12.8 | 14.3 | 15.2 | 15.0 | 13.5 | 18.5 | |||
| Unemployed | ||||||||||
| Male | * | * | * | * | * | * | * | |||
| Female | [3.9] | [4.6] | * | * | * | * | * | |||
| Total | [4.5] | [5.3] | * | * | * | * | * | |||
| Not in the labour force | ||||||||||
| Male | * | * | * | * | * | * | * | |||
| Female | 11.6 | 9.1 | 11.9 | 11.2 | 10.3 | 13.0 | 13.2 | |||
| Total | 12.9 | 10.4 | 13.3 | 13.1 | 11.4 | 13.8 | 15.3 | |||
| Total | ||||||||||
| Male | [3.2] | [2.8] | [3.8] | [4.3] | * | * | [5.6] | |||
| Female | 27.8 | 25.7 | 26.7 | 27.1 | 25.8 | 26.6 | 29.9 | |||
| Total | 31.0 | 28.5 | 30.4 | 31.4 | 28.4 | 29.6 | 35.4 | |||
| All family units | ||||||||||
| In employment | ||||||||||
| Male | 113.4 | 115.2 | 117.2 | 118.9 | 122.3 | 120.7 | 126.7 | |||
| Female | 95.7 | 95.4 | 97.9 | 101.7 | 105.4 | 107.3 | 111.2 | |||
| Total | 209.1 | 210.6 | 215.1 | 220.6 | 227.7 | 228.0 | 237.9 | |||
| Unemployed | ||||||||||
| Male | 17.4 | 16.7 | 12.6 | 8.2 | 7.7 | [5.7] | [4.5] | |||
| Female | 14.1 | 15.8 | 9.9 | 10.3 | [9.4] | [5.7] | [5.9] | |||
| Total | 31.5 | 32.5 | 22.5 | 18.5 | 17.1 | 11.4 | 10.5 | |||
| Not in the labour force | ||||||||||
| Male | 34.3 | 32.6 | 34.8 | 37.4 | 36.5 | 37.0 | 37.7 | |||
| Female | 71.6 | 70.0 | 74.2 | 69.5 | 69.5 | 72.4 | 75.6 | |||
| Total | 105.9 | 102.6 | 109.0 | 106.9 | 105.9 | 109.4 | 113.4 | |||
| Total | ||||||||||
| Male | 165.1 | 164.5 | 164.6 | 164.5 | 166.5 | 163.4 | 169.0 | |||
| Female | 181.4 | 181.3 | 182.0 | 181.5 | 184.2 | 185.4 | 192.7 | |||
| Total | 346.5 | 345.8 | 346.6 | 346.0 | 350.7 | 348.8 | 361.7 | |||
| Midland | ||||||||||
| Couple without children | ||||||||||
| In employment | ||||||||||
| Male | 10.5 | 11.0 | 12.4 | 12.7 | 10.3 | 9.4 | 13.1 | |||
| Female | 8.3 | 9.0 | 9.8 | 10.6 | 8.9 | 6.8 | 11.5 | |||
| Total | 18.8 | 20.0 | 22.2 | 23.3 | 19.2 | 16.2 | 24.6 | |||
| Unemployed | ||||||||||
| Male | * | * | * | * | * | * | * | |||
| Female | * | * | * | * | * | * | * | |||
| Total | [3.2] | * | * | * | * | * | * | |||
| Not in the labour force | ||||||||||
| Male | 10.5 | 11.1 | 10.5 | 11.3 | 12.8 | 11.0 | 12.9 | |||
| Female | 12.7 | 13.6 | 12.5 | 13.9 | 12.8 | 12.0 | 14.3 | |||
| Total | 23.2 | 24.7 | 23.0 | 25.1 | 25.7 | 23.1 | 27.2 | |||
| Total | ||||||||||
| Male | 22.9 | 24.0 | 24.1 | 25.0 | 24.0 | 20.6 | 26.1 | |||
| Female | 22.3 | 23.8 | 22.6 | 25.2 | 22.4 | 19.1 | 26.8 | |||
| Total | 45.2 | 47.8 | 46.6 | 50.2 | 46.4 | 39.8 | 53.0 | |||
| Couple with children | ||||||||||
| In employment | ||||||||||
| Male | 29.2 | 30.8 | 33.5 | 33.5 | 35.7 | 36.1 | 33.8 | |||
| Female | 21.2 | 21.5 | 22.0 | 20.9 | 20.8 | 23.9 | 23.9 | |||
| Total | 50.3 | 52.3 | 55.5 | 54.5 | 56.5 | 60.0 | 57.8 | |||
| Unemployed | ||||||||||
| Male | 7.0 | 6.3 | 5.4 | [4.7] | * | * | * | |||
| Female | [4.3] | [3.9] | * | * | * | * | * | |||
| Total | 11.3 | 10.1 | 8.1 | 7.0 | [4.5] | * | * | |||
| Not in the labour force | ||||||||||
| Male | 7.3 | 6.7 | 5.6 | [4.6] | [5.5] | 7.9 | [5.5] | |||
| Female | 19.6 | 17.5 | 19.0 | 17.6 | 19.3 | 18.3 | 13.7 | |||
| Total | 26.9 | 24.3 | 24.6 | 22.2 | 24.8 | 26.2 | 19.2 | |||
| Total | ||||||||||
| Male | 43.5 | 43.8 | 44.4 | 42.8 | 43.5 | 47.4 | 41.1 | |||
| Female | 45.0 | 42.9 | 43.8 | 40.8 | 42.4 | 42.9 | 39.8 | |||
| Total | 88.5 | 86.7 | 88.2 | 83.7 | 85.9 | 90.4 | 80.8 | |||
| Lone parent | ||||||||||
| In employment | ||||||||||
| Male | * | * | * | * | * | * | * | |||
| Female | 4.6 | 4.3 | 4.6 | 3.8 | 5.2 | 6.7 | [5.6] | |||
| Total | 5.1 | 5.3 | 5.3 | 4.2 | 6.2 | 8.1 | 8.2 | |||
| Unemployed | ||||||||||
| Male | * | * | * | * | * | * | * | |||
| Female | * | * | * | * | * | * | * | |||
| Total | * | * | * | * | * | * | * | |||
| Not in the labour force | ||||||||||
| Male | * | * | * | * | * | * | * | |||
| Female | 5.6 | 5.3 | 5.5 | 5.4 | 5.0 | 5.7 | 7.9 | |||
| Total | 6.4 | 6.3 | 6.2 | 6.8 | 5.7 | 6.1 | 8.6 | |||
| Total | ||||||||||
| Male | * | * | * | * | * | * | * | |||
| Female | 11.7 | 10.9 | 11.9 | 10.3 | 11.4 | 13.5 | 14.9 | |||
| Total | 13.2 | 13.2 | 13.4 | 12.3 | 13.0 | 15.5 | 18.1 | |||
| All family units | ||||||||||
| In employment | ||||||||||
| Male | 40.2 | 42.7 | 46.6 | 46.6 | 47.0 | 46.9 | 49.5 | |||
| Female | 34.1 | 34.9 | 36.4 | 35.3 | 34.9 | 37.4 | 41.1 | |||
| Total | 74.3 | 77.6 | 83.0 | 82.0 | 81.9 | 84.3 | 90.6 | |||
| Unemployed | ||||||||||
| Male | 9.1 | 8.5 | 6.6 | 6.0 | * | * | * | |||
| Female | 7.1 | 6.4 | [4.8] | [4.1] | * | * | * | |||
| Total | 16.2 | 14.8 | 11.4 | 10.1 | 7.2 | [6.0] | [6.4] | |||
| Not in the labour force | ||||||||||
| Male | 18.6 | 18.8 | 16.8 | 17.2 | 19.0 | 19.4 | 19.0 | |||
| Female | 37.9 | 36.5 | 37.0 | 36.9 | 37.2 | 36.0 | 35.9 | |||
| Total | 56.5 | 55.3 | 53.8 | 54.2 | 56.1 | 55.4 | 54.9 | |||
| Total | ||||||||||
| Male | 67.8 | 70.0 | 69.9 | 69.8 | 69.1 | 70.1 | 70.4 | |||
| Female | 79.0 | 77.7 | 78.3 | 76.3 | 76.1 | 75.5 | 81.5 | |||
| Total | 146.9 | 147.7 | 148.2 | 146.2 | 145.2 | 145.6 | 151.9 | |||
| State | ||||||||||
| Couple without children | ||||||||||
| In employment | ||||||||||
| Male | 191.5 | 193.7 | 198.6 | 202.7 | 211.0 | 208.4 | 228.9 | |||
| Female | 170.4 | 170.5 | 172.0 | 172.8 | 186.6 | 184.2 | 192.1 | |||
| Total | 361.9 | 364.1 | 370.6 | 375.5 | 397.6 | 392.6 | 421.0 | |||
| Unemployed | ||||||||||
| Male | 22.0 | 19.4 | 17.6 | 14.3 | 10.9 | 7.7 | [7.6] | |||
| Female | 15.1 | 13.4 | 11.9 | 11.5 | 11.2 | [7.5] | 8.9 | |||
| Total | 37.1 | 32.7 | 29.5 | 25.8 | 22.1 | 15.2 | 16.5 | |||
| Not in the labour force | ||||||||||
| Male | 167.9 | 172.8 | 174.2 | 175.3 | 175.5 | 183.1 | 183.4 | |||
| Female | 189.1 | 197.5 | 195.2 | 196.0 | 195.9 | 205.9 | 218.0 | |||
| Total | 357.0 | 370.3 | 369.4 | 371.3 | 371.4 | 389.0 | 401.4 | |||
| Total | ||||||||||
| Male | 381.3 | 385.8 | 390.4 | 392.2 | 397.4 | 399.2 | 419.8 | |||
| Female | 374.7 | 381.4 | 379.2 | 380.3 | 393.7 | 397.6 | 419.1 | |||
| Total | 756.1 | 767.2 | 769.6 | 772.6 | 791.2 | 796.8 | 838.9 | |||
| Couple with children | ||||||||||
| In employment | ||||||||||
| Male | 503.7 | 522.3 | 536.5 | 560.2 | 556.9 | 573.4 | 568.8 | |||
| Female | 370.5 | 378.5 | 388.9 | 404.7 | 407.6 | 423.3 | 431.1 | |||
| Total | 874.2 | 900.8 | 925.3 | 964.9 | 964.5 | 996.7 | 999.9 | |||
| Unemployed | ||||||||||
| Male | 80.4 | 68.3 | 54.4 | 46.5 | 38.0 | 27.4 | 20.4 | |||
| Female | 43.6 | 46.8 | 35.6 | 31.1 | 27.8 | 14.2 | 16.9 | |||
| Total | 124.0 | 115.0 | 90.0 | 77.6 | 65.8 | 41.6 | 37.2 | |||
| Not in the labour force | ||||||||||
| Male | 96.4 | 87.7 | 85.4 | 82.5 | 82.8 | 88.9 | 81.5 | |||
| Female | 236.3 | 231.1 | 229.4 | 224.7 | 228.5 | 231.0 | 200.3 | |||
| Total | 332.7 | 318.8 | 314.8 | 307.2 | 311.3 | 319.9 | 281.7 | |||
| Total | ||||||||||
| Male | 680.5 | 678.3 | 676.2 | 689.2 | 677.7 | 689.7 | 670.6 | |||
| Female | 650.4 | 656.3 | 653.9 | 660.5 | 663.9 | 668.5 | 648.3 | |||
| Total | 1,330.9 | 1,334.6 | 1,330.1 | 1,349.7 | 1,341.6 | 1,358.2 | 1,318.9 | |||
| Lone parent | ||||||||||
| In employment | ||||||||||
| Male | 10.3 | 11.7 | 12.2 | 11.7 | 13.4 | 14.5 | 24.4 | |||
| Female | 85.7 | 86.1 | 80.6 | 84.4 | 88.7 | 96.9 | 107.3 | |||
| Total | 95.9 | 97.8 | 92.8 | 96.1 | 102.1 | 111.4 | 131.7 | |||
| Unemployed | ||||||||||
| Male | [3.1] | [3.2] | [3.2] | * | * | * | * | |||
| Female | 22.1 | 24.4 | 17.4 | 16.4 | 13.1 | 13.2 | 10.6 | |||
| Total | 25.2 | 27.6 | 20.5 | 19.0 | 15.2 | 14.5 | 11.7 | |||
| Not in the labour force | ||||||||||
| Male | 13.0 | 11.9 | 13.2 | 12.0 | 11.3 | 10.6 | 9.7 | |||
| Female | 93.0 | 80.6 | 84.6 | 87.3 | 86.3 | 87.9 | 78.0 | |||
| Total | 106.0 | 92.5 | 97.8 | 99.3 | 97.6 | 98.5 | 87.7 | |||
| Total | ||||||||||
| Male | 26.4 | 26.8 | 28.5 | 26.2 | 26.8 | 26.3 | 35.1 | |||
| Female | 200.8 | 191.1 | 182.6 | 188.2 | 188.1 | 198.0 | 195.9 | |||
| Total | 227.2 | 217.9 | 211.1 | 214.4 | 214.9 | 224.3 | 231.0 | |||
| All family units | ||||||||||
| In employment | ||||||||||
| Male | 705.4 | 727.6 | 747.3 | 774.6 | 781.4 | 796.3 | 822.0 | |||
| Female | 626.6 | 635.1 | 641.5 | 661.9 | 682.8 | 704.5 | 730.6 | |||
| Total | 1,332.0 | 1,362.7 | 1,388.8 | 1,436.5 | 1,464.2 | 1,500.7 | 1,552.6 | |||
| Unemployed | ||||||||||
| Male | 105.5 | 90.9 | 75.1 | 63.3 | 51.0 | 36.4 | 29.0 | |||
| Female | 80.9 | 84.5 | 64.9 | 59.1 | 52.1 | 34.9 | 36.4 | |||
| Total | 186.4 | 175.4 | 140.0 | 122.3 | 103.2 | 71.3 | 65.4 | |||
| Not in the labour force | ||||||||||
| Male | 277.4 | 272.4 | 272.8 | 269.8 | 269.6 | 282.7 | 274.5 | |||
| Female | 518.4 | 509.2 | 509.2 | 508.0 | 510.7 | 524.7 | 496.3 | |||
| Total | 795.8 | 781.6 | 782.0 | 777.8 | 780.3 | 807.4 | 770.8 | |||
| Total | ||||||||||
| Male | 1,088.3 | 1,090.9 | 1,095.1 | 1,107.6 | 1,102.0 | 1,115.3 | 1,125.6 | |||
| Female | 1,225.9 | 1,228.8 | 1,215.7 | 1,229.0 | 1,245.7 | 1,264.1 | 1,263.3 | |||
| Total | 2,314.1 | 2,319.8 | 2,310.7 | 2,336.7 | 2,347.7 | 2,379.4 | 2,388.8 | |||
| Note: For the purpose of this table, an adult member of a family unit is either a lone parent or a member of a couple. Never married persons (regardless of age) living with a parent or parents are defined as children provided those persons are themselves not part of a separate family unit. In addition users should note that the grossing factors assigned to each spouse within a family unit may differ. | ||||||||||
| Note: A new Labour Force Survey (LFS) replaced the Quarterly National Household Survey (QNHS) in Q3 2017 and, as a result, care should be taken when comparing data from before and after this period. Please see background notes of the LFS release for additional information. | ||||||||||
| Note: The composition of the NUTS regions changed in 2016 and took effect in the LFS from Q1 2018. Data from Q1 2012 to Q4 2017 has also been revised to reflect these changes. Please see background notes of the Q1 2018 LFS release for additional information. | ||||||||||
| Table 8 Adult members of family units classified by composition of detailed family unit, ILO Economic Status and sex | ||||||||||
| '000 | ||||||||||
| Family unit type/ILO Economic Status/Sex | Q2 12 | Q2 13 | Q2 14 | Q2 15 | Q2 16 | Q2 17 | Q2 18 | |||
| Couple without children | ||||||||||
| At least one partner aged less than 45 | ||||||||||
| In employment | ||||||||||
| Male | 93.6 | 91.4 | 93.4 | 90.6 | 95.3 | 94.3 | 104.1 | |||
| Female | 88.6 | 87.0 | 85.5 | 84.5 | 92.0 | 89.8 | 96.0 | |||
| Total | 182.2 | 178.4 | 178.8 | 175.1 | 187.3 | 184.0 | 200.1 | |||
| Unemployed | ||||||||||
| Male | 11.2 | 8.0 | 6.0 | [4.8] | [4.7] | * | * | |||
| Female | 7.5 | [5.5] | [5.4] | [4.6] | [6.4] | * | * | |||
| Total | 18.7 | 13.5 | 11.4 | 9.3 | 11.1 | [6.7] | [8.2] | |||
| Not in the labour force | ||||||||||
| Male | 5.2 | 5.5 | [3.6] | [4.0] | [5.9] | [5.4] | * | |||
| Female | 8.4 | 7.6 | 6.6 | 7.1 | 6.9 | 8.4 | [6.8] | |||
| Total | 13.6 | 13.1 | 10.2 | 11.1 | 12.7 | 13.8 | 12.6 | |||
| Total | ||||||||||
| Male | 109.9 | 104.9 | 103.0 | 99.4 | 105.9 | 102.7 | 113.0 | |||
| Female | 104.5 | 100.1 | 97.5 | 96.2 | 105.2 | 101.9 | 107.9 | |||
| Total | 214.5 | 205.0 | 200.4 | 195.5 | 211.1 | 204.5 | 220.8 | |||
| Both partners aged 45 to 64 | ||||||||||
| In employment | ||||||||||
| Male | 86.4 | 89.4 | 92.7 | 95.9 | 98.9 | 97.7 | 106.4 | |||
| Female | 76.6 | 77.3 | 79.7 | 80.9 | 85.1 | 85.6 | 86.5 | |||
| Total | 163.1 | 166.7 | 172.3 | 176.8 | 184.1 | 183.3 | 192.9 | |||
| Unemployed | ||||||||||
| Male | 10.7 | 11.1 | 11.4 | 9.5 | 6.1 | [4.6] | [4.5] | |||
| Female | 7.5 | 7.7 | 6.5 | 6.6 | [4.8] | * | * | |||
| Total | 18.2 | 18.8 | 17.9 | 16.1 | 10.9 | 8.3 | 8.3 | |||
| Not in the labour force | ||||||||||
| Male | 62.7 | 59.3 | 61.8 | 58.0 | 58.1 | 55.5 | 52.3 | |||
| Female | 73.9 | 73.1 | 74.9 | 70.1 | 68.2 | 65.9 | 68.7 | |||
| Total | 136.6 | 132.4 | 136.8 | 128.1 | 126.2 | 121.4 | 121.0 | |||
| Total | ||||||||||
| Male | 159.8 | 159.9 | 165.9 | 163.4 | 163.1 | 157.8 | 163.1 | |||
| Female | 158.0 | 158.1 | 161.1 | 157.7 | 158.1 | 155.2 | 159.0 | |||
| Total | 317.8 | 317.9 | 327.0 | 321.1 | 321.2 | 313.0 | 322.1 | |||
| At least one partner aged 65 or more | ||||||||||
| In employment | ||||||||||
| Male | 11.5 | 12.8 | 12.6 | 16.2 | 16.8 | 16.4 | 18.4 | |||
| Female | 5.2 | 6.2 | 6.9 | 7.4 | 9.5 | 8.9 | 9.6 | |||
| Total | 16.6 | 19.0 | 19.5 | 23.6 | 26.3 | 25.3 | 28.0 | |||
| Unemployed | ||||||||||
| Male | * | * | * | * | * | * | * | |||
| Female | * | * | * | * | * | * | * | |||
| Total | * | * | * | * | * | * | * | |||
| Not in the labour force | ||||||||||
| Male | 100.1 | 108.0 | 108.8 | 113.3 | 111.5 | 122.2 | 125.3 | |||
| Female | 106.9 | 116.9 | 113.7 | 118.8 | 120.9 | 131.6 | 142.5 | |||
| Total | 206.9 | 224.8 | 222.5 | 232.1 | 232.5 | 253.8 | 267.8 | |||
| Total | ||||||||||
| Male | 111.6 | 121.0 | 121.5 | 129.4 | 128.5 | 138.7 | 143.7 | |||
| Female | 112.2 | 123.2 | 120.6 | 126.5 | 130.4 | 140.6 | 152.2 | |||
| Total | 223.8 | 244.3 | 242.1 | 255.9 | 258.9 | 279.3 | 295.9 | |||
| Total all couples without children | ||||||||||
| In employment | ||||||||||
| Male | 191.5 | 193.7 | 198.6 | 202.7 | 211.0 | 208.4 | 228.9 | |||
| Female | 170.4 | 170.5 | 172.0 | 172.8 | 186.6 | 184.2 | 192.1 | |||
| Total | 361.9 | 364.1 | 370.6 | 375.5 | 397.6 | 392.6 | 421.0 | |||
| Unemployed | ||||||||||
| Male | 22.0 | 19.4 | 17.6 | 14.3 | 10.9 | 7.7 | [7.6] | |||
| Female | 15.1 | 13.4 | 11.9 | 11.5 | 11.2 | [7.5] | 8.9 | |||
| Total | 37.1 | 32.7 | 29.5 | 25.8 | 22.1 | 15.2 | 16.5 | |||
| Not in the labour force | ||||||||||
| Male | 167.9 | 172.8 | 174.2 | 175.3 | 175.5 | 183.1 | 183.4 | |||
| Female | 189.1 | 197.5 | 195.2 | 196.0 | 195.9 | 205.9 | 218.0 | |||
| Total | 357.0 | 370.3 | 369.4 | 371.3 | 371.4 | 389.0 | 401.4 | |||
| Total | ||||||||||
| Male | 381.3 | 385.8 | 390.4 | 392.2 | 397.4 | 399.2 | 419.8 | |||
| Female | 374.7 | 381.4 | 379.2 | 380.3 | 393.7 | 397.6 | 419.1 | |||
| Total | 756.1 | 767.2 | 769.6 | 772.6 | 791.2 | 796.8 | 838.9 | |||
| Couple with children | ||||||||||
| At least 1 child aged under 5 and no child aged 15 or over | ||||||||||
| In employment | ||||||||||
| Male | 220.4 | 226.1 | 226.5 | 236.0 | 225.3 | 225.7 | 206.9 | |||
| Female | 158.9 | 163.6 | 166.6 | 173.0 | 168.0 | 169.9 | 158.4 | |||
| Total | 379.3 | 389.7 | 393.0 | 409.0 | 393.3 | 395.6 | 365.3 | |||
| Unemployed | ||||||||||
| Male | 37.6 | 32.6 | 22.2 | 17.7 | 14.4 | 11.1 | [7.3] | |||
| Female | 21.7 | 22.2 | 14.6 | 12.2 | 10.9 | [5.0] | [7.6] | |||
| Total | 59.2 | 54.9 | 36.8 | 29.9 | 25.3 | 16.1 | 14.9 | |||
| Not in the labour force | ||||||||||
| Male | 16.4 | 17.4 | 11.7 | 12.6 | 9.6 | 13.8 | 13.7 | |||
| Female | 77.7 | 75.4 | 68.7 | 68.8 | 66.3 | 68.1 | 55.7 | |||
| Total | 94.1 | 92.8 | 80.4 | 81.5 | 75.9 | 81.9 | 69.4 | |||
| Total | ||||||||||
| Male | 274.4 | 276.1 | 260.3 | 266.3 | 249.4 | 250.6 | 227.8 | |||
| Female | 258.3 | 261.3 | 249.9 | 254.0 | 245.1 | 243.0 | 221.8 | |||
| Total | 532.6 | 537.4 | 510.2 | 520.4 | 494.5 | 493.7 | 449.6 | |||
| At least 1 child aged under 5 and at least 1 child aged 15 or over | ||||||||||
| In employment | ||||||||||
| Male | 12.6 | 13.3 | 13.3 | 14.1 | 15.4 | 13.0 | 16.9 | |||
| Female | 6.9 | 7.8 | 6.7 | 7.9 | 9.7 | 8.6 | 9.3 | |||
| Total | 19.5 | 21.1 | 20.0 | 22.0 | 25.1 | 21.6 | 26.2 | |||
| Unemployed | ||||||||||
| Male | 3.7 | [3.7] | [3.9] | * | * | * | * | |||
| Female | * | * | * | * | * | * | * | |||
| Total | 5.4 | 5.0 | 4.8 | [3.5] | * | * | * | |||
| Not in the labour force | ||||||||||
| Male | [2.6] | * | [2.9] | * | * | * | * | |||
| Female | 8.7 | 9.5 | 11.0 | 7.6 | 8.0 | 7.2 | 8.6 | |||
| Total | 11.3 | 11.2 | 13.9 | 9.9 | 9.9 | 9.9 | 10.6 | |||
| Total | ||||||||||
| Male | 18.9 | 18.7 | 20.1 | 18.9 | 19.3 | 17.3 | 20.5 | |||
| Female | 17.4 | 18.6 | 18.7 | 16.5 | 18.6 | 16.8 | 18.8 | |||
| Total | 36.2 | 37.3 | 38.7 | 35.4 | 37.9 | 34.1 | 39.3 | |||
| All children aged 5 to 14 | ||||||||||
| In employment | ||||||||||
| Male | 87.2 | 91.4 | 95.5 | 99.7 | 103.2 | 112.5 | 118.6 | |||
| Female | 67.1 | 65.0 | 71.7 | 72.8 | 79.8 | 84.6 | 89.8 | |||
| Total | 154.3 | 156.4 | 167.1 | 172.5 | 182.9 | 197.1 | 208.4 | |||
| Unemployed | ||||||||||
| Male | 13.8 | 7.7 | 10.0 | 8.9 | 7.3 | [4.3] | * | |||
| Female | 7.9 | 10.0 | 7.0 | 6.6 | [6.4] | * | * | |||
| Total | 21.7 | 17.7 | 17.0 | 15.4 | 13.7 | 7.0 | [7.1] | |||
| Not in the labour force | ||||||||||
| Male | 9.6 | 7.6 | 7.5 | 7.6 | 8.1 | 6.9 | 8.1 | |||
| Female | 30.4 | 28.1 | 31.3 | 32.6 | 31.1 | 32.5 | 30.8 | |||
| Total | 40.1 | 35.8 | 38.8 | 40.2 | 39.2 | 39.5 | 38.9 | |||
| Total | ||||||||||
| Male | 110.6 | 106.7 | 112.9 | 116.2 | 118.6 | 123.7 | 130.5 | |||
| Female | 105.4 | 103.1 | 110.0 | 111.9 | 117.3 | 119.8 | 123.9 | |||
| Total | 216.0 | 209.8 | 222.9 | 228.2 | 235.9 | 243.5 | 254.3 | |||
| No child aged under 5, at least 1 child aged 5 to 14 and at least 1 child aged 15 or over | ||||||||||
| In employment | ||||||||||
| Male | 65.8 | 68.1 | 71.9 | 75.2 | 71.6 | 82.9 | 86.2 | |||
| Female | 45.2 | 45.9 | 48.4 | 51.4 | 48.2 | 55.4 | 61.9 | |||
| Total | 111.0 | 114.0 | 120.3 | 126.6 | 119.8 | 138.2 | 148.1 | |||
| Unemployed | ||||||||||
| Male | 10.4 | 10.3 | 5.8 | 7.9 | 6.1 | [5.6] | * | |||
| Female | 5.7 | 5.8 | [4.8] | [4.9] | [4.2] | * | * | |||
| Total | 16.2 | 16.2 | 10.6 | 12.8 | 10.2 | 8.1 | [6.2] | |||
| Not in the labour force | ||||||||||
| Male | 10.1 | 8.2 | 7.9 | 6.5 | 8.2 | 8.9 | 9.2 | |||
| Female | 31.7 | 31.2 | 29.5 | 30.6 | 30.6 | 33.1 | 29.1 | |||
| Total | 41.8 | 39.5 | 37.4 | 37.1 | 38.8 | 42.0 | 38.3 | |||
| Total | ||||||||||
| Male | 86.3 | 86.6 | 85.7 | 89.6 | 85.9 | 97.3 | 99.3 | |||
| Female | 82.6 | 83.0 | 82.7 | 86.9 | 83.0 | 91.0 | 93.3 | |||
| Total | 168.9 | 169.6 | 168.3 | 176.5 | 168.9 | 188.3 | 192.6 | |||
| All children aged 15 or over | ||||||||||
| In employment | ||||||||||
| Male | 117.6 | 123.4 | 129.3 | 135.2 | 141.5 | 139.3 | 140.3 | |||
| Female | 92.5 | 96.2 | 95.5 | 99.6 | 101.9 | 104.9 | 111.6 | |||
| Total | 210.1 | 219.6 | 224.8 | 234.8 | 243.4 | 244.2 | 251.9 | |||
| Unemployed | ||||||||||
| Male | 15.0 | 13.9 | 12.5 | 9.4 | 8.1 | [4.8] | [3.8] | |||
| Female | 6.5 | 7.4 | 8.3 | 6.5 | [5.6] | * | * | |||
| Total | 21.6 | 21.3 | 20.8 | 16.0 | 13.6 | 7.8 | 6.6 | |||
| Not in the labour force | ||||||||||
| Male | 57.7 | 52.8 | 55.4 | 53.5 | 55.0 | 56.6 | 48.5 | |||
| Female | 87.7 | 86.8 | 88.9 | 85.0 | 92.4 | 90.0 | 76.1 | |||
| Total | 145.4 | 139.6 | 144.3 | 138.5 | 147.5 | 146.6 | 124.6 | |||
| Total | ||||||||||
| Male | 190.4 | 190.1 | 197.3 | 198.1 | 204.6 | 200.7 | 192.6 | |||
| Female | 186.7 | 190.4 | 192.7 | 191.2 | 199.9 | 197.9 | 190.5 | |||
| Total | 377.1 | 380.5 | 390.0 | 389.3 | 404.5 | 398.6 | 383.1 | |||
| Total couples with children | ||||||||||
| In employment | ||||||||||
| Male | 503.7 | 522.3 | 536.5 | 560.2 | 556.9 | 573.4 | 568.8 | |||
| Female | 370.5 | 378.5 | 388.9 | 404.7 | 407.6 | 423.3 | 431.1 | |||
| Total | 874.2 | 900.8 | 925.3 | 964.9 | 964.5 | 996.7 | 999.9 | |||
| Unemployed | ||||||||||
| Male | 80.4 | 68.3 | 54.4 | 46.5 | 38.0 | 27.4 | 20.4 | |||
| Female | 43.6 | 46.8 | 35.6 | 31.1 | 27.8 | 14.2 | 16.9 | |||
| Total | 124.0 | 115.0 | 90.0 | 77.6 | 65.8 | 41.6 | 37.2 | |||
| Not in the labour force | ||||||||||
| Male | 96.4 | 87.7 | 85.4 | 82.5 | 82.8 | 88.9 | 81.5 | |||
| Female | 236.3 | 231.1 | 229.4 | 224.7 | 228.5 | 231.0 | 200.3 | |||
| Total | 332.7 | 318.8 | 314.8 | 307.2 | 311.3 | 319.9 | 281.7 | |||
| Total | ||||||||||
| Male | 680.5 | 678.3 | 676.2 | 689.2 | 677.7 | 689.7 | 670.6 | |||
| Female | 650.4 | 656.3 | 653.9 | 660.5 | 663.9 | 668.5 | 648.3 | |||
| Total | 1,330.9 | 1,334.6 | 1,330.1 | 1,349.7 | 1,341.6 | 1,358.2 | 1,318.9 | |||
| Lone parent | ||||||||||
| At least 1 child aged under 5 and no child aged 15 or over | ||||||||||
| In employment | ||||||||||
| Male | * | * | * | * | * | * | [5.6] | |||
| Female | 21.3 | 21.1 | 18.0 | 19.0 | 18.9 | 16.8 | 24.7 | |||
| Total | 22.2 | 21.7 | 19.4 | 20.3 | 20.3 | 17.7 | 30.3 | |||
| Unemployed | ||||||||||
| Male | * | * | * | * | * | * | * | |||
| Female | 8.3 | 6.5 | [4.9] | [4.5] | [4.3] | [4.2] | * | |||
| Total | 9.7 | 7.3 | [5.3] | [5.0] | [4.5] | [4.2] | * | |||
| Not in the labour force | ||||||||||
| Male | * | * | * | * | * | * | * | |||
| Female | 24.1 | 20.6 | 20.5 | 20.4 | 18.4 | 16.0 | 19.9 | |||
| Total | 24.7 | 21.0 | 21.0 | 20.9 | 18.6 | 16.3 | 20.4 | |||
| Total | ||||||||||
| Male | [2.9] | * | * | * | * | * | [6.2] | |||
| Female | 53.7 | 48.2 | 43.4 | 43.9 | 41.7 | 37.1 | 47.6 | |||
| Total | 56.6 | 49.9 | 45.6 | 46.2 | 43.5 | 38.2 | 53.8 | |||
| At least 1 child aged under 5 and at least 1 child aged 15 or over | ||||||||||
| In employment | ||||||||||
| Male | * | * | * | * | * | * | * | |||
| Female | * | * | * | * | * | * | * | |||
| Total | * | * | * | * | * | * | * | |||
| Unemployed | ||||||||||
| Male | * | * | * | * | * | * | * | |||
| Female | * | * | * | * | * | * | * | |||
| Total | * | * | * | * | * | * | * | |||
| Not in the labour force | ||||||||||
| Male | * | * | * | * | * | * | * | |||
| Female | [2.9] | [2.7] | [3.0] | [2.7] | * | [3.3] | * | |||
| Total | [2.9] | [2.7] | [3.1] | [2.9] | * | [3.3] | * | |||
| Total | ||||||||||
| Male | * | * | * | * | * | * | * | |||
| Female | 5.5 | 4.7 | 4.8 | 5.4 | [4.8] | 5.4 | [5.4] | |||
| Total | 5.5 | 4.9 | 5.1 | 5.8 | [4.9] | 5.6 | [5.9] | |||
| All children aged 5 to 14 | ||||||||||
| In employment | ||||||||||
| Male | * | * | * | * | * | * | [7.4] | |||
| Female | 21.5 | 24.3 | 20.4 | 19.9 | 23.7 | 25.9 | 27.8 | |||
| Total | 23.1 | 26.3 | 22.1 | 21.6 | 25.5 | 28.4 | 35.2 | |||
| Unemployed | ||||||||||
| Male | * | * | * | * | * | * | * | |||
| Female | 6.7 | 8.3 | 5.9 | [4.0] | * | * | * | |||
| Total | 7.2 | 9.1 | 6.8 | 4.9 | [4.2] | * | * | |||
| Not in the labour force | ||||||||||
| Male | * | * | * | * | * | * | * | |||
| Female | 14.2 | 10.5 | 11.4 | 13.0 | 11.1 | 11.9 | 10.7 | |||
| Total | 15.4 | 11.9 | 12.5 | 13.9 | 12.1 | 12.8 | 12.3 | |||
| Total | ||||||||||
| Male | [3.3] | [4.1] | [3.7] | [3.5] | [3.5] | [3.7] | 9.3 | |||
| Female | 42.5 | 43.1 | 37.7 | 36.9 | 38.2 | 41.1 | 41.7 | |||
| Total | 45.7 | 47.3 | 41.4 | 40.4 | 41.7 | 44.8 | 51.0 | |||
| No child aged under 5, at least 1 child aged 5 to 14 and at least 1 child aged 15 or over | ||||||||||
| In employment | ||||||||||
| Male | * | * | * | * | * | * | * | |||
| Female | 9.9 | 9.7 | 8.3 | 10.3 | 9.9 | 12.6 | 12.7 | |||
| Total | 10.8 | 11.0 | 9.1 | 11.3 | 11.6 | 13.7 | 14.4 | |||
| Unemployed | ||||||||||
| Male | * | * | * | * | * | * | * | |||
| Female | * | [3.5] | * | * | * | * | * | |||
| Total | * | [3.7] | * | * | * | * | * | |||
| Not in the labour force | ||||||||||
| Male | * | * | * | * | * | * | * | |||
| Female | 8.5 | 7.5 | 6.8 | 7.0 | 8.6 | 7.8 | [6.8] | |||
| Total | 9.2 | 7.7 | 7.3 | 7.8 | 9.1 | 8.0 | [7.5] | |||
| Total | ||||||||||
| Male | * | * | * | * | * | * | * | |||
| Female | 20.6 | 20.7 | 16.9 | 19.4 | 19.7 | 22.9 | 20.7 | |||
| Total | 22.4 | 22.4 | 18.6 | 21.3 | 21.8 | 24.3 | 23.2 | |||
| All children aged 15 or over | ||||||||||
| In employment | ||||||||||
| Male | 6.7 | 7.7 | 8.2 | 7.6 | 8.4 | 9.8 | 9.2 | |||
| Female | 31.0 | 29.8 | 32.7 | 33.2 | 34.4 | 39.5 | 39.6 | |||
| Total | 37.7 | 37.4 | 40.9 | 40.7 | 42.9 | 49.3 | 48.8 | |||
| Unemployed | ||||||||||
| Male | * | * | * | * | * | * | * | |||
| Female | 4.3 | [5.2] | [4.2] | [5.3] | [3.9] | * | * | |||
| Total | 5.3 | 6.8 | 5.6 | 6.3 | [5.0] | [4.2] | * | |||
| Not in the labour force | ||||||||||
| Male | 10.6 | 9.9 | 11.0 | 9.6 | 9.6 | 9.2 | 6.9 | |||
| Female | 43.2 | 39.4 | 42.9 | 44.2 | 45.4 | 48.8 | 37.7 | |||
| Total | 53.9 | 49.3 | 53.9 | 53.8 | 55.1 | 58.0 | 44.5 | |||
| Total | ||||||||||
| Male | 18.3 | 19.1 | 20.5 | 18.2 | 19.2 | 19.9 | 16.7 | |||
| Female | 78.6 | 74.4 | 79.9 | 82.7 | 83.8 | 91.6 | 80.4 | |||
| Total | 96.9 | 93.5 | 100.3 | 100.9 | 103.0 | 111.5 | 97.1 | |||
| Total lone parents | ||||||||||
| In employment | ||||||||||
| Male | 10.3 | 11.7 | 12.2 | 11.7 | 13.4 | 14.5 | 24.4 | |||
| Female | 85.7 | 86.1 | 80.6 | 84.4 | 88.7 | 96.9 | 107.3 | |||
| Total | 95.9 | 97.8 | 92.8 | 96.1 | 102.1 | 111.4 | 131.7 | |||
| Unemployed | ||||||||||
| Male | [3.1] | [3.2] | [3.2] | * | * | * | * | |||
| Female | 22.1 | 24.4 | 17.4 | 16.4 | 13.1 | 13.2 | 10.6 | |||
| Total | 25.2 | 27.6 | 20.5 | 19.0 | 15.2 | 14.5 | 11.7 | |||
| Not in the labour force | ||||||||||
| Male | 13.0 | 11.9 | 13.2 | 12.0 | 11.3 | 10.6 | 9.7 | |||
| Female | 93.0 | 80.6 | 84.6 | 87.3 | 86.3 | 87.9 | 78.0 | |||
| Total | 106.0 | 92.5 | 97.8 | 99.3 | 97.6 | 98.5 | 87.7 | |||
| Total | ||||||||||
| Male | 26.4 | 26.8 | 28.5 | 26.2 | 26.8 | 26.3 | 35.1 | |||
| Female | 200.8 | 191.1 | 182.6 | 188.2 | 188.1 | 198.0 | 195.9 | |||
| Total | 227.2 | 217.9 | 211.1 | 214.4 | 214.9 | 224.3 | 231.0 | |||
| All family units | ||||||||||
| In employment | ||||||||||
| Male | 705.4 | 727.6 | 747.3 | 774.6 | 781.4 | 796.3 | 822.0 | |||
| Female | 626.6 | 635.1 | 641.5 | 661.9 | 682.8 | 704.5 | 730.6 | |||
| Total | 1,332.0 | 1,362.7 | 1,388.8 | 1,436.5 | 1,464.2 | 1,500.7 | 1,552.6 | |||
| Unemployed | ||||||||||
| Male | 105.5 | 90.9 | 75.1 | 63.3 | 51.0 | 36.4 | 29.0 | |||
| Female | 80.9 | 84.5 | 64.9 | 59.1 | 52.1 | 34.9 | 36.4 | |||
| Total | 186.4 | 175.4 | 140.0 | 122.3 | 103.2 | 71.3 | 65.4 | |||
| Not in the labour force | ||||||||||
| Male | 277.4 | 272.4 | 272.8 | 269.8 | 269.6 | 282.7 | 274.5 | |||
| Female | 518.4 | 509.2 | 509.2 | 508.0 | 510.7 | 524.7 | 496.3 | |||
| Total | 795.8 | 781.6 | 782.0 | 777.8 | 780.3 | 807.4 | 770.8 | |||
| Total | ||||||||||
| Male | 1,088.3 | 1,090.9 | 1,095.1 | 1,107.6 | 1,102.0 | 1,115.3 | 1,125.6 | |||
| Female | 1,225.9 | 1,228.8 | 1,215.7 | 1,229.0 | 1,245.7 | 1,264.1 | 1,263.3 | |||
| Total | 2,314.1 | 2,319.8 | 2,310.7 | 2,336.7 | 2,347.7 | 2,379.4 | 2,388.8 | |||
| Note: For the purpose of this table, an adult member of a family unit is either a lone parent or a member of a couple. Never married persons (regardless of age) living with a parent or parents are defined as children provided those persons are themselves not part of a separate family unit. In addition users should note that the grossing factors assigned to each spouse within a family unit may differ. | ||||||||||
| Note: A new Labour Force Survey (LFS) replaced the Quarterly National Household Survey (QNHS) in Q3 2017 and, as a result, care should be taken when comparing data from before and after this period. Please see background notes of the LFS release for additional information. | ||||||||||
| Table 9 Employment rates of adult members of family units classified by composition of family unit and age of youngest child and employment rates of all other persons1 | |||||||||
| % | |||||||||
| Family unit and non-family unit type/Sex | Q2 12 | Q2 13 | Q2 14 | Q2 15 | Q2 16 | Q2 17 | Q2 18 | ||
| Adult members of family units without children | |||||||||
| Couple without children | |||||||||
| Male | 72.2 | 74.0 | 75.6 | 77.6 | 79.0 | 80.5 | 82.3 | ||
| Female | 64.2 | 64.8 | 65.0 | 66.5 | 69.0 | 69.3 | 69.6 | ||
| Total | 68.1 | 69.2 | 70.1 | 71.9 | 73.7 | 74.7 | 75.7 | ||
| Adult members of family units with children | |||||||||
| Couple with children | |||||||||
| Youngest child aged 0-5 | |||||||||
| Male | 79.5 | 81.2 | 85.6 | 87.7 | 89.6 | 89.1 | 90.2 | ||
| Female | 60.2 | 61.2 | 64.5 | 66.9 | 67.4 | 68.7 | 69.7 | ||
| Total | 70.1 | 71.5 | 75.3 | 77.6 | 78.6 | 79.0 | 80.1 | ||
| Youngest child aged 6-11 | |||||||||
| Male | 78.1 | 83.5 | 84.3 | 85.2 | 86.2 | 89.0 | 89.8 | ||
| Female | 57.9 | 59.0 | 61.4 | 60.4 | 64.1 | 68.2 | 70.2 | ||
| Total | 68.3 | 71.5 | 73.0 | 73.0 | 75.2 | 78.8 | 80.3 | ||
| Youngest child aged 12-17 | |||||||||
| Male | 76.5 | 79.8 | 82.6 | 85.8 | 85.7 | 86.8 | 87.0 | ||
| Female | 64.1 | 62.6 | 63.4 | 66.2 | 64.6 | 64.8 | 70.3 | ||
| Total | 70.3 | 71.2 | 73.1 | 76.2 | 75.3 | 75.9 | 78.8 | ||
| Youngest child aged 18 or greater | |||||||||
| Male | 68.2 | 72.7 | 74.2 | 76.2 | 77.8 | 79.5 | 81.6 | ||
| Female | 51.8 | 52.4 | 52.6 | 55.6 | 54.8 | 58.2 | 63.4 | ||
| Total | 59.7 | 62.1 | 63.0 | 65.6 | 65.9 | 68.5 | 72.0 | ||
| All children | |||||||||
| Male | 76.8 | 80.1 | 82.9 | 84.9 | 86.1 | 87.0 | 88.1 | ||
| Female | 58.8 | 59.4 | 61.5 | 63.2 | 63.8 | 66.0 | 68.7 | ||
| Total | 67.9 | 69.8 | 72.3 | 74.2 | 74.9 | 76.6 | 78.5 | ||
| Lone parent | |||||||||
| Youngest child aged 0-5 | |||||||||
| Male | [34.8] | * | * | * | * | * | [91.9] | ||
| Female | 39.3 | 42.2 | 39.9 | 42.8 | 44.4 | 44.5 | 51.3 | ||
| Total | 39.1 | 42.1 | 40.7 | 43.5 | 45.9 | 45.4 | 55.8 | ||
| Youngest child aged 6-11 | |||||||||
| Male | [47.1] | [55.5] | [46.8] | [37.6] | [60.2] | * | 82.1 | ||
| Female | 46.3 | 51.8 | 51.7 | 51.3 | 56.4 | 59.2 | 64.7 | ||
| Total | 46.4 | 52.1 | 51.3 | 50.1 | 56.8 | 60.2 | 67.7 | ||
| Youngest child aged 12-17 | |||||||||
| Male | 55.2 | 55.9 | 66.6 | [72.7] | [68.6] | [64.7] | [71.3] | ||
| Female | 59.5 | 61.7 | 60.6 | 59.9 | 62.0 | 64.9 | 68.8 | ||
| Total | 59.1 | 60.9 | 61.3 | 61.3 | 62.9 | 64.9 | 69.1 | ||
| Youngest child aged 18 or greater | |||||||||
| Male | 52.2 | 59.5 | 52.6 | 62.0 | 61.7 | 68.9 | 77.1 | ||
| Female | 55.6 | 52.3 | 58.6 | 58.8 | 57.3 | 58.9 | 58.8 | ||
| Total | 55.0 | 53.7 | 57.3 | 59.3 | 58.1 | 60.8 | 61.6 | ||
| All children | |||||||||
| Male | 49.3 | 55.9 | 55.4 | 58.6 | 65.0 | 69.4 | 80.8 | ||
| Female | 48.5 | 50.9 | 51.5 | 52.2 | 54.3 | 56.7 | 60.0 | ||
| Total | 48.6 | 51.4 | 51.9 | 52.9 | 55.4 | 58.0 | 63.0 | ||
| Total of all adult members of family units with children (couples with children and lone parents) | |||||||||
| Youngest child aged 0-5 | |||||||||
| Male | 79.0 | 80.9 | 85.3 | 87.4 | 89.5 | 89.0 | 90.2 | ||
| Female | 56.5 | 58.2 | 60.8 | 63.2 | 63.9 | 65.3 | 66.4 | ||
| Total | 67.0 | 68.9 | 72.3 | 74.7 | 75.9 | 76.5 | 77.5 | ||
| Youngest child aged 6-11 | |||||||||
| Male | 77.5 | 82.9 | 83.4 | 84.0 | 85.6 | 88.8 | 89.4 | ||
| Female | 55.0 | 57.1 | 59.4 | 58.4 | 62.5 | 66.1 | 69.0 | ||
| Total | 65.1 | 68.5 | 70.3 | 70.1 | 72.9 | 76.3 | 78.5 | ||
| Youngest child aged 12-17 | |||||||||
| Male | 75.6 | 78.6 | 82.0 | 85.3 | 85.0 | 86.0 | 86.3 | ||
| Female | 62.9 | 62.4 | 62.7 | 64.7 | 64.0 | 64.8 | 69.9 | ||
| Total | 68.6 | 69.6 | 71.4 | 73.9 | 73.4 | 74.2 | 77.3 | ||
| Youngest child aged 18 or greater | |||||||||
| Male | 67.0 | 71.7 | 72.4 | 75.2 | 76.7 | 78.6 | 81.3 | ||
| Female | 52.7 | 52.4 | 54.0 | 56.4 | 55.4 | 58.4 | 62.1 | ||
| Total | 58.9 | 60.7 | 62.0 | 64.5 | 64.4 | 67.0 | 70.1 | ||
| All children | |||||||||
| Male | 76.0 | 79.4 | 82.1 | 84.2 | 85.5 | 86.6 | 87.8 | ||
| Female | 56.6 | 57.6 | 59.5 | 61.0 | 61.9 | 64.0 | 66.8 | ||
| Total | 65.4 | 67.5 | 69.8 | 71.6 | 72.5 | 74.2 | 76.3 | ||
| Total of all adult members of all family units (couples without children, couples with children and lone parents) | |||||||||
| Male | 75.0 | 78.0 | 80.4 | 82.5 | 83.7 | 85.0 | 86.3 | ||
| Female | 58.4 | 59.3 | 60.9 | 62.3 | 63.6 | 65.3 | 67.5 | ||
| Total | 66.1 | 67.9 | 69.9 | 71.7 | 72.8 | 74.3 | 76.2 | ||
| Other persons | |||||||||
| Child members of family units | |||||||||
| Male | 37.2 | 39.6 | 40.1 | 44.9 | 48.0 | 47.3 | 48.9 | ||
| Female | 39.8 | 40.9 | 39.9 | 43.1 | 49.0 | 47.4 | 44.3 | ||
| Total | 38.3 | 40.1 | 40.0 | 44.1 | 48.4 | 47.3 | 46.9 | ||
| Single person households | |||||||||
| Male | 55.1 | 56.3 | 59.9 | 61.8 | 63.8 | 64.1 | 66.0 | ||
| Female | 65.0 | 64.7 | 62.5 | 65.8 | 65.6 | 65.7 | 67.2 | ||
| Total | 59.7 | 60.0 | 61.1 | 63.7 | 64.6 | 64.8 | 66.5 | ||
| All other persons not otherwise classified | |||||||||
| Male | 64.5 | 65.0 | 66.8 | 68.4 | 67.2 | 71.7 | 73.5 | ||
| Female | 70.8 | 72.0 | 67.9 | 65.2 | 68.5 | 72.5 | 73.7 | ||
| Total | 67.3 | 68.0 | 67.3 | 66.9 | 67.8 | 72.1 | 73.6 | ||
| Total of all other persons | |||||||||
| Male | 46.2 | 48.2 | 49.7 | 52.6 | 54.9 | 55.8 | 56.8 | ||
| Female | 51.7 | 52.2 | 50.7 | 52.2 | 56.3 | 56.3 | 55.4 | ||
| Total | 48.6 | 50.0 | 50.1 | 52.4 | 55.5 | 56.0 | 56.2 | ||
| Total of all persons | |||||||||
| Male | 63.4 | 65.8 | 67.7 | 70.2 | 71.6 | 72.6 | 73.8 | ||
| Female | 56.3 | 57.1 | 57.5 | 59.0 | 61.2 | 62.3 | 63.4 | ||
| Total | 59.8 | 61.4 | 62.6 | 64.6 | 66.3 | 67.4 | 68.5 | ||
| 1Employment rates include persons aged 15-64 only | |||||||||
| Note: For the purpose of this table, an adult member of a family unit is either a lone parent or a member of a couple. Never married persons (regardless of age) living with a parent or parents are defined as children provided those persons are themselves not part of a separate family unit. In addition users should note that the grossing factors assigned to each spouse within a family unit may differ. | |||||||||
| Note: A new Labour Force Survey (LFS) replaced the Quarterly National Household Survey (QNHS) in Q3 2017 and, as a result, care should be taken when comparing data from before and after this period. Please see background notes of the LFS release for additional information. | |||||||||
| Table 10 Employment rates of adult members of family units classified by composition of family unit and number of children and employment rates of all other persons1 | |||||||||
| % | |||||||||
| Family unit and non-family unit type/Sex | Q2 12 | Q2 13 | Q2 14 | Q2 15 | Q2 16 | Q2 17 | Q2 18 | ||
| Adult members of family units without children | |||||||||
| Couple without children | |||||||||
| Male | 72.2 | 74.0 | 75.6 | 77.6 | 79.0 | 80.5 | 82.3 | ||
| Female | 64.2 | 64.8 | 65.0 | 66.5 | 69.0 | 69.3 | 69.6 | ||
| Total | 68.1 | 69.2 | 70.1 | 71.9 | 73.7 | 74.7 | 75.7 | ||
| Adult members of family units with children | |||||||||
| Couple with children | |||||||||
| 1 child | |||||||||
| Male | 74.9 | 78.2 | 82.2 | 82.9 | 83.1 | 85.8 | 86.6 | ||
| Female | 62.2 | 63.2 | 63.6 | 67.0 | 65.8 | 66.5 | 72.3 | ||
| Total | 68.5 | 70.7 | 72.8 | 75.0 | 74.3 | 76.0 | 79.3 | ||
| 2 children | |||||||||
| Male | 78.6 | 82.5 | 84.3 | 86.9 | 88.0 | 88.8 | 89.7 | ||
| Female | 62.9 | 62.7 | 65.2 | 65.5 | 66.7 | 69.2 | 71.1 | ||
| Total | 70.9 | 72.7 | 74.9 | 76.4 | 77.5 | 79.1 | 80.5 | ||
| 3 or more children | |||||||||
| Male | 76.4 | 78.7 | 81.7 | 84.3 | 86.7 | 85.8 | 87.5 | ||
| Female | 49.7 | 50.4 | 54.3 | 56.0 | 57.7 | 60.8 | 62.0 | ||
| Total | 63.5 | 64.9 | 68.2 | 70.5 | 72.2 | 73.5 | 75.0 | ||
| All children | |||||||||
| Male | 76.8 | 80.1 | 82.9 | 84.9 | 86.1 | 87.0 | 88.1 | ||
| Female | 58.8 | 59.4 | 61.5 | 63.2 | 63.8 | 66.0 | 68.7 | ||
| Total | 67.9 | 69.8 | 72.3 | 74.2 | 74.9 | 76.6 | 78.5 | ||
| Lone parent | |||||||||
| 1 child | |||||||||
| Male | 46.2 | 51.9 | 54.2 | 56.9 | 63.4 | 64.9 | 76.7 | ||
| Female | 52.9 | 54.6 | 55.5 | 56.6 | 61.0 | 62.1 | 62.6 | ||
| Total | 52.1 | 54.3 | 55.3 | 56.7 | 61.3 | 62.4 | 64.4 | ||
| 2 children | |||||||||
| Male | 52.4 | 59.7 | 60.9 | 66.7 | 61.3 | [74.7] | 87.2 | ||
| Female | 45.5 | 49.9 | 50.7 | 50.4 | 52.5 | 54.1 | 64.7 | ||
| Total | 46.1 | 50.8 | 51.7 | 51.9 | 53.3 | 56.0 | 68.1 | ||
| 3 or more children | |||||||||
| Male | [59.4] | * | * | [51.1] | * | * | [79.4] | ||
| Female | 40.8 | 40.2 | 39.0 | 42.3 | 37.8 | 45.1 | 42.2 | ||
| Total | 42.0 | 42.4 | 40.1 | 43.2 | 41.4 | 47.2 | 48.7 | ||
| All children | |||||||||
| Male | 49.3 | 55.9 | 55.4 | 58.6 | 65.0 | 69.4 | 80.8 | ||
| Female | 48.5 | 50.9 | 51.5 | 52.2 | 54.3 | 56.7 | 60.0 | ||
| Total | 48.6 | 51.4 | 51.9 | 52.9 | 55.4 | 58.0 | 63.0 | ||
| Total of all adult members of family units with children (couples with children and lone parents) | |||||||||
| 1 child | |||||||||
| Male | 73.3 | 76.8 | 80.5 | 81.7 | 82.0 | 84.6 | 85.9 | ||
| Female | 59.2 | 60.6 | 61.2 | 64.0 | 64.4 | 65.1 | 69.2 | ||
| Total | 65.1 | 67.4 | 69.4 | 71.6 | 71.9 | 73.2 | 76.1 | ||
| 2 children | |||||||||
| Male | 78.1 | 82.1 | 83.9 | 86.5 | 87.4 | 88.5 | 89.6 | ||
| Female | 59.9 | 60.5 | 63.0 | 63.0 | 64.2 | 66.7 | 69.9 | ||
| Total | 68.4 | 70.5 | 72.9 | 74.0 | 74.9 | 76.9 | 79.1 | ||
| 3 or more children | |||||||||
| Male | 76.2 | 78.6 | 81.3 | 83.8 | 86.5 | 85.8 | 87.3 | ||
| Female | 48.4 | 49.1 | 52.4 | 54.3 | 55.2 | 58.6 | 59.4 | ||
| Total | 61.7 | 63.2 | 66.3 | 68.4 | 69.9 | 71.5 | 72.8 | ||
| All children | |||||||||
| Male | 76.0 | 79.4 | 82.1 | 84.2 | 85.5 | 86.6 | 87.8 | ||
| Female | 56.6 | 57.6 | 59.5 | 61.0 | 61.9 | 64.0 | 66.8 | ||
| Total | 65.4 | 67.5 | 69.8 | 71.6 | 72.5 | 74.2 | 76.3 | ||
| Total of all adult members of all family units (couples without children, couples with children and lone parents) | |||||||||
| Male | 75.0 | 78.0 | 80.4 | 82.5 | 83.7 | 85.0 | 86.3 | ||
| Female | 58.4 | 59.3 | 60.9 | 62.3 | 63.6 | 65.3 | 67.5 | ||
| Total | 66.1 | 67.9 | 69.9 | 71.7 | 72.8 | 74.3 | 76.2 | ||
| Other persons | |||||||||
| Child members of family units | |||||||||
| Male | 37.2 | 39.6 | 40.1 | 44.9 | 48.0 | 47.3 | 48.9 | ||
| Female | 39.8 | 40.9 | 39.9 | 43.1 | 49.0 | 47.4 | 44.3 | ||
| Total | 38.3 | 40.1 | 40.0 | 44.1 | 48.4 | 47.3 | 46.9 | ||
| Single person households | |||||||||
| Male | 55.1 | 56.3 | 59.9 | 61.8 | 63.8 | 64.1 | 66.0 | ||
| Female | 65.0 | 64.7 | 62.5 | 65.8 | 65.6 | 65.7 | 67.2 | ||
| Total | 59.7 | 60.0 | 61.1 | 63.7 | 64.6 | 64.8 | 66.5 | ||
| All other persons not otherwise classified | |||||||||
| Male | 64.5 | 65.0 | 66.8 | 68.4 | 67.2 | 71.7 | 73.5 | ||
| Female | 70.8 | 72.0 | 67.9 | 65.2 | 68.5 | 72.5 | 73.7 | ||
| Total | 67.3 | 68.0 | 67.3 | 66.9 | 67.8 | 72.1 | 73.6 | ||
| Total of all other persons | |||||||||
| Male | 46.2 | 48.2 | 49.7 | 52.6 | 54.9 | 55.8 | 56.8 | ||
| Female | 51.7 | 52.2 | 50.7 | 52.2 | 56.3 | 56.3 | 55.4 | ||
| Total | 48.6 | 50.0 | 50.1 | 52.4 | 55.5 | 56.0 | 56.2 | ||
| Total of all persons | |||||||||
| Male | 63.4 | 65.8 | 67.7 | 70.2 | 71.6 | 72.6 | 73.8 | ||
| Female | 56.3 | 57.1 | 57.5 | 59.0 | 61.2 | 62.3 | 63.4 | ||
| Total | 59.8 | 61.4 | 62.6 | 64.6 | 66.3 | 67.4 | 68.5 | ||
| Note: For the purpose of this table, an adult member of a family unit is either a lone parent or a member of a couple. Never married persons (regardless of age) living with a parent or parents are defined as children provided those persons are themselves not part of a separate family unit. In addition users should note that the grossing factors assigned to each spouse within a family unit may differ. | |||||||||
| Note: A new Labour Force Survey (LFS) replaced the Quarterly National Household Survey (QNHS) in Q3 2017 and, as a result, care should be taken when comparing data from before and after this period. Please see background notes of the LFS release for additional information. | |||||||||
| 1Employment rates include persons aged 15-64 only | |||||||||
| Table 11 Unemployment rates of adult members of family units classified by composition of family unit and age of youngest child and unemployment rates of all other persons1 | |||||||||
| % | |||||||||
| Family unit and non-family unit type/Sex | Q2 12 | Q2 13 | Q2 14 | Q2 15 | Q2 16 | Q2 17 | Q2 18 | ||
| Adult members of family units without children | |||||||||
| Couple without children | |||||||||
| Male | 10.4 | 9.2 | 8.2 | 6.7 | 5.0 | 3.6 | 3.3 | ||
| Female | 8.2 | 7.3 | 6.5 | 6.3 | 5.7 | 3.9 | 4.4 | ||
| Total | 9.4 | 8.3 | 7.4 | 6.5 | 5.3 | 3.8 | 3.8 | ||
| Adult members of family units with children | |||||||||
| Couple with children | |||||||||
| Youngest child aged 0-5 | |||||||||
| Male | 15.0 | 13.2 | 9.8 | 7.5 | 6.4 | 5.1 | 3.8 | ||
| Female | 12.4 | 12.1 | 8.3 | 6.8 | 6.2 | 3.3 | 4.8 | ||
| Total | 13.9 | 12.7 | 9.2 | 7.2 | 6.3 | 4.3 | 4.3 | ||
| Youngest child aged 6-11 | |||||||||
| Male | 14.3 | 9.9 | 8.9 | 9.1 | 7.5 | 5.1 | 3.5 | ||
| Female | 12.2 | 12.9 | 9.4 | 9.2 | 8.3 | 3.3 | 3.8 | ||
| Total | 13.4 | 11.1 | 9.1 | 9.2 | 7.9 | 4.3 | 3.6 | ||
| Youngest child aged 12-17 | |||||||||
| Male | 12.5 | 10.6 | 8.6 | 6.9 | 5.5 | 4.0 | 3.2 | ||
| Female | 6.6 | 9.0 | 8.0 | 7.4 | 6.3 | 3.4 | 2.8 | ||
| Total | 10.0 | 9.9 | 8.3 | 7.1 | 5.8 | 3.8 | 3.0 | ||
| Youngest child aged 18 or greater | |||||||||
| Male | 10.7 | 10.1 | 8.7 | 6.8 | 5.7 | 3.2 | 2.7 | ||
| Female | 7.3 | 7.6 | 7.9 | 5.1 | 4.3 | 2.9 | 2.2 | ||
| Total | 9.2 | 9.0 | 8.3 | 6.1 | 5.1 | 3.0 | 2.5 | ||
| All children | |||||||||
| Male | 13.8 | 11.6 | 9.2 | 7.7 | 6.4 | 4.6 | 3.5 | ||
| Female | 10.5 | 11.0 | 8.4 | 7.1 | 6.4 | 3.2 | 3.8 | ||
| Total | 12.4 | 11.3 | 8.9 | 7.4 | 6.4 | 4.0 | 3.6 | ||
| Lone parent | |||||||||
| Youngest child aged 0-5 | |||||||||
| Male | * | * | * | * | * | * | * | ||
| Female | 27.6 | 24.7 | 22.0 | 19.4 | 18.5 | 18.1 | 10.1 | ||
| Total | 29.6 | 25.9 | 22.3 | 19.9 | 18.0 | 17.4 | 8.4 | ||
| Youngest child aged 6-11 | |||||||||
| Male | * | * | * | * | * | * | [3.9] | ||
| Female | 25.3 | 27.5 | 21.9 | 17.4 | 14.6 | 11.1 | 9.2 | ||
| Total | 25.3 | 27.2 | 23.4 | 19.1 | 15.4 | 10.8 | 8.2 | ||
| Youngest child aged 12-17 | |||||||||
| Male | [16.3] | [25] | [18.6] | [8.8] | [10.3] | * | * | ||
| Female | 15.6 | 17.8 | 16.0 | 16.9 | 10.5 | 13.7 | 9.5 | ||
| Total | 15.6 | 18.8 | 16.3 | 16.0 | 10.5 | 13.2 | 9.0 | ||
| Youngest child aged 18 or greater | |||||||||
| Male | 13.4 | 13.8 | 15.7 | 13.4 | 12.1 | 8.9 | 6.6 | ||
| Female | 10.8 | 16.0 | 11.4 | 11.7 | 8.3 | 6.4 | 7.4 | ||
| Total | 11.3 | 15.5 | 12.3 | 12.1 | 9.1 | 7.0 | 7.2 | ||
| All children | |||||||||
| Male | 23.3 | 22.2 | 21.5 | 18.0 | 13.5 | 8.1 | 4.1 | ||
| Female | 20.5 | 22.1 | 17.8 | 16.4 | 13.0 | 12.0 | 9.0 | ||
| Total | 20.8 | 22.1 | 18.3 | 16.6 | 13.0 | 11.5 | 8.2 | ||
| Total of all adult members of family units with children (couples with children and lone parents) | |||||||||
| Youngest child aged 0-5 | |||||||||
| Male | 15.4 | 13.4 | 9.9 | 7.6 | 6.5 | 5.0 | 3.7 | ||
| Female | 14.6 | 13.7 | 9.8 | 8.3 | 7.6 | 4.9 | 5.6 | ||
| Total | 15.0 | 13.5 | 9.9 | 7.9 | 7.0 | 5.0 | 4.6 | ||
| Youngest child aged 6-11 | |||||||||
| Male | 14.4 | 10.1 | 9.5 | 9.6 | 7.8 | 5.1 | 3.5 | ||
| Female | 15.3 | 16.8 | 12.0 | 10.9 | 9.6 | 5.1 | 5.0 | ||
| Total | 14.8 | 13.4 | 10.7 | 10.2 | 8.7 | 5.1 | 4.2 | ||
| Youngest child aged 12-17 | |||||||||
| Male | 12.6 | 11.2 | 8.9 | 7.0 | 5.7 | 4.2 | 3.3 | ||
| Female | 8.9 | 11.3 | 9.9 | 9.7 | 7.3 | 6.3 | 4.5 | ||
| Total | 10.8 | 11.2 | 9.4 | 8.3 | 6.5 | 5.2 | 3.9 | ||
| Youngest child aged 18 or greater | |||||||||
| Male | 10.8 | 10.4 | 9.1 | 7.2 | 6.1 | 3.6 | 3.0 | ||
| Female | 8.2 | 9.8 | 8.8 | 6.9 | 5.4 | 3.9 | 3.7 | ||
| Total | 9.6 | 10.1 | 9.0 | 7.0 | 5.8 | 3.7 | 3.3 | ||
| All children | |||||||||
| Male | 14.0 | 11.8 | 9.5 | 7.9 | 6.6 | 4.7 | 3.5 | ||
| Female | 12.6 | 13.3 | 10.2 | 8.9 | 7.6 | 5.0 | 4.9 | ||
| Total | 13.3 | 12.5 | 9.8 | 8.4 | 7.1 | 4.8 | 4.1 | ||
| Total of all adult members of all family units (couples without children, couples with children and lone parents) | |||||||||
| Male | 13.1 | 11.2 | 9.2 | 7.6 | 6.2 | 4.4 | 3.4 | ||
| Female | 11.4 | 11.8 | 9.2 | 8.2 | 7.1 | 4.7 | 4.8 | ||
| Total | 12.3 | 11.4 | 9.2 | 7.9 | 6.6 | 4.6 | 4.1 | ||
| Other persons | |||||||||
| Child members of family units | |||||||||
| Male | 37.1 | 32.4 | 29.0 | 22.7 | 20.5 | 17.4 | 14.7 | ||
| Female | 23.5 | 24.3 | 22.1 | 17.5 | 14.4 | 12.1 | 12.9 | ||
| Total | 31.7 | 29.0 | 26.1 | 20.6 | 17.9 | 15.1 | 14.0 | ||
| Single person households | |||||||||
| Male | 20.2 | 19.7 | 15.6 | 14.0 | 13.2 | 10.6 | 8.7 | ||
| Female | 10.0 | 10.7 | 13.1 | 9.0 | 7.2 | 8.1 | 5.2 | ||
| Total | 15.4 | 15.7 | 14.4 | 11.7 | 10.5 | 9.5 | 7.2 | ||
| All other persons not otherwise classified | |||||||||
| Male | 18.2 | 15.2 | 14.3 | 10.5 | 10.2 | 8.0 | 7.4 | ||
| Female | 9.0 | 8.0 | 8.0 | 6.8 | 7.1 | 5.3 | 3.1 | ||
| Total | 14.1 | 12.0 | 11.6 | 8.8 | 8.9 | 6.8 | 5.3 | ||
| Total of all other persons | |||||||||
| Male | 28.9 | 25.3 | 22.1 | 18.0 | 16.5 | 13.4 | 11.6 | ||
| Female | 16.2 | 16.8 | 16.0 | 12.8 | 11.0 | 9.4 | 8.3 | ||
| Total | 23.5 | 21.6 | 19.5 | 15.7 | 14.1 | 11.7 | 10.2 | ||
| Total of all persons | |||||||||
| Male | 18.4 | 15.9 | 13.5 | 11.0 | 9.7 | 7.5 | 6.2 | ||
| Female | 12.9 | 13.3 | 11.3 | 9.6 | 8.3 | 6.2 | 5.8 | ||
| Total | 15.9 | 14.7 | 12.5 | 10.4 | 9.1 | 6.9 | 6.0 | ||
| 1Unemployment rates include persons aged 15-74 only | |||||||||
| Note: For the purpose of this table, an adult member of a family unit is either a lone parent or a member of a couple. Never married persons (regardless of age) living with a parent or parents are defined as children provided those persons are themselves not part of a separate family unit. In addition users should note that the grossing factors assigned to each spouse within a family unit may differ. | |||||||||
| Note: A new Labour Force Survey (LFS) replaced the Quarterly National Household Survey (QNHS) in Q3 2017 and, as a result, care should be taken when comparing data from before and after this period. Please see background notes of the LFS release for additional information. | |||||||||
| Table 12 Unemployment rates of adult members of family units classified by composition of family unit and number of children and unemployment rates of all other persons1 | |||||||||
| % | |||||||||
| Family unit and non-family unit type/Sex | Q2 12 | Q2 13 | Q2 14 | Q2 15 | Q2 16 | Q2 17 | Q2 18 | ||
| Adult members of family units without children | |||||||||
| Couple without children | |||||||||
| Male | 10.4 | 9.2 | 8.2 | 6.7 | 5.0 | 3.6 | 3.3 | ||
| Female | 8.2 | 7.3 | 6.5 | 6.3 | 5.7 | 3.9 | 4.4 | ||
| Total | 9.4 | 8.3 | 7.4 | 6.5 | 5.3 | 3.8 | 3.8 | ||
| Adult members of family units with children | |||||||||
| Couple with children | |||||||||
| 1 child | |||||||||
| Male | 13.0 | 11.2 | 8.7 | 8.0 | 6.7 | 4.0 | 2.6 | ||
| Female | 10.3 | 11.6 | 7.9 | 6.8 | 6.0 | 3.6 | 3.2 | ||
| Total | 11.8 | 11.4 | 8.4 | 7.5 | 6.4 | 3.8 | 2.9 | ||
| 2 children | |||||||||
| Male | 13.3 | 11.1 | 8.5 | 6.3 | 6.2 | 4.4 | 2.9 | ||
| Female | 10.2 | 9.8 | 8.4 | 7.0 | 6.3 | 3.3 | 4.0 | ||
| Total | 12.0 | 10.6 | 8.5 | 6.6 | 6.2 | 3.9 | 3.4 | ||
| 3 or more children | |||||||||
| Male | 15.2 | 12.6 | 10.7 | 9.2 | 6.4 | 5.4 | 5.0 | ||
| Female | 11.4 | 12.2 | 9.0 | 7.9 | 7.0 | 2.7 | 4.2 | ||
| Total | 13.8 | 12.5 | 10.0 | 8.7 | 6.6 | 4.3 | 4.7 | ||
| All children | |||||||||
| Male | 13.8 | 11.6 | 9.2 | 7.7 | 6.4 | 4.6 | 3.5 | ||
| Female | 10.5 | 11.0 | 8.4 | 7.1 | 6.4 | 3.2 | 3.8 | ||
| Total | 12.4 | 11.3 | 8.9 | 7.4 | 6.4 | 4.0 | 3.6 | ||
| Lone parent household | |||||||||
| 1 child | |||||||||
| Male | 27.4 | 26.1 | 24.8 | 24.4 | 14.4 | 11.6 | 7.8 | ||
| Female | 21.4 | 21.1 | 17.6 | 16.2 | 10.2 | 11.0 | 8.2 | ||
| Total | 22.1 | 21.7 | 18.6 | 17.3 | 10.8 | 11.1 | 8.2 | ||
| 2 children | |||||||||
| Male | [19.4] | [16.4] | [8.5] | [7.7] | [18.2] | [2.7] | * | ||
| Female | 19.8 | 21.8 | 18.2 | 17.2 | 18.7 | 13.8 | 8.7 | ||
| Total | 19.8 | 21.2 | 17.1 | 16.2 | 18.6 | 12.6 | 7.2 | ||
| 3 or more children | |||||||||
| Male | * | * | * | * | * | * | [2.7] | ||
| Female | 18.6 | 26.8 | 18.3 | 15.0 | 9.2 | 12.1 | 13.6 | ||
| Total | 17.8 | 25.5 | 19.4 | 14.4 | 7.8 | 11 | 10.8 | ||
| All children | |||||||||
| Male | 23.3 | 22.2 | 21.5 | 18.0 | 13.5 | 8.1 | 4.1 | ||
| Female | 20.5 | 22.1 | 17.8 | 16.4 | 13.0 | 12.0 | 9.0 | ||
| Total | 20.8 | 22.1 | 18.3 | 16.6 | 13.0 | 11.5 | 8.2 | ||
| Total of all adult members of family units with children (couples with children and lone parents) | |||||||||
| 1 child | |||||||||
| Male | 13.6 | 11.9 | 9.5 | 8.7 | 7.0 | 4.4 | 2.9 | ||
| Female | 13.7 | 14.4 | 10.8 | 9.4 | 7.2 | 6.0 | 4.7 | ||
| Total | 13.7 | 13.2 | 10.2 | 9.1 | 7.1 | 5.2 | 3.9 | ||
| 2 children | |||||||||
| Male | 13.4 | 11.2 | 8.5 | 6.3 | 6.4 | 4.4 | 2.8 | ||
| Female | 11.6 | 11.7 | 9.7 | 8.5 | 8.3 | 4.8 | 4.8 | ||
| Total | 12.6 | 11.4 | 9.1 | 7.3 | 7.3 | 4.6 | 3.8 | ||
| 3 or more children | |||||||||
| Male | 15.2 | 12.6 | 10.9 | 9.2 | 6.3 | 5.3 | 4.9 | ||
| Female | 12.3 | 14.1 | 9.9 | 8.6 | 7.2 | 3.8 | 5.2 | ||
| Total | 14.0 | 13.2 | 10.5 | 9.0 | 6.7 | 4.7 | 5.0 | ||
| All children | |||||||||
| Male | 14.0 | 11.8 | 9.5 | 7.9 | 6.6 | 4.7 | 3.5 | ||
| Female | 12.6 | 13.3 | 10.2 | 8.9 | 7.6 | 5.0 | 4.9 | ||
| Total | 13.3 | 12.5 | 9.8 | 8.4 | 7.1 | 4.8 | 4.1 | ||
| Total of all adult members of all family units (couples without children, couples with children and lone parents) | |||||||||
| Male | 13.1 | 11.2 | 9.2 | 7.6 | 6.2 | 4.4 | 3.4 | ||
| Female | 11.4 | 11.8 | 9.2 | 8.2 | 7.1 | 4.7 | 4.8 | ||
| Total | 12.3 | 11.4 | 9.2 | 7.9 | 6.6 | 4.6 | 4.1 | ||
| Other persons | |||||||||
| Child members of family units | |||||||||
| Male | 37.1 | 32.4 | 29.0 | 22.7 | 20.5 | 17.4 | 14.7 | ||
| Female | 23.5 | 24.3 | 22.1 | 17.5 | 14.4 | 12.1 | 12.9 | ||
| Total | 31.7 | 29.0 | 26.1 | 20.6 | 17.9 | 15.1 | 14.0 | ||
| Single person households | |||||||||
| Male | 20.2 | 19.7 | 15.6 | 14.0 | 13.2 | 10.6 | 8.7 | ||
| Female | 10.0 | 10.7 | 13.1 | 9.0 | 7.2 | 8.1 | 5.2 | ||
| Total | 15.4 | 15.7 | 14.4 | 11.7 | 10.5 | 9.5 | 7.2 | ||
| All other persons not otherwise classified | |||||||||
| Male | 18.2 | 15.2 | 14.3 | 10.5 | 10.2 | 8.0 | 7.4 | ||
| Female | 9.0 | 8.0 | 8.0 | 6.8 | 7.1 | 5.3 | 3.1 | ||
| Total | 14.1 | 12.0 | 11.6 | 8.8 | 8.9 | 6.8 | 5.3 | ||
| Total of all other persons | |||||||||
| Male | 28.9 | 25.3 | 22.1 | 18.0 | 16.5 | 13.4 | 11.6 | ||
| Female | 16.2 | 16.8 | 16.0 | 12.8 | 11.0 | 9.4 | 8.3 | ||
| Total | 23.5 | 21.6 | 19.5 | 15.7 | 14.1 | 11.7 | 10.2 | ||
| Total of all persons | |||||||||
| Male | 18.4 | 15.9 | 13.5 | 11.0 | 9.7 | 7.5 | 6.2 | ||
| Female | 12.9 | 13.3 | 11.3 | 9.6 | 8.3 | 6.2 | 5.8 | ||
| Total | 15.9 | 14.7 | 12.5 | 10.4 | 9.1 | 6.9 | 6.0 | ||
| ¹ Unemployment rates include persons aged 15-74 only | |||||||||
| Note: For the purpose of this table, an adult member of a family unit is either a lone parent or a member of a couple. Never married persons (regardless of age) living with a parent or parents are defined as children provided those persons are themselves not part of a separate family unit. In addition users should note that the grossing factors assigned to each spouse within a family unit may differ. | |||||||||
| Note: A new Labour Force Survey (LFS) replaced the Quarterly National Household Survey (QNHS) in Q3 2017 and, as a result, care should be taken when comparing data from before and after this period. Please see background notes of the LFS release for additional information. | |||||||||
| Table 13 Participation rates of adult members of family units classified by composition of family unit and age of youngest child and participation rates of all other persons | |||||||||
| % | |||||||||
| Family unit and non-family unit type/Sex | Q2 12 | Q2 13 | Q2 14 | Q2 15 | Q2 16 | Q2 17 | Q2 18 | ||
| Adult members of family units without children | |||||||||
| Couple without children | |||||||||
| Male | 56.0 | 55.2 | 55.4 | 55.3 | 55.9 | 54.1 | 56.3 | ||
| Female | 49.5 | 48.2 | 48.5 | 48.5 | 50.2 | 48.2 | 48.0 | ||
| Total | 52.8 | 51.7 | 52.0 | 51.9 | 53.1 | 51.2 | 52.2 | ||
| Adult members of family units with children | |||||||||
| Couple with children | |||||||||
| Youngest child aged 0-5 | |||||||||
| Male | 93.5 | 93.5 | 94.8 | 94.8 | 95.7 | 93.8 | 93.7 | ||
| Female | 68.7 | 69.6 | 70.3 | 71.7 | 71.8 | 71.0 | 73.3 | ||
| Total | 81.5 | 81.9 | 82.8 | 83.6 | 83.9 | 82.6 | 83.7 | ||
| Youngest child aged 6-11 | |||||||||
| Male | 90.9 | 92.6 | 92.3 | 93.4 | 93.1 | 93.8 | 92.9 | ||
| Female | 65.9 | 67.7 | 67.7 | 66.5 | 70.0 | 70.5 | 72.9 | ||
| Total | 78.8 | 80.4 | 80.2 | 80.2 | 81.6 | 82.4 | 83.2 | ||
| Youngest child aged 12-17 | |||||||||
| Male | 86.8 | 88.0 | 89.8 | 91.1 | 90.0 | 90.0 | 89.3 | ||
| Female | 68.6 | 68.7 | 68.7 | 71.5 | 68.8 | 67.0 | 72.3 | ||
| Total | 77.8 | 78.4 | 79.4 | 81.5 | 79.6 | 78.7 | 81.0 | ||
| Youngest child aged 18 or greater | |||||||||
| Male | 64.0 | 67.0 | 65.7 | 66.9 | 67.0 | 65.9 | 70.6 | ||
| Female | 47.9 | 49.4 | 48.6 | 50.4 | 48.0 | 49.2 | 55.5 | ||
| Total | 56.0 | 58.2 | 57.2 | 58.7 | 57.6 | 57.6 | 63.0 | ||
| All children | |||||||||
| Male | 85.8 | 87.1 | 87.4 | 88.0 | 87.8 | 87.1 | 87.9 | ||
| Female | 63.7 | 64.8 | 64.9 | 66.0 | 65.6 | 65.4 | 69.1 | ||
| Total | 75.0 | 76.1 | 76.3 | 77.2 | 76.8 | 76.4 | 78.6 | ||
| Lone parent household | |||||||||
| Youngest child aged 0-5 | |||||||||
| Male | [80.4] | * | * | * | * | * | [91.9] | ||
| Female | 54.3 | 56.0 | 51.1 | 53.0 | 54.5 | 54.4 | 57.1 | ||
| Total | 55.6 | 56.9 | 52.4 | 54.1 | 55.9 | 55.1 | 60.9 | ||
| Youngest child aged 6-11 | |||||||||
| Male | [62.5] | [70.9] | [73.9] | [60.8] | [78.0] | * | 85.4 | ||
| Female | 62.0 | 71.5 | 66.2 | 62.1 | 66.1 | 66.6 | 71.3 | ||
| Total | 62.1 | 71.4 | 66.9 | 61.9 | 67.1 | 67.5 | 73.7 | ||
| Youngest child aged 12-17 | |||||||||
| Male | 66.6 | 73.3 | 76.7 | [78.6] | [73.8] | [70.9] | [76.3] | ||
| Female | 70.6 | 75.1 | 71.9 | 72.1 | 69.3 | 75.2 | 76.0 | ||
| Total | 70.2 | 74.9 | 72.5 | 72.8 | 69.9 | 74.8 | 76.0 | ||
| Youngest child aged 18 or greater | |||||||||
| Male | 38.8 | 43.5 | 40.6 | 42.3 | 44.6 | 51.6 | 53.2 | ||
| Female | 38.0 | 39.3 | 39.1 | 39.5 | 40.3 | 39.2 | 46.8 | ||
| Total | 38.2 | 40.2 | 39.4 | 40.0 | 41.1 | 41.7 | 47.9 | ||
| All children | |||||||||
| Male | 50.7 | 55.6 | 53.8 | 54.2 | 57.8 | 59.7 | 72.4 | ||
| Female | 53.7 | 57.8 | 53.7 | 53.6 | 54.1 | 55.6 | 60.2 | ||
| Total | 53.3 | 57.6 | 53.7 | 53.7 | 54.6 | 56.1 | 62.1 | ||
| Total of all adult members of family units with children (couples with children and lone parents) | |||||||||
| Youngest child aged 0-5 | |||||||||
| Male | 93.4 | 93.5 | 94.6 | 94.6 | 95.7 | 93.8 | 93.7 | ||
| Female | 66.1 | 67.5 | 67.4 | 68.8 | 69.2 | 68.7 | 70.3 | ||
| Total | 78.9 | 79.7 | 80.3 | 81.0 | 81.6 | 80.5 | 81.2 | ||
| Youngest child aged 6-11 | |||||||||
| Male | 90.4 | 92.1 | 91.9 | 92.7 | 92.7 | 93.5 | 92.5 | ||
| Female | 65.0 | 68.6 | 67.4 | 65.6 | 69.1 | 69.6 | 72.6 | ||
| Total | 76.3 | 79.0 | 78.5 | 77.9 | 79.8 | 80.4 | 81.9 | ||
| Youngest child aged 12-17 | |||||||||
| Male | 86.0 | 87.3 | 89.3 | 90.6 | 89.3 | 89.3 | 88.7 | ||
| Female | 69.1 | 70.2 | 69.4 | 71.6 | 68.9 | 69.1 | 73.3 | ||
| Total | 76.6 | 77.9 | 78.4 | 80.2 | 78.2 | 78.1 | 80.2 | ||
| Youngest child aged 18 or greater | |||||||||
| Male | 61.4 | 64.6 | 62.8 | 64.5 | 64.9 | 64.4 | 69.0 | ||
| Female | 44.8 | 46.4 | 45.6 | 46.9 | 45.6 | 45.9 | 52.8 | ||
| Total | 52.1 | 54.3 | 53.1 | 54.6 | 53.9 | 53.9 | 59.8 | ||
| All children | |||||||||
| Male | 84.5 | 85.9 | 86.0 | 86.8 | 86.6 | 86.1 | 87.1 | ||
| Female | 61.3 | 63.2 | 62.5 | 63.2 | 63.1 | 63.2 | 67.0 | ||
| Total | 71.8 | 73.5 | 73.2 | 74.0 | 73.7 | 73.6 | 76.2 | ||
| Total of all adult members of all family units (couples without children, couples with children and lone parents) | |||||||||
| Male | 74.5 | 75.0 | 75.1 | 75.6 | 75.5 | 74.7 | 75.6 | ||
| Female | 57.7 | 58.6 | 58.1 | 58.7 | 59.0 | 58.5 | 60.7 | ||
| Total | 65.6 | 66.3 | 66.2 | 66.7 | 66.8 | 66.1 | 67.7 | ||
| Other persons | |||||||||
| Child members of family units | |||||||||
| Male | 59.2 | 58.5 | 56.4 | 58.1 | 60.4 | 57.2 | 57.2 | ||
| Female | 52.0 | 54.0 | 51.2 | 52.2 | 57.2 | 53.9 | 50.8 | ||
| Total | 56.1 | 56.5 | 54.1 | 55.5 | 59.0 | 55.8 | 54.5 | ||
| Single person households | |||||||||
| Male | 51.4 | 52.9 | 52.1 | 52.4 | 52.8 | 51.3 | 51.8 | ||
| Female | 37.0 | 36.8 | 36.4 | 36.4 | 35.6 | 35.9 | 36.4 | ||
| Total | 43.5 | 44.3 | 43.3 | 43.5 | 43.5 | 43.1 | 43.8 | ||
| All other persons not otherwise classified | |||||||||
| Male | 73.2 | 71.3 | 72.6 | 70.5 | 69.5 | 73.0 | 73.7 | ||
| Female | 63.7 | 63.8 | 61.5 | 58.3 | 61.4 | 63.4 | 66.3 | ||
| Total | 68.7 | 67.8 | 67.4 | 64.6 | 65.7 | 68.6 | 69.9 | ||
| Total of all other persons | |||||||||
| Male | 60.2 | 59.7 | 58.9 | 59.1 | 60.1 | 59.1 | 58.2 | ||
| Female | 49.5 | 50.2 | 48.6 | 48.2 | 50.5 | 49.9 | 48.4 | ||
| Total | 55.2 | 55.2 | 54.0 | 53.8 | 55.6 | 54.7 | 53.5 | ||
| Total of all persons | |||||||||
| Male | 69.0 | 69.1 | 68.8 | 69.3 | 69.4 | 68.4 | 68.6 | ||
| Female | 55.0 | 55.8 | 54.8 | 55.0 | 56.1 | 55.5 | 56.4 | ||
| Total | 61.9 | 62.3 | 61.7 | 62.0 | 62.6 | 61.9 | 62.3 | ||
| Note: For the purpose of this table, an adult member of a family unit is either a lone parent or a member of a couple. Never married persons (regardless of age) living with a parent or parents are defined as children provided those persons are themselves not part of a separate family unit. In addition users should note that the grossing factors assigned to each spouse within a family unit may differ. | |||||||||
| Note: A new Labour Force Survey (LFS) replaced the Quarterly National Household Survey (QNHS) in Q3 2017 and, as a result, care should be taken when comparing data from before and after this period. Please see background notes of the LFS release for additional information. | |||||||||
| Table 14 Participation rates of adult members of family units classified by composition of family unit and number of children and participation rates of all other persons | |||||||||
| % | |||||||||
| Family unit and non-family unit type/Sex | Q2 12 | Q2 13 | Q2 14 | Q2 15 | Q2 16 | Q2 17 | Q2 18 | ||
| Adult members of family units without children | |||||||||
| Couple without children | |||||||||
| Male | 56.0 | 55.2 | 55.4 | 55.3 | 55.9 | 54.1 | 56.3 | ||
| Female | 49.5 | 48.2 | 48.5 | 48.5 | 50.2 | 48.2 | 48.0 | ||
| Total | 52.8 | 51.7 | 52.0 | 51.9 | 53.1 | 51.2 | 52.2 | ||
| Adult members of family units with children | |||||||||
| Couple with children | |||||||||
| 1 child | |||||||||
| Male | 78.4 | 80.2 | 81.0 | 81.1 | 79.5 | 79.4 | 80.9 | ||
| Female | 63.9 | 66.4 | 63.7 | 66.2 | 63.4 | 61.8 | 68.7 | ||
| Total | 71.3 | 73.4 | 72.5 | 73.8 | 71.5 | 70.7 | 74.8 | ||
| 2 children | |||||||||
| Male | 89.7 | 91.3 | 90.6 | 90.9 | 91.9 | 91.0 | 90.9 | ||
| Female | 69.3 | 68.8 | 70.2 | 69.8 | 70.3 | 70.5 | 73.0 | ||
| Total | 79.7 | 80.2 | 80.6 | 80.6 | 81.3 | 81.0 | 82.1 | ||
| 3 or more children | |||||||||
| Male | 89.3 | 89.6 | 90.6 | 92.3 | 92.3 | 90.4 | 91.5 | ||
| Female | 55.9 | 57.2 | 59.3 | 60.6 | 62.0 | 62.4 | 64.5 | ||
| Total | 73.1 | 73.8 | 75.2 | 76.8 | 77.2 | 76.7 | 78.3 | ||
| All children | |||||||||
| Male | 85.8 | 87.1 | 87.4 | 88.0 | 87.8 | 87.1 | 87.9 | ||
| Female | 63.7 | 64.8 | 64.9 | 66.0 | 65.6 | 65.4 | 69.1 | ||
| Total | 75.0 | 76.1 | 76.3 | 77.2 | 76.8 | 76.4 | 78.6 | ||
| Lone parent household | |||||||||
| 1 child | |||||||||
| Male | 47.7 | 50.9 | 52.2 | 51.7 | 53.3 | 55.4 | 64.2 | ||
| Female | 55.0 | 57.4 | 53.7 | 53.0 | 54.0 | 54.6 | 58.9 | ||
| Total | 54.0 | 56.5 | 53.4 | 52.9 | 53.9 | 54.7 | 59.6 | ||
| 2 children | |||||||||
| Male | 54.7 | 60.8 | 54.7 | 60.8 | 61.7 | 66.5 | 80.8 | ||
| Female | 53.5 | 60.5 | 57.8 | 57.1 | 60.9 | 60.6 | 68.4 | ||
| Total | 53.6 | 60.5 | 57.5 | 57.5 | 61.0 | 61.2 | 70.4 | ||
| 3 or more children | |||||||||
| Male | [62.3] | [77.5] | [63.1] | [53.9] | * | * | [81.6] | ||
| Female | 49.4 | 54.4 | 46.1 | 49.2 | 41.0 | 50.3 | 48.4 | ||
| Total | 50.3 | 56.3 | 47.8 | 49.7 | 44.1 | 52.0 | 54.1 | ||
| All children | |||||||||
| Male | 50.7 | 55.6 | 53.8 | 54.2 | 57.8 | 59.7 | 72.4 | ||
| Female | 53.7 | 57.8 | 53.7 | 53.6 | 54.1 | 55.6 | 60.2 | ||
| Total | 53.3 | 57.6 | 53.7 | 53.7 | 54.6 | 56.1 | 62.1 | ||
| Total of all adult members of family units with children (couples with children and lone parents) | |||||||||
| 1 child | |||||||||
| Male | 76.1 | 78.0 | 78.7 | 79.2 | 77.7 | 77.6 | 79.6 | ||
| Female | 60.9 | 63.4 | 60.4 | 61.9 | 60.4 | 59.4 | 65.3 | ||
| Total | 67.3 | 69.6 | 68.2 | 69.3 | 67.8 | 67.0 | 71.4 | ||
| 2 children | |||||||||
| Male | 88.9 | 90.6 | 89.8 | 90.3 | 91.1 | 90.4 | 90.4 | ||
| Female | 66.5 | 67.3 | 68.2 | 67.6 | 68.5 | 68.8 | 72.1 | ||
| Total | 77.0 | 78.2 | 78.4 | 78.2 | 79.1 | 79.0 | 80.7 | ||
| 3 or more children | |||||||||
| Male | 88.9 | 89.4 | 90.2 | 91.6 | 92.1 | 90.3 | 91.2 | ||
| Female | 54.9 | 56.8 | 57.7 | 59.1 | 59.3 | 60.7 | 62.3 | ||
| Total | 71.2 | 72.4 | 73.3 | 74.8 | 74.7 | 74.8 | 76.3 | ||
| All children | |||||||||
| Male | 84.5 | 85.9 | 86.0 | 86.8 | 86.6 | 86.1 | 87.1 | ||
| Female | 61.3 | 63.2 | 62.5 | 63.2 | 63.1 | 63.2 | 67.0 | ||
| Total | 71.8 | 73.5 | 73.2 | 74.0 | 73.7 | 73.6 | 76.2 | ||
| Total of all adult members of all family units (couples without children, couples with children and lone parents) | |||||||||
| Male | 74.5 | 75.0 | 75.1 | 75.6 | 75.5 | 74.7 | 75.6 | ||
| Female | 57.7 | 58.6 | 58.1 | 58.7 | 59.0 | 58.5 | 60.7 | ||
| Total | 65.6 | 66.3 | 66.2 | 66.7 | 66.8 | 66.1 | 67.7 | ||
| Other persons | |||||||||
| Child members of family units | |||||||||
| Male | 59.2 | 58.5 | 56.4 | 58.1 | 60.4 | 57.2 | 57.2 | ||
| Female | 52.0 | 54.0 | 51.2 | 52.2 | 57.2 | 53.9 | 50.8 | ||
| Total | 56.1 | 56.5 | 54.1 | 55.5 | 59.0 | 55.8 | 54.5 | ||
| Single person households | |||||||||
| Male | 51.4 | 52.9 | 52.1 | 52.4 | 52.8 | 51.3 | 51.8 | ||
| Female | 37.0 | 36.8 | 36.4 | 36.4 | 35.6 | 35.9 | 36.4 | ||
| Total | 43.5 | 44.3 | 43.3 | 43.5 | 43.5 | 43.1 | 43.8 | ||
| All other persons not otherwise classified | |||||||||
| Male | 73.2 | 71.3 | 72.6 | 70.5 | 69.5 | 73.0 | 73.7 | ||
| Female | 63.7 | 63.8 | 61.5 | 58.3 | 61.4 | 63.4 | 66.3 | ||
| Total | 68.7 | 67.8 | 67.4 | 64.6 | 65.7 | 68.6 | 69.9 | ||
| Total of all other persons | |||||||||
| Male | 60.2 | 59.7 | 58.9 | 59.1 | 60.1 | 59.1 | 58.2 | ||
| Female | 49.5 | 50.2 | 48.6 | 48.2 | 50.5 | 49.9 | 48.4 | ||
| Total | 55.2 | 55.2 | 54.0 | 53.8 | 55.6 | 54.7 | 53.5 | ||
| Total of all persons | |||||||||
| Male | 69.0 | 69.1 | 68.8 | 69.3 | 69.4 | 68.4 | 68.6 | ||
| Female | 55.0 | 55.8 | 54.8 | 55.0 | 56.1 | 55.5 | 56.4 | ||
| Total | 61.9 | 62.3 | 61.7 | 62.0 | 62.6 | 61.9 | 62.3 | ||
| Note: For the purpose of this table, an adult member of a family unit is either a lone parent or a member of a couple. Never married persons (regardless of age) living with a parent or parents are defined as children provided those persons are themselves not part of a separate family unit. In addition users should note that the grossing factors assigned to each spouse within a family unit may differ. | |||||||||
| Note: A new Labour Force Survey (LFS) replaced the Quarterly National Household Survey (QNHS) in Q3 2017 and, as a result, care should be taken when comparing data from before and after this period. Please see background notes of the LFS release for additional information. | |||||||||
| Table 15 Duration of unemployment of adult members of family units classified by composition of family unit and sex | ||||||||||
| '000 | ||||||||||
| Family unit type/Duration of unemployment/Sex | Q2 12 | Q2 13 | Q2 14 | Q2 15 | Q2 16 | Q2 17 | Q2 18 | |||
| Couple without children | ||||||||||
| Less than 1 year | ||||||||||
| Male | 8.4 | 6.8 | 5.6 | 4.6 | [4.0] | * | * | |||
| Female | 7.3 | 6.4 | 5.9 | [5.0] | [5.4] | * | [6.5] | |||
| Total | 15.7 | 13.2 | 11.5 | 9.6 | 9.3 | 7.5 | 11.4 | |||
| 1 year or over | ||||||||||
| Male | 13.4 | 12.6 | 11.7 | 9.6 | 6.7 | [4.5] | * | |||
| Female | 7.7 | 6.9 | 5.8 | 6.6 | [5.2] | * | * | |||
| Total | 21.1 | 19.4 | 17.5 | 16.1 | 11.9 | 7.3 | [4.8] | |||
| Not stated | ||||||||||
| Male | * | * | * | * | * | * | * | |||
| Female | * | * | * | * | * | * | * | |||
| Total | * | * | * | * | * | * | * | |||
| Total | ||||||||||
| Male | 22.0 | 19.4 | 17.6 | 14.3 | 10.9 | 7.7 | [7.6] | |||
| Female | 15.1 | 13.4 | 11.9 | 11.5 | 11.2 | [7.5] | 8.9 | |||
| Total | 37.1 | 32.7 | 29.5 | 25.8 | 22.1 | 15.2 | 16.5 | |||
| Couple with children | ||||||||||
| Less than 1 year | ||||||||||
| Male | 21.2 | 20.0 | 18.1 | 14.1 | 12.6 | 9.3 | 8.3 | |||
| Female | 19.2 | 22.2 | 16.5 | 15.8 | 17.0 | 8.4 | 11.8 | |||
| Total | 40.4 | 42.2 | 34.6 | 30.0 | 29.6 | 17.7 | 20.1 | |||
| 1 year or over | ||||||||||
| Male | 58.9 | 47.7 | 35.9 | 31.2 | 24.3 | 16.8 | 10.0 | |||
| Female | 23.9 | 24.3 | 19.0 | 15.3 | 10.6 | [5.5] | [4.9] | |||
| Total | 82.9 | 72.0 | 54.8 | 46.5 | 35.0 | 22.3 | 14.9 | |||
| Not stated | ||||||||||
| Male | * | * | * | * | * | * | * | |||
| Female | * | * | * | * | * | * | * | |||
| Total | * | * | * | * | * | * | * | |||
| Total | ||||||||||
| Male | 80.4 | 68.3 | 54.4 | 46.5 | 38.0 | 27.4 | 20.4 | |||
| Female | 43.6 | 46.8 | 35.6 | 31.1 | 27.8 | 14.2 | 16.9 | |||
| Total | 124.0 | 115.0 | 90.0 | 77.6 | 65.8 | 41.6 | 37.2 | |||
| Lone parent | ||||||||||
| Less than 1 year | ||||||||||
| Male | * | * | * | * | * | * | * | |||
| Female | 9.9 | 11.4 | 7.4 | 7.7 | [5.6] | [6.3] | [6.0] | |||
| Total | 11.2 | 11.9 | 8.3 | 8.3 | [6.3] | 6.7 | [6.6] | |||
| 1 year or over | ||||||||||
| Male | * | [2.7] | * | * | * | * | * | |||
| Female | 12.0 | 13.0 | 9.8 | 8.6 | 7.3 | 6.5 | [4.6] | |||
| Total | 13.9 | 15.8 | 11.9 | 10.5 | 8.6 | 7.4 | [5.0] | |||
| Not stated | ||||||||||
| Male | * | * | * | * | * | * | * | |||
| Female | * | * | * | * | * | * | * | |||
| Total | * | * | * | * | * | * | * | |||
| Total | ||||||||||
| Male | [3.1] | [3.2] | [3.2] | * | * | * | * | |||
| Female | 22.1 | 24.4 | 17.4 | 16.4 | 13.1 | 13.2 | 10.6 | |||
| Total | 25.2 | 27.6 | 20.5 | 19.0 | 15.2 | 14.5 | 11.7 | |||
| All family units | ||||||||||
| Less than 1 year | ||||||||||
| Male | 30.8 | 27.3 | 24.6 | 19.4 | 17.2 | 12.8 | 13.8 | |||
| Female | 36.5 | 40.0 | 29.8 | 28.5 | 28.0 | 19.2 | 24.2 | |||
| Total | 67.3 | 67.3 | 54.4 | 47.9 | 45.2 | 31.9 | 38.1 | |||
| 1 year or over | ||||||||||
| Male | 74.2 | 63.0 | 49.7 | 42.6 | 32.3 | 22.2 | 13.0 | |||
| Female | 43.6 | 44.2 | 34.6 | 30.5 | 23.2 | 14.9 | 11.7 | |||
| Total | 117.8 | 107.2 | 84.3 | 73.1 | 55.5 | 37.0 | 24.7 | |||
| Not stated | ||||||||||
| Male | * | * | * | * | * | * | * | |||
| Female | * | * | * | * | * | * | * | |||
| Total | * | * | * | * | * | * | * | |||
| Total | ||||||||||
| Male | 105.5 | 90.9 | 75.1 | 63.3 | 51.0 | 36.4 | 29.0 | |||
| Female | 80.9 | 84.5 | 64.9 | 59.1 | 52.1 | 34.9 | 36.4 | |||
| Total | 186.4 | 175.4 | 140.0 | 122.3 | 103.2 | 71.3 | 65.4 | |||
| Note: For the purpose of this table, an adult member of a family unit is either a lone parent or a member of a couple. Never married persons (regardless of age) living with a parent or parents are defined as children provided those persons are themselves not part of a separate family unit. In addition users should note that the grossing factors assigned to each spouse within a family unit may differ. | ||||||||||
| Note: A new Labour Force Survey (LFS) replaced the Quarterly National Household Survey (QNHS) in Q3 2017 and, as a result, care should be taken when comparing data from before and after this period. Please see background notes of the LFS release for additional information. | ||||||||||
Purpose of Survey
The Labour Force Survey (LFS) replaced the Quarterly National Household Survey (QNHS) at the beginning of Q3 2017. The purpose of the survey is the production of quarterly labour force estimates and occasional reports on special social topics. The survey meets the requirements of Council Regulation (EC) No. 577/98, adopted in March 1998, which required the introduction of quarterly labour force surveys in EU member states.Reference Period
Information is collected continuously throughout the year from households surveyed each week in each quarter. Up to and including the fourth quarter of 2008 the QNHS operated on a seasonal quarter basis since its establishment in Q4 1997. The LFS is undertaken on a calendar quarter basis which was first adopted in the QNHS in the first quarter of 2009.
The reference quarters for survey results are:
Q1 - January to March, Q2 - April to June, Q3 - July to September and Q4 - October to December
Data Collection
The LFS is conducted using mixed mode data collection with the introduction of Computer Assisted Telephone Interviewing (CATI). As with the QNHS, information is collected from each sample household over 5 successive quarters or Waves. However, in the LFS, the first interview is conducted by a team of face-to-face interviewers using Computer Assisted Personal Interviewing (CAPI). The four follow-up interviews are conducted using CATI from a dedicated call centre, where householders have agreed to conduct a telephone interview. Face-to-face interviews where householders have not agreed to conduct a telephone interview.
Sample Design
A new sample based on the 2011 Census of Population was selected for the LFS and this was introduced incrementally from Q1 2016. The sample is stratified using administrative county and the Pobal HP (Haase and Pratschke) Deprivation Index. A two-stage sample design is used. In the first stage, 1,300 blocks are selected using Probability Proportional to Size (PPS) sampling. In the second stage, households are selected using Simple Random Sampling (SRS). This ensures each household in the sample frame has an equal probability of selection.
To account for the additional attrition as a result of the introduction of mixed mode data collection, the LFS sample was incrementally from Q3 2017. An additional 1,300 households were included in Wave 1 for each quarter and this has resulted in a total sample of 31,200 households in Q2 2018. As the sample is being increased by 1,300 households per Wave, the final design sample will increase to 32,500 households by Q3 2018. The actual achieved sample varies over time depending on the level of response.
The number of valid responding households for the LFS in Q2 2018 was 14,071.
Households are asked to take part in the survey for five consecutive quarters and are then replaced by other households in the same block. Thus, one fifth of the households in the survey are replaced each quarter and the QNHS/LFS sample involves an overlap of 80% between consecutive quarters and 20% between the same quarter in consecutive years. It is important to note that there is no overlap in sample between the QNHS and the LFS.
The survey results are weighted to agree with population estimates broken down by age, sex and region (the regions have changed from Q1 2018 – see below) and are also calibrated to nationality control totals. The LFS results also contain a non-response adjustment to make the results from the achieved sample representative of the target sample and the population. The population estimates for April of each year are published in a separate release.
New samples, both based on the 2011 Census of Population, were introduced incrementally for the QNHS in Q4 2012 and in Q3 2016. The former was stratified using administrative county and population density while the latter was stratified using administrative county and the Pobal HP (Haase and Pratschke) Deprivation Index. The quarterly sample in each case was 26,000 households. The actual achieved sample varied over time depending on the level of response.
Estimated number of households
The average grossing factor of all members of a household is used to calculate the number of households. As a result, the number of households should be treated as indicative only.
Family unit coding
For the purpose of the data in this release it can be noted that an adult member of a family unit is either a lone parent or a member of a couple. Never married persons (regardless of age) living with a parent or parents are defined as children provided those persons are themselves not part of a separate family unit. In addition, users should note that the adjustment factors assigned to each spouse within a family unit may differ.
A family unit itself consists of either:
1. a married couple, or
2. a married couple and one or more of their never-married children, or
3. one parent and one or more of his or her never-married children, or
4. a couple living together (with never-married children, if any) who are not married to each other, where it is clear that the couple form a “de facto” family unit.
Households may contain more than one family unit or may contain a family together with other persons not in a family unit as defined above.
Jobless Households
The Labour Force Survey is the official source of data for the jobless household indicator.
The indicator "People aged 18 - 59 years living in jobless households" is calculated as the share of persons aged 18 - 59 who are living in households where no one is in employment. Students aged 18 - 24 who live in households composed solely of students (persons who have indicated that their Principal Economic Status is Student) of the same age class are not included. The indicator "People aged 0 - 17 years living in jobless households" is calculated as the share of persons aged 0 - 17 who are living in households where no one is in employment.
Comparison to Census of Population results
The data in this release is not directly comparable to the results from the Census of Population. Both sources are collected in different ways and this can lead to differences in estimates between the two sources. In addition, as noted above, the LFS is a voluntary sample survey, while the Census of Population is a mandatory survey of the entire population. In addition, the Census of Population is a self-completed paper questionnaire whereas in the LFS, questions are asked using a combination of CAPI and CATI and that may lead to differences in understanding and interpreting the questions.
Usual residence and de facto population concepts
Up to and including Q1 2006 the annual population estimates were calculated using the de facto definition of population (i.e. all persons present in the State). From Q2 2006 onwards a new concept of usual residence has been used, i.e. all persons usually resident and present in the state plus absent persons who are usually resident in Ireland but are temporarily away from home and outside the State. The LFS uses the concept of usual residence.
Households with all persons aged 75 and over and classified as inactive
Households which contain only respondents who are aged 75 or over who are each classified as Inactive (Not in the Labour Force) are not re-interviewed. This is to reduce unnecessary burden and instead answers are copied forward from the last available interview.
Statistical significance
All estimates based on sample surveys are subject to error, some of which is measurable. Where an estimate is statistically significantly different from another estimate it means that we can be 95% confident that differences between those two estimates are not due to sampling error.
ILO Labour Force Classification
The primary classification used for the LFS results is the ILO (International Labour Office) labour force classification. Labour Force Survey data on this basis have been published since 1988. The ILO classification distinguishes the following main subgroups of the population aged 15 or over:
In Employment: Persons who worked in the week before the survey for one hour or more for payment or profit, including work on the family farm or business and all persons who had a job but were not at work because of illness, holidays etc. in the week.
Unemployed: Persons who, in the week before the survey, were without work and available for work within the next two weeks, and had taken specific steps, in the preceding four weeks, to find work. It should be noted that as per Eurostat’s operational implementation, the upper age limit for classifying a person as unemployed is 74 years.
Inactive Population (not in labour force): All other persons.
The labour force comprises persons employed plus unemployed.
Participation, Employment and Unemployment Rates
The rates given in this release are based on the ILO classification. The Participation Rate is the number of persons in the labour force expressed as a percentage of the total population aged 15 or over. The Employment Rate is the number of employed aged 15 to 64 expressed as a percentage of the total population aged 15 to 64.
To ensure coherence with Unemployment Rates produced by Eurostat, the CSO changed the method of calculation of the Unemployment Rate as of Q2 2015. Prior to this, the Unemployment Rate was calculated as the number of unemployed expressed as a percentage of the total labour force aged 15 and over. The change introduced limits the labour force to persons aged 15-74 and this excludes a small number of persons aged 75 and over in employment from the total labour force used in the calculation. The overall impact of this change was minimal.
Duration of Unemployment
The duration of unemployment is the length of time since a person last had a job or began looking for work, whichever is more recent. The long-term unemployment rate is the number of persons unemployed for one year or more expressed as a percentage of the total labour force aged 15 to 74 years.
NUTS2 and NUTS3 Regions
The regional classifications in this release is based on the NUTS (Nomenclature of Territorial Units) classification used by Eurostat. Until Q4 2017, the NUTS3 regions corresponded to the eight Regional Authorities established under the Local Government Act, 1991 (Regional Authorities) (Establishment) Order, 1993, which came into operation on 1 January 1994 while the NUTS2 regions, which were proposed by Government and agreed by Eurostat in 1999, were groupings of those historic NUTS3 regions.
However, the NUTS3 boundaries were amended on 21st of November 2016 under Regulation (EC) No. 2066/2016 and have come into force from Q1 2018. These new groupings are reflected in the LFS results from Q1 2018 onwards. The changes resulting from the amendment are that County Louth has moved from the Border to the Mid-East and what was formerly South Tipperary has moved from the South-East to the Mid-West, resulting in the new NUTS2 and NUTS3 regions:
| Northern & Western NUTS2 Region | Southern NUTS2 Region | Eastern & Midland NUTS2 Region | |||
| Border | Cavan | Mid-West | Clare | Dublin | Dublin City |
| Donegal | Limerick City & County | Dun Laoghaire-Rathdown | |||
| Leitrim | Tipperary | Fingal | |||
| Monaghan | South Dublin | ||||
| Sligo | |||||
| South-East | Carlow | Mid-East | Kildare | ||
| West | Galway City | Kilkenny | Meath | ||
| Galway County | Waterford City & County | Wicklow | |||
| Mayo | Wexford | Louth | |||
| Roscommon | |||||
| Midland | Laois | ||||
| South-West | Cork City | Longford | |||
| Cork County | Offaly | ||||
| Kerry | Westmeath | ||||
Non-response adjustment
Non-response occurs when households that are sampled, and that are eligible for the survey, do not provide the requested information. This can lead to biased survey estimates if specific groups within the population are over- or under-represented and if these groups behave differently with respect to the survey variables (i.e. labour market outcomes). To correct for this, the CSO has introduced a non-response adjustment into the weighting procedure for the LFS.
The adjustment involves estimating response rates or propensities to respond as functions of characteristics available for responding and non-responding households, as well as characteristics of the areas where the households are located. Basically, the design weights have to be inflated by the inverse of the response propensities in order to compensate for the loss of units in the sample.
Linking the LFS sample with the Census of Population at household level provides a set of auxiliary variable which are available for both responding and non-responding LFS households. These include a mix of personal characteristics as well as characteristics of the dwelling and location (e.g. gender, age, marital status, education, personal employment status, dwelling type, area etc.). This allows the CSO to compare responding and non-responding households with respect to the characteristics available from the Census. This auxiliary information allows the use of “response propensities” to model non-response and adjust the grossing factors to compensate for non-response.
The response propensities are calculated using a logistic regression model where the dependent variable (Y) is an indicator variables corresponding to response (if the household responded then Y=1 and if the household did not respond then Y=0) and the independent variables are the set of auxiliary variables available from the Census. The estimated response propensities are then used to form adjustment cells or strata which are made up of respondents and non-respondents with similar estimated response propensities. Respondents within each cell/stratum are then weighted by the inverse of the observed response rate in that cell. This non-response adjusted weight is then used to inflate the original survey design weight to account for non-response. This approach is referred to as response propensity classification.
Back-casting methodology
The introduction of the LFS in Q3 2017 constituted a break in series for the labour market estimates published by the CSO. In an effort to mitigate the effect of the introduction of the LFS on the coherence of the historic data series, a back-casting exercise was carried out to link the QNHS and the LFS. The result of this is that the published QNHS series from Q1 1998 to Q2 2017 has been revised.
As part of the roll-out of the LFS, a parallel run of the two surveys was carried out. This allowed the estimation of the effect of the introduction of the new survey on the various labour market estimates. Quarter 1 of 2017 was used as the reference period to calculate scaling factors which were used to link the results from the two surveys. Labour market estimates were calculated from both surveys for a range of cohorts (age, sex, ILO status etc.) and the ratio of the two estimates provided a scaling factor which was applied to the historic QNHS series to create a back-cast series.
In Q3 2017, separate scaling factors were calculated for ILO status by age and sex together with the fifteen economic sector categories (table 2 of this release) by sex:
In Q1 2018, additional scaling factors were calculated for the eight NUTS3 regions by Labour Force ILO status, occupation categories (table 4 of this release) and highest level of education completed (supplementary table 8 of this release) by sex:
Therefore, adjustments have been made to this historic data to enable comparability with the new LFS for these indicators. However, as a result of changes to the questionnaire, the interview mode, the introduction of a new sample, data processing changes and other methodological enhancements there are changes in the levels of some series from Q3 2017 onwards. As a consequence the series before and after the introduction of the new survey may not be directly comparable and users should therefore note this when examining annual and quarterly changes.
Please refer to the following information notes for further details:
Information Notice, Labour Force Survey, Quarter 3 2017
Information Notice, Labour Force Survey, Quarter 1 2018
Information Notice, Labour Force Survey, Quarter 2 2018
Reliability of Estimates Presented
Estimates for number of persons where there are less than 30 persons in a cell are too small to be considered reliable. These estimates are presented with an asterisk (*) in the relevant tables.
Where there are 30-49 persons in a cell, estimates are considered to have a wider margin of error and should be treated with caution. These cells are presented with parentheses [ ].
In the case of rates, these limits apply to the denominator used in generating the rate. In the case of annual changes, both the current year and the preceding year are taken into account when deciding whether the estimate should be suppressed or flagged as having a wider margin of error.
Calculation of Rates and Estimates of Change
Rates and estimates of change presented in this release are calculated from whole unrounded numbers. Due to rounding, these may differ from the rates and estimates of change calculated from the rounded volumes presented in the tables.
Interpretation of volume and rate changes
The overall change in the number of people employed, unemployed, in the labour force and not in the labour force is a function both of changes in the population as well as changes in the proportion of people with that status. Therefore, in interpreting changes in the volume of persons who are employed, unemployed etc, both changes in population and changes in the relevant rates should be considered.
In recent years there has been a natural decline in the number of people in younger age groups arising from the falling number of births through the 1980’s until 1994 when a low of 48,255 births was recorded (compared with 74,278 in 2009). For example, there were 326,030 people born in Ireland between 1982 and 1986 and, all other things being equal, these people would have been in the 20-24 age group in 2006. However, between 1986 and 1990 there were nearly 50,000 fewer births which would create a natural decrease in the 20-24 age group of close to 50,000 between 2006 and 2010.
In addition to natural changes in population, net migration has been a significant feature of population change in Ireland in recent years and net migration has also been most heavily concentrated in younger age groups. Evidence shows that migration is also most heavily concentrated in the 20-24 and 25-34 age groups. As a result of both natural decrease and net outward migration, the population of persons in the younger age groups has fallen and this should be borne in mind when considering the changes in the number of people in these age groups who are employed, unemployed and in the labour force.
Additional Data Series
Additional data series previously included in the LFS release can still be accessed through the CSO website and are available here.
Labour market data can also be accessed from Statbank, the CSO’s main data dissemination service which can be accessed through the CSO website and are available here.
Implications of Census 2016 Final Results
The LFS results are weighted using population estimates which are updated every quarter. Every 5 years the Census of Population results are used to revise these population estimates, and QNHS/LFS results are revised as a consequence.
The population concept of usual residence is used for the LFS, i.e. all persons usually resident and present in the State plus absent persons who are usually resident in Ireland but are temporarily away from home and outside the State.
The final Census count was published on April 6 2017. The total for this usually resident population concept which was enumerated on Census Night, April 24 2016, was 4,739,597 persons, while the existing estimate for the usually resident population for April 2016 is 4,673,700 as detailed in the 2016 Population and Migration Estimates release. There is a difference, therefore, of just over 65,900 or 1.4% between the two figures.
The CSO has revised the population estimates for 2011 to 2016 based on this final Census count. Estimates of persons employed and unemployed have been revised in line with the higher population totals.
Changes to CSO Labour Market Statistics
Effective from Q3 2017, the QNHS has been replaced by a new Labour Force Survey (LFS). This is part of a major Household Survey Development (HSD) project that the CSO has been engaged in over the past number of years with the aim of expanding the range of social statistics to meet new needs for information on households and persons. This new survey includes the introduction of Computer Assisted Telephone Interviewing (CATI), a redesigned questionnaire and enhancements to the survey methodology.
The introduction of such large scale changes has inevitably led to discontinuity in some series and this is in line with international experience of introducing such large scale changes. Adjustments have been made to historic QNHS data to enable comparability with the new LFS for headline indicators. However as a result of changes to the questionnaire, the interview mode, the introduction of a new sample, data processing changes and other methodological enhancements there are changes in the levels of some series from Q3 2017 onwards. As a consequence the series before and after the introduction of the new survey may not be directly comparable and users should therefore note this when examining annual and quarterly changes.
The first results from this new LFS were for Q3 2017. They incorporated the revision of population estimates arising from the 2016 Census of Population along with a back-cast series of the existing data for the QNHS to create a coherent time series – additional series were added to the back-casting to further enable comparability between the new and old series.
Participating Households
The Central Statistics Office wishes to thank the participating households for their co-operation in agreeing to take part in the survey and for facilitating the collection of the relevant data.
 Hide Background Notes
Scan the QR code below to view this release online or go to
http://www.cso.ie/en/releasesandpublications/er/lfshfu/lfshouseholdsandfamilyunitsq22018/
 Hide Table 1 Proportion of persons in jobless households by NUTS2 and NUTS3 regions, age and gender