
Statistics in this publication are based on population estimates which have not been updated following Census 2022. See LFS Background Notes.
| Indicator | Q1 2018 | Q1 2019 | Annual change | Annual change (%) |
| Employees reporting agency worker status | 56,600 | 50,400 | -6,200 | -11.0 |
| Employees reporting non-agency worker status | 1,793,300 | 1,904,300 | 111,000 | 6.2 |
| Not stated | 17,600 | 12,200 | -5,400 | -30.7 |
| Total employees | 1,867,500 | 1,966,800 | 99,300 | 5.3 |
| Proportion of employees reporting agency worker status (%)1 | 3.1 | 2.6 | - | - |
| 1 Note: Denominator excludes employees whose agency worker status was Not stated | ||||
This release presents results of an analysis of employees in the Labour Force Survey who self-reported as being in the paid employment of an employment agency and are thus referred to as ‘agency workers’ in this release.
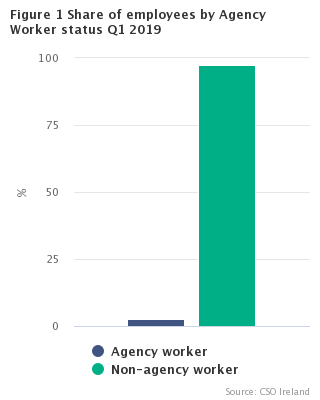
In Q1 2019, 2.6% of employees were classified as agency workers. This was down from 3.1% in Q1 2018.
The number of employees who reported as being an agency worker was 50,400 a decrease of 6,200 (-11.0%) from Q1 2018.
The proportion of employees who reported not being an agency worker was 97.4%, up from 96.9% a year earlier. See tables 1a and 1b and figure 1.
Agency workers more likely to be female than male
The results showed that in Q1 2019, agency workers were more likely to be female rather than male. Of the 50,400 employees who were agency workers in Q1 2019, 26,200 or 52.0% were female while 24,200 or 48.0% were male. This compares to an overall even split of all employees in the State of 50.0% each for males and females. The greater share (59.7%) of the fall of 6,200 in the number of agency workers in the year to Q1 2019 was accounted for by males. See table 2a and 2b and figure 2.
In Q1 2019, 2.5% of all male employees in the State were agency workers while the corresponding figure for females was 2.7%. See table 2b.
Over a quarter of agency workers were employed in the Agriculture, forestry, fishing, Industry and Construction sectors
In Q1 2019, just over a quarter (26.8%) of agency workers were employed in the Agriculture, forestry, fishing, Industry and Construction sectors and this was up from 21.2% in Q1 2018.
The Human health and social work activities sector accounted for 17.9% of agency workers, while all other NACE economic sectors combined accounted for over half (55.2%) of all agency workers. See table 3b and figure 3.
| % | |
| Male | 48 |
| Female | 52 |
| NACE Rev.2 Economic Sector | Share of agency workers | Share of total employees |
|---|---|---|
| A, B-F Agriculture, forestry and fishing, Industry and Construction | 26.8 | 19.9 |
| Q Human health and social work activities | 17.9 | 13.8 |
| G-P, R-U Other NACE activities | 55.2 | 66 |
Over a third of agency workers were employed as an Associate professional and higher occupation
The greater incidence of employees (33.1%) reporting as agency workers were in the Associate Professionals and higher occupation groups; this grouping of occupations accounted for 39.8% of all employees in the State.
The Elementary group, while representing 12.1% of total employees in the State, accounted for 17.5% of all agency workers. See table 4b.
Just over two fifths of agency workers were in the 15-34 age group
In Q1 2019, just over two fifths (43.3%) of agency workers were in the 15-34 age group and this was up from 38.9% in Q1 2018. This age cohort represented 36.0% of all employees in the State in Q1 2019. Persons aged 35-44 accounted for 25.8% of agency workers while representing 28.3% of total employees in Q1 2019. Persons aged 45-54 accounted for 19.0% of agency workers while representing 21.2% of total employees during the same period.
Finally, those persons aged 55 years and over accounted for 12.1% of agency workers while representing 14.5% of all employees in the State. See table 5b and figure 4.
| Age group | Share of agency workers | Share of total employees |
|---|---|---|
| 15-34 | 43.3 | 36 |
| 35-44 | 25.8 | 28.3 |
| 45-54 | 19 | 21.2 |
| 55+ | 12.2 | 14.5 |
Six out of ten agency workers worked less than 40 hours per week
Approximately six out every ten (57.3%) agency workers worked less than 40 hours per week in Q1 2019, down slightly from 58.8% a year earlier. Persons who worked less than 40 hours per week accounted for 59.7% of all employees in the State.
A further 38.5% of agency workers worked 40 hours and over per week, up from 36.2% in Q1 2018. See table 7b.
Seven in ten agency workers were in full-time employment
In Q1 2019, just over seven in ten agency workers (72.0%) were in full-time employment. This was down from the 75.4% recorded in Q1 2018. Full-time employees accounted for 78.9% of all employees in the State and this was down slightly from 79.0% a year earlier.
Part-time employees accounted for 28.0% of all agency workers, up from 24.6% a year earlier. Part-time employees accounted for 21.1% of all employees in the State in Q1 2019. See table 8b and figure 5.
| Share of agency workers | Share of total employees | |
| Full-time | 72 | 78.9 |
| Part-time | 28 | 21.1 |
A quarter of agency workers were non-Irish nationals
In Q1 2019, a quarter (26.2%) of agency workers were non-Irish nationals and this was up from 24.6% a year earlier. Non-Irish nationals accounted for 17.5% of all employees in the State in Q1 2019.
In Q1 2019, 73.6% of agency workers were Irish nationals and this was down from 75.4% a year earlier. Irish nationals accounted for 82.5% of all employees in the State in Q1 2019. See table 11b.
Almost half of agency workers had a third level non-honours degree or higher
Employees whose highest level of education was Third level non-honours degree or above accounted for 47.0% of all agency workers in Q1 2019. The corresponding figures for those with a Higher secondary or below and Post-secondary non-tertiary education were 33.3% and 16.3% respectively.
Those with Third level non-honours degree or above as their highest level of education represented 49.4% of all employees in the State while the figures for the Higher secondary or below and Post-secondary non-tertiary categories were 34.8% and 13.2% respectively. See table 12b.
In terms of the proportions within the education categories who were agency workers in Q1 2019, 3.2% of those whose highest level of education was Post-secondary non-tertiary were agency workers. This compares to 2.5% of employees in each of the Higher secondary or below and the Third level non-honours degree or above classifications. See table 12b.
* Denominator excludes employees where agency worker status was Not stated
| Table 1a Employees aged 15 years and over classified by agency worker status | ||||||
| '000 | ||||||
| Detailed agency worker status | Q4 17 | Q1 18 | Q2 18 | Q3 18 | Q4 18 | Q1 19 |
| Employee is agency worker | 56.2 | 56.6 | 51.6 | 52.0 | 45.4 | 50.4 |
| Employee is not agency worker | 1,813.5 | 1,793.3 | 1,847.7 | 1,879.1 | 1,895.8 | 1,904.3 |
| Not stated | 13.4 | 17.6 | 13.8 | 11.6 | 8.9 | 12.2 |
| Total employees | 1,883.1 | 1,867.5 | 1,913.1 | 1,942.7 | 1,950.1 | 1,966.8 |
| Table 1b Share of employees aged 15 years and over classified by agency worker status1 | ||||||
| % | ||||||
| Detailed agency worker status | Q4 17 | Q1 18 | Q2 18 | Q3 18 | Q4 18 | Q1 19 |
| Employee is agency worker | 3.0 | 3.1 | 2.7 | 2.7 | 2.3 | 2.6 |
| Employee is not agency worker | 97.0 | 96.9 | 97.3 | 97.3 | 97.7 | 97.4 |
| Total employees | 100.0 | 100.0 | 100.0 | 100.0 | 100.0 | 100.0 |
| 1 Note: Denominator excludes employees whose agency worker status was Not stated | ||||||
| Table 2a Employees aged 15 years and over classified by gender and agency worker status | |||||||
| '000 | |||||||
| Gender/ Agency worker status | Q4 17 | Q1 18 | Q2 18 | Q3 18 | Q4 18 | Q1 19 | |
| Male | Employee is agency worker | 28.9 | 27.9 | 25.0 | 27.6 | 22.3 | 24.2 |
| Employee is not agency worker | 904.4 | 899.6 | 927.0 | 945.9 | 954.4 | 952.6 | |
| Not stated | [5.8] | 9.0 | [7.3] | [6.7] | [5.1] | [6.2] | |
| Total | 939.1 | 936.6 | 959.3 | 980.3 | 981.8 | 983.0 | |
| Female | Employee is agency worker | 27.3 | 28.7 | 26.6 | 24.4 | 23.1 | 26.2 |
| Employee is not agency worker | 909.1 | 893.7 | 920.7 | 933.1 | 941.4 | 951.7 | |
| Not stated | [7.6] | 8.6 | [6.5] | [4.9] | * | [6] | |
| Total | 944.0 | 931.0 | 953.8 | 962.4 | 968.4 | 983.9 | |
| All employees | Employee is agency worker | 56.2 | 56.6 | 51.6 | 52.0 | 45.4 | 50.4 |
| Employee is not agency worker | 1,813.5 | 1,793.3 | 1,847.7 | 1,879.1 | 1,895.8 | 1,904.3 | |
| Not stated | 13.4 | 17.6 | 13.8 | 11.6 | 8.9 | 12.2 | |
| Total | 1,883.1 | 1,867.5 | 1,913.1 | 1,942.7 | 1,950.1 | 1,966.8 | |
| Table 2b Share and proportion of employees aged 15 years and over classified by gender and agency worker status | ||||||
| % | ||||||
| Gender/ Agency worker status | Q4 17 | Q1 18 | Q2 18 | Q3 18 | Q4 18 | Q1 19 |
| Share of Employees who are agency workers by gender | ||||||
| Male | 51.4 | 49.3 | 48.4 | 53.1 | 49.1 | 48.0 |
| Female | 48.6 | 50.7 | 51.6 | 46.9 | 50.9 | 52.0 |
| Total | 100.0 | 100.0 | 100.0 | 100.0 | 100.0 | 100.0 |
| Share of total employees by gender1 | ||||||
| Male | 49.9 | 50.1 | 50.1 | 50.4 | 50.3 | 50.0 |
| Female | 50.1 | 49.9 | 49.9 | 49.6 | 49.7 | 50.0 |
| Total | 100.0 | 100.0 | 100.0 | 100.0 | 100.0 | 100.0 |
| Proportion of Employees who are agency workers within each gender1 | ||||||
| Male | 3.1 | 3.0 | 2.6 | 2.8 | 2.3 | 2.5 |
| Female | 2.9 | 3.1 | 2.8 | 2.5 | 2.4 | 2.7 |
| Total | 3.0 | 3.1 | 2.7 | 2.7 | 2.3 | 2.6 |
| 1 Note: Denominator excludes employees whose agency worker status was Not stated | ||||||
| Table 3a Employees aged 15 years and over classified by NACE Rev.2 Economic Sector and agency worker status | ||||||||
| '000 | ||||||||
| Economic sector (NACE Rev.2)/ Agency worker status | Q4 17 | Q1 18 | Q2 18 | Q3 18 | Q4 18 | Q1 19 | ||
| A, B-F | Agriculture, forestry, fishing, Industry and Construction | Employee is agency worker | 12.9 | 12.0 | 13.1 | 13.8 | 10.4 | 13.5 |
| Employee is not agency worker | 360.1 | 357.3 | 362.8 | 377.7 | 373.0 | 374.9 | ||
| Not stated | * | * | * | * | * | * | ||
| Total | 375.4 | 373.7 | 378.1 | 394.2 | 385.7 | 390.7 | ||
| Q | Human health and social work activities | Employee is agency worker | 11.6 | 12.3 | 10.2 | 10.1 | 7.8 | 9.0 |
| Employee is not agency worker | 250.6 | 242.8 | 255.3 | 253.8 | 265.8 | 261.2 | ||
| Not stated | * | * | * | * | * | * | ||
| Total | 265.2 | 259.1 | 268.1 | 265.3 | 273.8 | 271.8 | ||
| G-P, R-U | Other Sectors | Employee is agency worker | 31.5 | 32.2 | 28.3 | 28.1 | 27.2 | 27.8 |
| Employee is not agency worker | 1,196.5 | 1,187.9 | 1,221.6 | 1,241.4 | 1,251.9 | 1,263.2 | ||
| Not stated | [6.5] | 8.5 | 8.2 | [6.2] | [5.4] | [7.2] | ||
| Total | 1,234.5 | 1,228.6 | 1,258.0 | 1,275.7 | 1,284.5 | 1,298.2 | ||
| Not stated | Employee is agency worker | * | * | * | * | * | * | |
| Employee is not agency worker | [6.4] | [5.3] | [8] | [6.1] | [5] | [5] | ||
| Not stated | * | * | * | * | * | * | ||
| Total | 7.9 | [6.1] | 8.9 | [7.5] | [6.1] | [6.1] | ||
| All employees | Employee is agency worker | 56.2 | 56.6 | 51.6 | 52.0 | 45.4 | 50.4 | |
| Employee is not agency worker | 1,813.5 | 1,793.3 | 1,847.7 | 1,879.1 | 1,895.8 | 1,904.3 | ||
| Not stated | 13.4 | 17.6 | 13.8 | 11.6 | 8.9 | 12.2 | ||
| Total | 1,883.1 | 1,867.5 | 1,913.1 | 1,942.7 | 1,950.1 | 1,966.8 | ||
| Table 3b Share and proportion of employees aged 15 years and over classified by NACE Rev.2 Economic Sector and agency worker status | |||||||
| % | |||||||
| Economic Sector (NACE Rev.2)/ Agency worker status | Q4 17 | Q1 18 | Q2 18 | Q3 18 | Q4 18 | Q1 19 | |
| Share of Employees who are agency workers by NACE Rev.2 Economic Sector | |||||||
| A, B-F | Agriculture, forestry, fishing, Industry and Construction | 23.0 | 21.2 | 25.4 | 26.5 | 22.9 | 26.8 |
| Q | Human health and social work activities | 20.6 | 21.7 | 19.8 | 19.4 | 17.2 | 17.9 |
| G-P, R-U | Other sectors | 56.0 | 56.9 | 54.8 | 54.0 | 59.9 | 55.2 |
| Not stated | * | * | * | * | * | * | |
| Total | 100.0 | 100.0 | 100.0 | 100.0 | 100.0 | 100.0 | |
| Share of total employees by NACE Rev.2 Economic Sector1 | |||||||
| A, B-F | Agriculture, forestry, fishing, Industry and Construction | 19.9 | 20.0 | 19.8 | 20.3 | 19.8 | 19.9 |
| Q | Human health and social work activities | 14.0 | 13.8 | 14.0 | 13.7 | 14.1 | 13.8 |
| G-P, R-U | Other sectors | 65.7 | 66.0 | 65.8 | 65.7 | 65.9 | 66.0 |
| Not stated | [0.4] | [0.3] | [0.4] | [0.3] | [0.3] | [0.3] | |
| Total | 100.0 | 100.0 | 100.0 | 100.0 | 100.0 | 100.0 | |
| Proportion of Employees who are agency workers within each NACE Rev.2 Economic Sector1 | |||||||
| A, B-F | Agriculture, forestry, fishing, Industry and Construction | 3.5 | 3.2 | 3.5 | 3.5 | 2.7 | 3.5 |
| Q | Human health and social work activities | 4.4 | 4.8 | 3.8 | 3.8 | 2.9 | 3.3 |
| G-P, R-U | Other sectors | 2.6 | 2.6 | 2.3 | 2.2 | 2.1 | 2.2 |
| Not stated | * | * | * | * | * | * | |
| Total | 3.0 | 3.1 | 2.7 | 2.7 | 2.3 | 2.6 | |
| 1 Note: Denominator excludes employees whose agency worker status was Not stated | |||||||
| Table 4a Employees aged 15 years and over classified by occupation (SOC2010) and agency worker status | ||||||||
| '000 | ||||||||
| Broad occupational group/ Agency worker status | Q4 17 | Q1 18 | Q2 18 | Q3 18 | Q4 18 | Q1 19 | ||
| 1-3 | Associate Professionals and higher | Employee is agency worker | 21.1 | 20.7 | 17.6 | 16.7 | 12.8 | 16.7 |
| Employee is not agency worker | 723.6 | 705.4 | 735.3 | 742.3 | 763.0 | 761.6 | ||
| Not stated | * | [6.1] | * | * | * | * | ||
| Total | 749.1 | 732.2 | 757.0 | 761.8 | 778.8 | 781.0 | ||
| 6 | Caring, leisure and other services | Employee is agency worker | [6.7] | 7.4 | [6.5] | [6.7] | [6.7] | [6.6] |
| Employee is not agency worker | 166.5 | 167.6 | 162.1 | 166.2 | 167.5 | 169.3 | ||
| Not stated | * | * | * | * | * | * | ||
| Total | 175.3 | 177.2 | 170.4 | 174.3 | 174.2 | 177.1 | ||
| 8 | Process, plant and machine operatives | Employee is agency worker | [6.5] | [6.6] | [6.9] | [6.7] | [4.5] | [6.0] |
| Employee is not agency worker | 137.2 | 137.5 | 146.4 | 147.8 | 149.6 | 152.2 | ||
| Not stated | * | * | * | * | * | * | ||
| Total | 144.3 | 145.9 | 154.7 | 156.1 | 155.0 | 159.1 | ||
| 9 | Elementary | Employee is agency worker | [8.1] | [7.7] | [7.2] | 9.3 | [6.5] | 8.8 |
| Employee is not agency worker | 219.1 | 217.4 | 226.7 | 233.4 | 229.5 | 227.8 | ||
| Not stated | * | * | * | * | * | * | ||
| Total | 228.4 | 228.0 | 236.3 | 244.4 | 237.3 | 238.4 | ||
| 4-5, 7 | Other Occupations | Employee is agency worker | 13.6 | 14.0 | 13.4 | 12.5 | 14.7 | 12.1 |
| Employee is not agency worker | 555.3 | 553.9 | 562.8 | 575.1 | 576.5 | 583.4 | ||
| Not stated | * | * | * | * | * | * | ||
| Total | 572.2 | 571.9 | 579.5 | 590.4 | 593.6 | 599.8 | ||
| Not Stated | Employee is agency worker | * | * | * | * | * | * | |
| Employee is not agency worker | 11.8 | 11.4 | 14.4 | 14.3 | 9.7 | 10.0 | ||
| Not stated | * | * | * | * | * | * | ||
| Total | 13.7 | 12.3 | 15.3 | 15.7 | 11.2 | 11.5 | ||
| All employees | Employee is agency worker | 56.2 | 56.6 | 51.6 | 52.0 | 45.4 | 50.4 | |
| Employee is not agency worker | 1,813.5 | 1,793.3 | 1,847.7 | 1,879.1 | 1,895.8 | 1,904.3 | ||
| Not stated | 13.4 | 17.6 | 13.8 | 11.6 | 8.9 | 12.2 | ||
| Total | 1,883.1 | 1,867.5 | 1,913.1 | 1,942.7 | 1,950.1 | 1,966.8 | ||
| Table 4b Share and proportion of employees aged 15 years and over classified by occupation (SOC2010) and agency worker status | |||||||
| % | |||||||
| Broad occupational group/ Agency worker status | Q4 17 | Q1 18 | Q2 18 | Q3 18 | Q4 18 | Q1 19 | |
| Share of Employees who are agency workers by occupation (SOC2010) | |||||||
| 1-3 | Associate professionals and higher | 37.5 | 36.6 | 34.1 | 32.1 | 28.2 | 33.1 |
| 6 | Caring, leisure and other services | [11.9] | 13.1 | [12.6] | [12.9] | [14.8] | [13.1] |
| 8 | Process, plant and machine operatives | [11.6] | [11.7] | [13.4] | [12.9] | [9.9] | [11.9] |
| 9 | Elementary | [14.4] | [13.6] | [14] | 17.9 | [14.3] | 17.5 |
| 4-5, 7 | Other Occupations | 24.2 | 24.7 | 26.0 | 24.0 | 32.4 | 24.0 |
| Not stated | * | * | * | * | * | * | |
| Total | 100.0 | 100.0 | 100.0 | 100.0 | 100.0 | 100.0 | |
| Share of total employees by occupation (SOC2010) 1 | |||||||
| 1-3 | Associate professionals and higher | 39.8 | 39.3 | 39.6 | 39.3 | 40.0 | 39.8 |
| 6 | Caring, leisure and other services | 9.3 | 9.5 | 8.9 | 9.0 | 9.0 | 9.0 |
| 8 | Process, plant and machine operatives | 7.7 | 7.8 | 8.1 | 8.0 | 7.9 | 8.1 |
| 9 | Elementary | 12.2 | 12.2 | 12.3 | 12.6 | 12.2 | 12.1 |
| 4-5, 7 | Other Occupations | 30.4 | 30.7 | 30.3 | 30.4 | 30.5 | 30.5 |
| Not stated | 0.6 | 0.6 | 0.8 | 0.7 | 0.5 | 0.5 | |
| Total | 100.0 | 100.0 | 100.0 | 100.0 | 100.0 | 100.0 | |
| Proportion of Employees who are agency workers within each occupation (SOC2010)1 | |||||||
| 1-3 | Associate professionals and higher | 2.8 | 2.9 | 2.3 | 2.2 | 1.6 | 2.1 |
| 6 | Caring, leisure and other services | [3.9] | 4.2 | [3.9] | [3.9] | [3.8] | [3.8] |
| 8 | Process, plant and machine operatives | [4.5] | [4.6] | [4.5] | [4.3] | [2.9] | [3.8] |
| 9 | Elementary | [3.6] | [3.4] | [3.1] | 3.8 | [2.8] | 3.7 |
| 4-5, 7 | Other Occupations | 2.4 | 2.5 | 2.3 | 2.1 | 2.5 | 2.0 |
| Not stated | * | * | * | * | * | * | |
| Total | 3.0 | 3.1 | 2.7 | 2.7 | 2.3 | 2.6 | |
| 1 Note: Denominator excludes employees whose agency worker status was Not stated | |||||||
| Table 5a Employees aged 15 years and over classified by age group and agency worker status | |||||||
| '000 | |||||||
| Age group/ Agency worker status | Q4 17 | Q1 18 | Q2 18 | Q3 18 | Q4 18 | Q1 19 | |
| 15-34 | Employee is agency worker | 22.4 | 22.0 | 20.8 | 24.5 | 20.3 | 21.8 |
| Employee is not agency worker | 675.3 | 650.6 | 679.9 | 695.8 | 689.1 | 681.5 | |
| Not stated | [7.1] | 9.3 | [7] | [7.4] | [5.1] | 8.4 | |
| Total | 704.9 | 681.9 | 707.7 | 727.7 | 714.5 | 711.6 | |
| 35-44 | Employee is agency worker | 15.7 | 15.5 | 13.7 | 11.6 | 11.0 | 13.0 |
| Employee is not agency worker | 514.3 | 518.3 | 524.9 | 528.6 | 536.2 | 540.5 | |
| Not stated | * | * | * | * | * | * | |
| Total | 533.2 | 538.1 | 542.4 | 542.1 | 549.1 | 555.6 | |
| 45-54 | Employee is agency worker | 9.8 | 12.7 | 11.0 | 11.3 | 9.7 | 9.6 |
| Employee is not agency worker | 375.6 | 372.4 | 384.3 | 388.9 | 399.2 | 405.5 | |
| Not stated | * | * | * | * | * | * | |
| Total | 387.4 | 386.9 | 397.0 | 401.6 | 409.7 | 416.5 | |
| 55+ | Employee is agency worker | 8.2 | 6.3 | [6.1] | [4.6] | [4.5] | 6.1 |
| Employee is not agency worker | 248.3 | 251.9 | 258.7 | 265.8 | 271.2 | 276.7 | |
| Not stated | * | * | * | * | * | * | |
| Total | 257.6 | 260.6 | 266.0 | 271.3 | 276.8 | 283.1 | |
| All employees | Employee is agency worker | 56.2 | 56.6 | 51.6 | 52.0 | 45.4 | 50.4 |
| Employee is not agency worker | 1,813.5 | 1,793.3 | 1,847.7 | 1,879.1 | 1,895.8 | 1,904.3 | |
| Not stated | 13.4 | 17.6 | 13.8 | 11.6 | 8.9 | 12.2 | |
| Total | 1,883.1 | 1,867.5 | 1,913.1 | 1,942.7 | 1,950.1 | 1,966.8 | |
| Table 5b Share and proportion of employees aged 15 years and over classified by age group and agency workers status | ||||||
| % | ||||||
| Age group/ Agency worker status | Q4 17 | Q1 18 | Q2 18 | Q3 18 | Q4 18 | Q1 19 |
| Share of Employees who are agency workers by age group | ||||||
| 15-34 | 39.9 | 38.9 | 40.3 | 47.1 | 44.7 | 43.3 |
| 35-44 | 27.9 | 27.4 | 26.6 | 22.3 | 24.2 | 25.8 |
| 45-54 | 17.4 | 22.4 | 21.3 | 21.7 | 21.4 | 19.0 |
| 55+ | 14.6 | 11.1 | [11.8] | [8.8] | [9.9] | 12.1 |
| Total | 100.0 | 100.0 | 100.0 | 100.0 | 100.0 | 100.0 |
| Share of total employees by age group1 | ||||||
| 15-34 | 37.3 | 36.4 | 36.9 | 37.3 | 36.5 | 36.0 |
| 35-44 | 28.3 | 28.9 | 28.4 | 28.0 | 28.2 | 28.3 |
| 45-54 | 20.6 | 20.8 | 20.8 | 20.7 | 21.1 | 21.2 |
| 55+ | 13.7 | 14.0 | 13.9 | 14.0 | 14.2 | 14.5 |
| Total | 100.0 | 100.0 | 100.0 | 100.0 | 100.0 | 100.0 |
| Proportion of Employees who are agency workers within each age group1 | ||||||
| 15-34 | 3.2 | 3.3 | 3.0 | 3.4 | 2.9 | 3.1 |
| 35-44 | 3.0 | 2.9 | 2.5 | 2.1 | 2.0 | 2.3 |
| 45-54 | 2.5 | 3.3 | 2.8 | 2.8 | 2.4 | 2.3 |
| 55+ | 3.2 | 2.4 | [2.3] | [1.7] | [1.6] | 2.2 |
| Total | 3.0 | 3.1 | 2.7 | 2.7 | 2.3 | 2.6 |
| 1 Note: Denominator excludes employees whose agency worker status was Not stated | ||||||
| Table 6a Employees aged 15 years and over classified by NUTS2 regions and agency worker status | |||||||
| '000 | |||||||
| NUTS2 Region/ Agency worker status | Q4 17 | Q1 18 | Q2 18 | Q3 18 | Q4 18 | Q1 19 | |
| Northern and Western | Employee is agency worker | 12.7 | 9.5 | [5.6] | [5.6] | [4.3] | [7.5] |
| Employee is not agency worker | 295.6 | 300.8 | 293.6 | 304.5 | 310.9 | 308.3 | |
| Not stated | * | * | * | * | * | * | |
| Total | 309.4 | 314.1 | 302.9 | 312.6 | 316.0 | 317.5 | |
| Southern | Employee is agency worker | 16.5 | 19.3 | 20.9 | 20.2 | 18.0 | 20.7 |
| Employee is not agency worker | 569.8 | 552.6 | 582.8 | 591.6 | 583.4 | 591.5 | |
| Not stated | [6.4] | 8.4 | [4.8] | * | [4.8] | [4.9] | |
| Total | 592.7 | 580.3 | 608.5 | 615.1 | 606.1 | 617.1 | |
| Eastern and Midland | Employee is agency worker | 27.0 | 27.8 | 25.1 | 26.3 | 23.1 | 22.2 |
| Employee is not agency worker | 948.1 | 939.9 | 971.4 | 982.9 | 1,001.5 | 1,004.5 | |
| Not stated | [5.8] | [5.4] | * | [5.8] | * | [5.6] | |
| Total | 980.9 | 973.1 | 1,001.7 | 1,015.0 | 1,028.0 | 1,032.3 | |
| All employees | Employee is agency worker | 56.2 | 56.6 | 51.6 | 52.0 | 45.4 | 50.4 |
| Employee is not agency worker | 1,813.5 | 1,793.3 | 1,847.7 | 1,879.1 | 1,895.8 | 1,904.3 | |
| Not stated | 13.4 | 17.6 | 13.8 | 11.6 | 8.9 | 12.2 | |
| Total | 1,883.1 | 1,867.5 | 1,913.1 | 1,942.7 | 1,950.1 | 1,966.8 | |
| Table 6b Share and proportion of employees aged 15 years and over classified by NUTS2 regions and agency worker status | |||||||||
| % | |||||||||
| NUTS2 Region/Agency worker status | Q4 17 | Q1 18 | Q2 18 | Q3 18 | Q4 18 | Q1 19 | |||
| Share of employees who are agency workers by NUTS2 regions | |||||||||
| Northern and Western | 22.6 | 16.8 | [10.9] | [10.8] | [9.5] | [14.9] | |||
| Southern | 29.4 | 34.1 | 40.5 | 38.8 | 39.6 | 41.1 | |||
| Eastern and Midland | 48.0 | 49.1 | 48.6 | 50.6 | 50.9 | 44.0 | |||
| Total | 100.0 | 100.0 | 100.0 | 100.0 | 100.0 | 100.0 | |||
| Share of total employees by NUTS2 regions1 | |||||||||
| Northern and Western | 16.5 | 16.8 | 15.7 | 16.1 | 16.2 | 16.2 | |||
| Southern | 31.4 | 30.9 | 31.8 | 31.7 | 31.0 | 31.3 | |||
| Eastern and Midland | 52.2 | 52.3 | 52.5 | 52.3 | 52.8 | 52.5 | |||
| Total | 100.0 | 100.0 | 100.0 | 100.0 | 100.0 | 100.0 | |||
| Proportion of employees who are agency workers within each NUTS2 region1 | |||||||||
| Northern and Western | 4.1 | 3.1 | [1.9] | [1.8] | [1.4] | [2.4] | |||
| Southern | 2.8 | 3.4 | 3.5 | 3.3 | 3.0 | 3.4 | |||
| Eastern and Midland | 2.8 | 2.9 | 2.5 | 2.6 | 2.3 | 2.2 | |||
| Total | 3.0 | 3.1 | 2.7 | 2.7 | 2.3 | 2.6 | |||
| 1 Note: Denominator excludes employees whose agency worker status was Not stated | |||||||||
| Table 7a Employees aged 15 years and over classified by usual hours of work per week and agency worker status | |||||||
| '000 | |||||||
| Usual hours of work per week/Agency worker status | Q4 17 | Q1 18 | Q2 18 | Q3 18 | Q4 18 | Q1 19 | |
| 1-25 hours | Employee is agency worker | 11.7 | 12.4 | 10.0 | 7.8 | 12.1 | 12.2 |
| Employee is not agency worker | 382.1 | 367.3 | 363.5 | 364.2 | 371.0 | 377.8 | |
| Not stated | * | * | * | * | * | * | |
| Total | 397.4 | 383.1 | 375.3 | 373.5 | 384.8 | 391.9 | |
| 26-39 hours | Employee is agency worker | 21.7 | 20.9 | 18.1 | 18.8 | 12.4 | 16.7 |
| Employee is not agency worker | 694.7 | 718.6 | 751.0 | 760.6 | 755.3 | 759.1 | |
| Not stated | * | [6.1] | [4.8] | * | * | * | |
| Total | 719.4 | 745.6 | 773.9 | 783.3 | 769.3 | 777.9 | |
| 40 hours & over | Employee is agency worker | 21.5 | 20.5 | 21.0 | 22.8 | 17.6 | 19.4 |
| Employee is not agency worker | 686.8 | 660.7 | 671.3 | 695.7 | 710.3 | 703.4 | |
| Not stated | * | [5.0] | * | * | * | * | |
| Total | 712.8 | 686.2 | 696.0 | 721.5 | 729.9 | 728.1 | |
| Variable hours | Employee is agency worker | * | * | * | * | * | * |
| Employee is not agency worker | 49.9 | 46.7 | 62.0 | 58.6 | 59.1 | 63.9 | |
| Not stated | * | * | * | * | * | * | |
| Total | 53.5 | 52.5 | 67.8 | 64.3 | 66.1 | 68.9 | |
| All employees | Employee is agency worker | 56.2 | 56.6 | 51.6 | 52.0 | 45.4 | 50.4 |
| Employee is not agency worker | 1,813.5 | 1,793.3 | 1,847.7 | 1,879.1 | 1,895.8 | 1,904.3 | |
| Not stated | 13.4 | 17.6 | 13.8 | 11.6 | 8.9 | 12.2 | |
| Total | 1,883.1 | 1,867.5 | 1,913.1 | 1,942.7 | 1,950.1 | 1,966.8 | |
| Table 7b Share and proportion of employees aged 15 years and over classified by usual hours of work per week and agency worker status | ||||||
| % | ||||||
| Usual hours of work per week/Agency worker status | Q4 17 | Q1 18 | Q2 18 | Q3 18 | Q4 18 | Q1 19 |
| Share of employees who are agency workers by usual hours of work per week | ||||||
| 1-25 hours | 20.8 | 21.9 | 19.4 | 15.0 | 26.7 | 24.2 |
| 26-39 hours | 38.6 | 36.9 | 35.1 | 36.2 | 27.3 | 33.1 |
| 40 hours or more | 38.3 | 36.2 | 40.7 | 43.8 | 38.8 | 38.5 |
| Variable hours | * | * | * | * | * | * |
| Total | 100.0 | 100.0 | 100.0 | 100.0 | 100.0 | 100.0 |
| Share of total employees by usual hours of work per week1 | ||||||
| 1-25 hours | 21.1 | 20.5 | 19.7 | 19.3 | 19.7 | 20.0 |
| 26-39 hours | 38.3 | 40.0 | 40.5 | 40.4 | 39.6 | 39.7 |
| 40 hours or more | 37.9 | 36.8 | 36.5 | 37.2 | 37.5 | 37.0 |
| Variable hours | 2.7 | 2.7 | 3.4 | 3.2 | 3.2 | 3.4 |
| Total | 100.0 | 100.0 | 100.0 | 100.0 | 100.0 | 100.0 |
| Proportion of employees who are agency workers within each usual hours of work per week1 | ||||||
| 1-25 hours | 3.0 | 3.3 | 2.7 | 2.1 | 3.2 | 3.1 |
| 26-39 hours | 3.0 | 2.8 | 2.4 | 2.4 | 1.6 | 2.2 |
| 40 hours or more | 3.0 | 3.0 | 3.0 | 3.2 | 2.4 | 2.7 |
| Variable hours | * | * | * | * | * | * |
| Total | 3.0 | 3.1 | 2.7 | 2.7 | 2.3 | 2.6 |
| 1 Note: Denominator excludes employees whose agency worker status was Not stated | ||||||
| Table 8a Employees aged 15 years and over classified by full-time/part-time status and agency worker status | |||||||
| '000 | |||||||
| Employees classified by full-time and part-time status/Agency worker status | Q4 17 | Q1 18 | Q2 18 | Q3 18 | Q4 18 | Q1 19 | |
| Full-time | Employee is agency worker | 43.9 | 42.7 | 38.9 | 41.8 | 32.9 | 36.3 |
| Employee is not agency worker | 1,427.0 | 1,417.8 | 1,465.2 | 1,488.8 | 1,502.6 | 1,505.4 | |
| Not stated | 9.5 | 12.4 | 11.0 | 9.1 | [6.4] | 9.1 | |
| Total | 1,480.5 | 1,472.9 | 1,515.1 | 1,539.7 | 1,541.9 | 1,550.8 | |
| Part-time | Employee is agency worker | 12.3 | 13.9 | 12.6 | 10.2 | 12.6 | 14.1 |
| Employee is not agency worker | 386.5 | 375.5 | 382.6 | 390.2 | 393.1 | 398.8 | |
| Not stated | * | [5.2] | * | * | * | * | |
| Total | 402.6 | 394.6 | 398.0 | 403.0 | 408.2 | 416.0 | |
| All employees | Employee is agency worker | 56.2 | 56.6 | 51.6 | 52.0 | 45.4 | 50.4 |
| Employee is not agency worker | 1,813.5 | 1,793.3 | 1,847.7 | 1,879.1 | 1,895.8 | 1,904.3 | |
| Not stated | 13.4 | 17.6 | 13.8 | 11.6 | 8.9 | 12.2 | |
| Total | 1,883.1 | 1,867.5 | 1,913.1 | 1,942.7 | 1,950.1 | 1,966.8 | |
| Table 8b Share and proportion of employees aged 15 years and over classified by full-time/part-time status and agency worker status | ||||||
| % | ||||||
| Full and part-time status/Agency worker status | Q4 17 | Q1 18 | Q2 18 | Q3 18 | Q4 18 | Q1 19 |
| Share of employees who are agency workers by full-time/part-time status | ||||||
| Full-time | 78.1 | 75.4 | 75.4 | 80.4 | 72.5 | 72.0 |
| Part-time | 21.9 | 24.6 | 24.4 | 19.6 | 27.8 | 28.0 |
| Total | 100.0 | 100.0 | 100.0 | 100.0 | 100.0 | 100.0 |
| Share of total employees by full-time/part-time status1 | ||||||
| Full-time | 78.7 | 79.0 | 79.2 | 79.3 | 79.1 | 78.9 |
| Part-time | 21.3 | 21.0 | 20.8 | 20.7 | 20.9 | 21.1 |
| Total | 100.0 | 100.0 | 100.0 | 100.0 | 100.0 | 100.0 |
| Proportion of employees who are agency workers within each full-time/part-time status1 | ||||||
| Full-time | 3.0 | 2.9 | 2.6 | 2.7 | 2.1 | 2.4 |
| Part-time | 3.1 | 3.6 | 3.2 | 2.5 | 3.1 | 3.4 |
| Total | 3.0 | 3.1 | 2.7 | 2.7 | 2.3 | 2.6 |
| 1 Note: Denominator excludes employees whose agency worker status was Not stated | ||||||
| Table 9a Employees aged 15 years and over classified by permanency of employment and agency worker status | |||||||
| '000 | |||||||
| Permanency of employment/Agency worker status | Q4 17 | Q1 18 | Q2 18 | Q3 18 | Q4 18 | Q1 19 | |
| Permanent employees | Employee is agency worker | 40.5 | 42.0 | 37.3 | 34.5 | 31.4 | 36.1 |
| Employee is not agency worker | 1,638.0 | 1,634.5 | 1,666.2 | 1,679.1 | 1,717.7 | 1,735.5 | |
| Not stated | 7.9 | 13.1 | 8.1 | [6.8] | * | [6.9] | |
| Total | 1,686.4 | 1,689.6 | 1,711.6 | 1,720.4 | 1,753.2 | 1,778.5 | |
| Temporary employees | Employee is agency worker | 15.5 | 14.4 | 14.1 | 17.2 | 13.6 | 14.1 |
| Employee is not agency worker | 170.5 | 155.2 | 176.2 | 196.6 | 171.3 | 161.7 | |
| Not stated | * | * | * | * | * | * | |
| Total | 187.8 | 172.4 | 193.3 | 216.0 | 186.1 | 177.2 | |
| Not stated | Employee is agency worker | * | * | * | * | * | * |
| Employee is not agency worker | [5.1] | * | [5.3] | * | [6.8] | [7.0] | |
| Not stated | * | * | * | * | * | * | |
| Total | 8.9 | [5.5] | 8.2 | [6.3] | 10.8 | 11.1 | |
| All employees | Employee is agency worker | 56.2 | 56.6 | 51.6 | 52.0 | 45.4 | 50.4 |
| Employee is not agency worker | 1,813.5 | 1,793.3 | 1,847.7 | 1,879.1 | 1,895.8 | 1,904.3 | |
| Not stated | 13.4 | 17.6 | 13.8 | 11.6 | 8.9 | 12.2 | |
| Total | 1,883.1 | 1,867.5 | 1,913.1 | 1,942.7 | 1,950.1 | 1,966.8 | |
| Table 9b Share and proportion of employees aged 15 years and over classified by permanency of employment and agency worker status | ||||||
| % | ||||||
| Permanency of employment/Agency worker status | Q4 17 | Q1 18 | Q2 18 | Q3 18 | Q4 18 | Q1 19 |
| Share of employees who are agency workers by permanency of employment | ||||||
| Permanent employees | 72.1 | 74.2 | 72.3 | 66.3 | 69.2 | 71.6 |
| Temporary employees | 27.6 | 25.4 | 27.3 | 33.1 | 30.0 | 28.0 |
| Not stated | * | * | * | * | * | * |
| Total | 100.0 | 100.0 | 100.0 | 100.0 | 100.0 | 100.0 |
| Share of total employees by permanency of employment1 | ||||||
| Permanent employees | 89.8 | 90.6 | 89.7 | 88.7 | 90.1 | 90.6 |
| Temporary employees | 9.9 | 9.2 | 10.0 | 11.1 | 9.5 | 9.0 |
| Not stated | [0.3] | * | [0.3] | * | [0.4] | 0.4 |
| Total | 100.0 | 100.0 | 100.0 | 100.0 | 100.0 | 100.0 |
| Proportion of employees who are agency workers within each permanency of employment1 | ||||||
| Permanent employees | 2.4 | 2.5 | 2.2 | 2.0 | 1.8 | 2.0 |
| Temporary employees | 8.3 | 8.5 | 7.4 | 8.0 | 7.4 | 8.0 |
| Not stated | * | * | * | * | * | * |
| Total | 3.0 | 3.1 | 2.7 | 2.7 | 2.3 | 2.6 |
| 1 Note: Denominator excludes employees whose agency worker status was Not stated | ||||||
| Table 10a Employees aged 15 years and over classified by duration of employment and agency worker status | |||||||
| '000 | |||||||
| Duration of employment/Agency worker status | Q4 17 | Q1 18 | Q2 18 | Q3 18 | Q4 18 | Q1 19 | |
| Less than 1 year | Employee is agency worker | 17.5 | 16.0 | 16.5 | 18.3 | 14.3 | 19.4 |
| Employee is not agency worker | 301.2 | 308.9 | 334.8 | 353.8 | 341.3 | 339.0 | |
| Not stated | * | * | * | * | * | * | |
| Total | 320.6 | 327.9 | 354.3 | 374.3 | 358.3 | 361.6 | |
| 1 year and over | Employee is agency worker | 37.1 | 38.6 | 33.8 | 32.6 | 29.1 | 29.9 |
| Employee is not agency worker | 1,415.2 | 1,396.1 | 1,414.3 | 1,429.8 | 1,472.8 | 1,495.8 | |
| Not stated | * | [6.6] | * | * | * | [4.6] | |
| Total | 1,456.4 | 1,441.2 | 1,452.5 | 1,466.4 | 1,504.5 | 1,530.3 | |
| Not stated | Employee is agency worker | * | * | * | * | * | * |
| Employee is not agency worker | 97.1 | 88.3 | 98.7 | 95.4 | 81.7 | 69.5 | |
| Not stated | [7.4] | 8.1 | [6.4] | [5.5] | * | * | |
| Total | 106.1 | 98.4 | 106.3 | 102.0 | 87.3 | 75.0 | |
| All employees | Employee is agency worker | 56.2 | 56.6 | 51.6 | 52.0 | 45.4 | 50.4 |
| Employee is not agency worker | 1,813.5 | 1,793.3 | 1,847.7 | 1,879.1 | 1,895.8 | 1,904.3 | |
| Not stated | 13.4 | 17.6 | 13.8 | 11.6 | 8.9 | 12.2 | |
| Total | 1,883.1 | 1,867.5 | 1,913.1 | 1,942.7 | 1,950.1 | 1,966.8 | |
| Table 10b Share and proportion of employees aged 15 years and over classified by duration of employment and agency worker status | ||||||
| % | ||||||
| Duration of employment/Agency worker status | Q4 17 | Q1 18 | Q2 18 | Q3 18 | Q4 18 | Q1 19 |
| Share of Employees who are agency workers by duration of employment | ||||||
| Less than 1 year | 31.1 | 28.3 | 32.0 | 35.2 | 31.5 | 38.5 |
| 1 year and over | 66.0 | 68.2 | 65.5 | 62.7 | 64.1 | 59.3 |
| Not stated | * | * | * | * | * | * |
| Total | 100.0 | 100.0 | 100.0 | 100.0 | 100.0 | 100.0 |
| Share of total employees by duration of employment1 | ||||||
| Less than 1 year | 17.0 | 17.6 | 18.5 | 19.3 | 18.3 | 18.3 |
| 1 year and over | 77.7 | 77.6 | 76.2 | 75.7 | 77.4 | 78.1 |
| Not stated | 5.3 | 4.9 | 5.3 | 5.0 | 4.3 | 3.6 |
| Total | 100.0 | 100.0 | 100.0 | 100.0 | 100.0 | 100.0 |
| Proportion of Employees who are agency workers within each duration of employment1 | ||||||
| Less than 1 year | 5.5 | 4.9 | 4.7 | 4.9 | 4.0 | 5.4 |
| 1 year and over | 2.6 | 2.7 | 2.3 | 2.2 | 1.9 | 2.0 |
| Not stated | * | * | * | * | * | * |
| Total | 3.0 | 3.1 | 2.7 | 2.7 | 2.3 | 2.6 |
| 1 Note: Denominator excludes employees whose agency worker status was Not stated | ||||||
| Table 11a Employees aged 15 years and over classified by nationality and agency worker status | |||||||
| '000 | |||||||
| Nationality/Agency worker status | Q4 17 | Q1 18 | Q2 18 | Q3 18 | Q4 18 | Q1 19 | |
| Irish nationals | Employee is agency worker | 42.8 | 42.7 | 39.0 | 37.3 | 34.7 | 37.1 |
| Employee is not agency worker | 1,514.9 | 1,491.0 | 1,531.4 | 1,558.3 | 1,562.5 | 1,575.6 | |
| Not stated | 10.9 | 15.5 | 12.3 | 9.4 | 7.4 | 8.6 | |
| Total | 1,568.6 | 1,549.1 | 1,582.7 | 1,605.0 | 1,604.6 | 1,621.3 | |
| Non-Irish nationals | Employee is agency worker | 13.4 | 13.9 | 12.5 | 14.7 | [10.7] | 13.2 |
| Employee is not agency worker | 298.6 | 302.3 | 316.3 | 320.8 | 333.3 | 328.6 | |
| Not stated | * | * | * | * | * | * | |
| Total | 314.5 | 318.4 | 330.4 | 337.7 | 345.6 | 345.5 | |
| All employees | Employee is agency worker | 56.2 | 56.6 | 51.6 | 52.0 | 45.4 | 50.4 |
| Employee is not agency worker | 1,813.5 | 1,793.3 | 1,847.7 | 1,879.1 | 1,895.8 | 1,904.3 | |
| Not stated | 13.4 | 17.6 | 13.8 | 11.6 | 8.9 | 12.2 | |
| Total | 1,883.1 | 1,867.5 | 1,913.1 | 1,942.7 | 1,950.1 | 1,966.8 | |
| Table 11b Share and proportion of employees aged 15 years and over classified by nationality and agency worker status | |||||||||
| % | |||||||||
| Nationality/Agency worker status | Q4 17 | Q1 18 | Q2 18 | Q3 18 | Q4 18 | Q1 19 | |||
| Share of employees who are agency workers by nationality | |||||||||
| Irish nationals | 76.2 | 75.4 | 75.6 | 71.7 | 76.4 | 73.6 | |||
| Non-Irish nationals | 23.8 | 24.6 | 24.2 | 28.3 | [23.6] | 26.2 | |||
| Total | 100.0 | 100.0 | 100.0 | 100.0 | 100.0 | 100.0 | |||
| Share of total employees by nationality1 | |||||||||
| Irish nationals | 83.3 | 82.9 | 82.7 | 82.6 | 82.3 | 82.5 | |||
| Non-Irish nationals | 16.7 | 17.1 | 17.3 | 17.4 | 17.7 | 17.5 | |||
| Total | 100.0 | 100.0 | 100.0 | 100.0 | 100.0 | 100.0 | |||
| Proportion of employees who are agency workers within each nationality1 | |||||||||
| Irish nationals | 2.7 | 2.8 | 2.5 | 2.3 | 2.2 | 2.3 | |||
| Non-Irish nationals | 4.3 | 4.4 | 3.8 | 4.4 | [3.1] | 3.9 | |||
| Total | 3.0 | 3.1 | 2.7 | 2.7 | 2.3 | 2.6 | |||
| 1 Note: Denominator excludes employees whose agency worker status was Not stated | |||||||||
| Table 12a Employees aged 15 years and over classified by highest level of education attained and agency worker status | |||||||
| '000 | |||||||
| Highest level of education attained/Agency worker status | Q4 17 | Q1 18 | Q2 18 | Q3 18 | Q4 18 | Q1 19 | |
| Higher secondary or below | Employee is agency worker | 17.4 | 19.4 | 17.4 | 16.1 | 14.1 | 16.8 |
| Employee is not agency worker | 627.5 | 622.4 | 635.4 | 649.3 | 639.0 | 663.0 | |
| Not stated | * | [5.4] | [4.7] | * | * | * | |
| Total | 648.3 | 647.3 | 657.5 | 668.3 | 656.6 | 683.7 | |
| Post secondary non tertiary | Employee is agency worker | 11.5 | 9.4 | 9.4 | 8.2 | 9.1 | 8.2 |
| Employee is not agency worker | 239.5 | 237.6 | 242.9 | 255.8 | 262.8 | 249.7 | |
| Not stated | * | * | * | * | * | * | |
| Total | 252.2 | 248.8 | 254.1 | 265.0 | 272.2 | 258.7 | |
| Third level non-honours degree or above | Employee is agency worker | 26.3 | 25.9 | 22.7 | 24.9 | 20.8 | 23.7 |
| Employee is not agency worker | 899.8 | 888.3 | 923.9 | 924.0 | 944.8 | 941.9 | |
| Not stated | [5.5] | [6.7] | * | * | * | * | |
| Total | 931.6 | 920.9 | 950.4 | 952.2 | 967.9 | 968.8 | |
| Other/Not stated | Employee is agency worker | * | * | * | * | * | * |
| Employee is not agency worker | 46.7 | 45.0 | 45.5 | 49.9 | 49.2 | 49.6 | |
| Not stated | * | * | * | * | * | * | |
| Total | 51.0 | 50.6 | 51.1 | 57.1 | 53.4 | 55.6 | |
| All employees | Employee is agency worker | 56.2 | 56.6 | 51.6 | 52.0 | 45.4 | 50.4 |
| Employee is not agency worker | 1,813.5 | 1,793.3 | 1,847.7 | 1,879.1 | 1,895.8 | 1,904.3 | |
| Not stated | 13.4 | 17.6 | 13.8 | 11.6 | 8.9 | 12.2 | |
| Total | 1,883.1 | 1,867.5 | 1,913.1 | 1,942.7 | 1,950.1 | 1,966.8 | |
| Table 12b Share and proportion of employees aged 15 years and over classified by highest level of education attained and agency worker status | ||||||
| % | ||||||
| Highest level of education attained/Agency worker status | Q4 17 | Q1 18 | Q2 18 | Q3 18 | Q4 18 | Q1 19 |
| Share of employees who are agency workers by highest level of education attained | ||||||
| Higher secondary or below | 31.0 | 34.3 | 33.7 | 31.0 | 31.1 | 33.3 |
| Post secondary non tertiary | 20.5 | 16.6 | 18.2 | 15.8 | 20.0 | 16.3 |
| Third level non-honours degree or above | 46.8 | 45.8 | 44.0 | 47.9 | 45.8 | 47.0 |
| Other/Not stated | * | * | * | * | * | * |
| Total | 100.0 | 100.0 | 100.0 | 100.0 | 100.0 | 100.0 |
| Share of total employees by highest level of education attained 1 | ||||||
| Higher secondary or below | 34.5 | 34.7 | 34.4 | 34.5 | 33.6 | 34.8 |
| Post secondary non tertiary | 13.4 | 13.4 | 13.3 | 13.7 | 14.0 | 13.2 |
| Third level non-honours degree or above | 49.5 | 49.4 | 49.8 | 49.1 | 49.7 | 49.4 |
| Other/Not stated | 2.6 | 2.5 | 2.5 | 2.7 | 2.6 | 2.6 |
| Total | 100.0 | 100.0 | 100.0 | 100.0 | 100.0 | 100.0 |
| Proportion of employees who are agency workers within each highest level of education attained1 | ||||||
| Higher secondary or below | 2.7 | 3.0 | 2.7 | 2.4 | 2.2 | 2.5 |
| Post secondary non tertiary | 4.6 | 3.8 | 3.7 | 3.1 | 3.3 | 3.2 |
| Third level non-honours degree or above | 2.8 | 2.8 | 2.4 | 2.6 | 2.2 | 2.5 |
| Other/Not stated | * | * | * | * | * | * |
| Total | 3.0 | 3.1 | 2.7 | 2.7 | 2.3 | 2.6 |
| 1 Note: Denominator excludes employees whose agency worker status was Not stated | ||||||
This release presents results of an analysis of employees in the Labour Force Survey (LFS) who self-reported as being in the paid employment of an employment agency and are thus referred to as ‘agency workers’ in this release.
The following question is asked of all employees in the LFS:
|
Do you have a contract with an employment agency that placed you in your current job and pays your salary? 1 Yes 2 No |
A number of respondents did not report their status with regard to agency work, these respondents are identified as ‘Not stated’ in the relevant data tables and are excluded from the denominator in calculating the share or proportion of all respondents who are agency workers.
The Labour Force Survey (LFS) replaced the Quarterly National Household Survey (QNHS) at the beginning of Q3 2017. The purpose of the survey is the production of quarterly labour force estimates and occasional reports on special social topics. The survey meets the requirements of Council Regulation (EC) No. 577/98, adopted in March 1998, which requires the introduction of quarterly labour force surveys in EU member states.
Information is collected continuously throughout the year from households surveyed each week in each quarter. Up to and including the fourth quarter of 2008 the QNHS operated on a seasonal quarter basis since its establishment in Q4 1997. The LFS is undertaken on a calendar quarter basis which was first adopted in the QNHS in the first quarter of 2009.
The reference quarters for survey results are:
Q1 - January to March, Q2 - April to June, Q3 - July to September and Q4 - October to December
The LFS is conducted using mixed mode data collection with the introduction of Computer Assisted Telephone Interviewing (CATI). As with the QNHS, information is collected from each sample household over 5 successive quarters or Waves. However, in the LFS, the first interview is conducted by a team of face-to-face interviewers using Computer Assisted Personal Interviewing (CAPI). The four follow-up interviews are conducted using CATI from a dedicated call centre, where householders have agreed to conduct a telephone interview, and are conducted using face-to-face interviews where householders have not agreed to conduct a telephone interview.
A new sample based on the 2011 Census of Population was selected for the LFS and this was introduced incrementally from Q1 2016. The sample is stratified using administrative county and the Pobal HP (Haase and Pratschke) Deprivation Index. A two-stage sample design is used. In the first stage 1,300 blocks are selected using Probability Proportional to Size (PPS) sampling. In the second stage households are selected using Simple Random Sampling (SRS). This ensures each household in the sample frame has an equal probability of selection.
To account for the additional attrition resulting from the introduction of mixed mode data collection, the LFS sample has been increased incrementally from Q3 2017. An additional 1,300 households have been included in Wave 1 for each quarter up to Q3 2018 and this has resulted in a total sample of 32,500 from Q3 2018 onwards. The actual achieved sample varies over time depending on the level of response.
Households are asked to take part in the survey for five consecutive quarters and are then replaced by other households in the same block. Thus, one fifth of the households in the survey are replaced each quarter and the LFS sample involves an overlap of 80% between consecutive quarters and 20% between the same quarter in consecutive years. It is important to note that there is no overlap in sample between the QNHS and the LFS.
The survey results are weighted to agree with population estimates broken down by age, sex and region and are also calibrated to nationality control totals. The LFS results also contain a non-response adjustment to make the results from the achieved sample representative of the target sample and the population.
Households that contain only respondents who are aged 75 or over who are each classified as Inactive (Not in the Labour Force) are not re-interviewed. This is to reduce unnecessary burden and instead answers are copied forward from the last available interview.
All estimates based on sample surveys are subject to error, some of which is measurable. Where an estimate is statistically significantly different from another estimate it means that we can be 95% confident that differences between those two estimates are not due to sampling error.
Up to and including Q1 2006 the annual population estimates were calculated using the defacto definition of population (i.e. all persons present in the state). Since Q2 2006 a new concept of usual residence has been used, i.e. all persons usually resident and present in the state plus absent persons who are usually resident in Ireland but are temporarily away from home and outside the state.
The primary classification used for the LFS results is the ILO (International Labour Office) labour force classification. Labour Force Survey data on this basis have been published since 1988. The ILO classification distinguishes the following main subgroups of the population aged 15 or over:
In Employment: Persons who worked in the week before the survey for one hour or more for payment or profit, including work on the family farm or business and all persons who had a job but were not at work because of illness, holidays etc. in the week.
Unemployed: Persons who, in the week before the survey, were without work and available for work within the next two weeks, and had taken specific steps, in the preceding four weeks, to find work. It should be noted that as per Eurostat’s operational implementation, the upper age limit for classifying a person as unemployed is 74 years.
Inactive Population (not in labour force): All other persons.
The labour force comprises of persons employed plus unemployed.
The LFS sectoral employment figures are based on the EU NACE Rev. 2 (Nomenclature généraledes activités économiques dans les Communauté européenne) classification as defined in Council Regulation (EC) no 1893/2006. From Q1 2009 NACE Rev. 2 has been adopted as the primary classification of industrial sectors for use in QNHS/LFS outputs. The NACE Rev. 1.1 classification had been in use from Q4 1997 to Q4 2008.
To facilitate analysis and the running of seasonal adjustment on the time series, NACE Rev. 2 estimates have been produced from Q1 1998 onwards. As of Q2 2009 only NACE Rev. 2 estimates have been published.
Following changes to the European regulations governing the Quarterly Labour Force Survey (implemented in Ireland using the LFS) (formerly the QNHS) the CSO has been obliged to report occupational coding data to Eurostat based on the new Europe wide classification ISCO-08 from Q1 2011 onwards. To allow this requirement to be met the CSO changed to using UK SOC2010 as the primary classification used in collecting the data. ISCO-08 is then derived from UK SOC2010.
The previously used classification for publication purposes in Ireland was UK SOC1990 and this cannot be directly compared to the new UK SOC2010 classification as all occupations have been reclassified accordingly. One example which highlighted this change was the reclassifying of farmers from the major occupation grouping of ‘Managers and administrators’ in SOC1990 to the major occupation grouping of ‘Skilled trades’ in SOC2010.
Results for occupations coded to the new SOC2010 classification have now been recoded for historical quarters back to Q1 2007 to provide a longer and consistent time series for users.
Further information regarding SOC 2010 is available here.
The regional classifications in this release is based on the NUTS (Nomenclature of Territorial Units) classification used by Eurostat. Until Q4 2017, the NUTS3 regions corresponded to the eight Regional Authorities established under the Local Government Act, 1991 (Regional Authorities) (Establishment) Order, 1993, which came into operation on 1 January 1994 while the NUTS2 regions, which were proposed by Government and agreed by Eurostat in 1999, were groupings of those historic NUTS3 regions.
However, the NUTS3 boundaries were amended on 21st of November 2016 under Regulation (EC) No. 2066/2016 and have come into force from Q1 2018. The LFS results have been revised according to the new groupings from Q1 2012. The changes resulting from the amendment are that County Louth has moved from the Border to the Mid-East and what was formerly South Tipperary has moved from the South-East to the Mid-West, resulting in the new NUTS2 and NUTS3 regions:
| Northern & Western NUTS2 Region | Southern NUTS2 Region | Eastern & Midland NUTS2 Region | |||
| Border | Cavan | Mid-West | Clare | Dublin | Dublin City |
| Donegal | Limerick | Dun Laoghaire-Rathdown | |||
| Leitrim | Tipperary | Fingal | |||
| Monaghan | South Dublin | ||||
| Sligo | |||||
| South-East | Carlow | Mid-East | Kildare | ||
| West | Galway | Kilkenny | Meath | ||
| Mayo | Waterford | Wicklow | |||
| Roscommon | Wexford | Louth | |||
| Midland | Laois | ||||
| South-West | Cork | Longford | |||
| Kerry | Offaly | ||||
| Westmeath | |||||
Non-response occurs when households that are sampled, and that are eligible for the survey, do not provide the requested information. This can lead to biased survey estimates if specific groups within the population are over- or under-represented and if these groups behave differently with respect to the survey variables (i.e. labour market outcomes). To correct for this, the CSO has introduced a non-response adjustment into the weighting procedure for the LFS.
The adjustment involves estimating response rates or propensities to respond as functions of characteristics available for responding and non-responding households, as well as characteristics of the areas where the households are located. Basically, the design weights have to be inflated by the inverse of the response propensities in order to compensate for the loss of units in the sample.
Linking the LFS sample with the Census of Population at household level provides a set of auxiliary variables which are available for both responding and non-responding LFS households. These include a mix of personal characteristics as well as characteristics of the dwelling and location (e.g. gender, age, marital status, education, personal employment status, dwelling type, area etc.). This allows the CSO to compare responding and non-responding households with respect to the characteristics available from the Census. This auxiliary information allows the use of “response propensities” to model non-response and adjust the grossing factors to compensate for non-response.
The response propensities are calculated using a logistic regression model where the dependent variable (Y) is an indicator variable corresponding to response (if the household responded then Y=1 and if the household did not respond then Y=0) and the independent variables are the set of auxiliary variables available from the Census. The estimated response propensities are then used to form adjustment cells or strata which are made up of respondents and non-respondents with similar estimated response propensities. Respondents within each cell/stratum are then weighted by the inverse of the observed response rate in that cell. This non-response adjusted weight is then used to inflate the original survey design weight to account for non-response. This approach is referred to as response propensity classification.
Estimates for number of persons where there are less than 30 persons in a cell are too small to be considered reliable. These estimates are presented with an asterisk (*) in the relevant tables.
Where there are 30-49 persons in a cell, estimates are considered to have a wider margin of error and should be treated with caution. These cells are presented with parentheses [ ].
The Central Statistics Office wishes to thank the participating households for their co-operation in agreeing to take part in the survey and for facilitating the collection of the relevant data.
 Hide Background Notes
Scan the QR code below to view this release online or go to
http://www.cso.ie/en/releasesandpublications/er/lfsawee/lfsagencyworkeremploymentestimatesq12019/
 Show Table 1a Employees aged 15 years and over classified by Agency Worker status
 Hide Table 1a Employees aged 15 years and over classified by Agency Worker status