
| Age Males Females Gender Gap | |||
| 0 | 78.4 | 82.8 | 4.4 |
| 65 | 17.7 | 20.6 | 2.9 |
Irish Life Tables No. 16
2010-2012
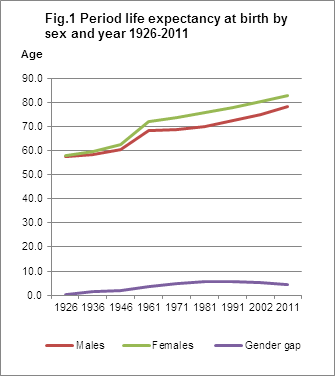
Life expectancy continues to rise for both men and women
In the period 2010-2012, life expectancy at birth was 78.4 years for males and 82.8 years for females. (See table above and tables 1, 2, 3 and fig.1).
• In the five years between 2006 and 2011 life expectancy increased by 1.6 years for males and 1.2 years for females.
• The gender gap now stands at 4.4 years, compared with the 4.8 years recorded in 2006.
• In 1926 male life expectancy was 57.4 years while it was slightly higher for females at 57.9 years. This gender gap of 0.5 years continued to increase until 1986 when it stood at 5.7 years and has been decreasing gradually since.
In 2011, the highest life expectancy at birth for males among EU member states was reported in Sweden (79.9 years). For females, France reported the highest life expectancy of 85.7 years. (See table 4).
• In 2011, Irish male life expectancy ranked in joint 10th place with Germany while Irish female life expectancy ranked 17th.
• Females had a longer life expectancy than males across all EU member states.
• The largest difference in male and female life expectancies was in Lithuania at 11.2 years while the smallest was in the Netherlands at 3.7 years.
In 2011 in Ireland a 65 year old male could expect to live another 17.7 years, an increase of 1.1 years since 2006. A 65 year old female could expect to live another 20.6 years, an increase of 0.8 years over the same period. The highest life expectancy at this age for both sexes was reported in France at 19.3 years for males and 23.8 years for females. (See tables 3, 4 and 5).
Significant improvements in life expectancy for both males and females over the past 85 years
Life expectancy at birth has increased significantly for both men and women since the first official life table was compiled in 1926. Over the 85 year period to 2011, male life expectancy increased by 21.0 years (36.6%), while female life expectancy increased by 24.9 years (43.0%).
The improvements have been as a direct result of decreasing mortality rates, particularly infant mortality rates over the period. While there has been a continual increase in life expectancy for both males and females, with increases occurring between each set of life tables, the greatest rate of improvement occurred in the 20 year period between 1946 and 1966 (8.1 years for males and 10.5 years for females). Strong gains have also been seen over the last 20 years with increases of 6.1 years for males and 4.9 years for females. (See table 3).
| The Life tables for the period 2010-2012 are based on a revised methodology (Cubic Spline model). A paper, giving the theoretical basis for this methodology, will be published by Kevin McCormack, Senior Statistician. A link to this paper will be made available on the CSO website, www.cso.ie, in due course. |
| NOTE: This is an amended version of the original release and contains minor revisions to tables 1 and 2. These revisions (effective from 01 September, 2015) are due to errors in the compilation of tables for the release. Tables were further updated on the 19\02\2016 due to changes in the calculation of the life expectancy at ages 99 years and above. |
| Table 1 Irish Life Table No. 16, male period life expectancy by age, 2010 - 2012 | ||||||||
| Age x1 | lx1 | dx1 | px1 | qx1 | Lx1 | Tx1 | e0x1,2 | Age x |
| 0 | 100,000 | 379 | 0.9962099 | 0.00379014 | 99,810 | 7,837,042 | 78.37 | 0 |
| 1 | 99,621 | 35 | 0.9996508 | 0.00034918 | 99,604 | 7,737,231 | 77.67 | 1 |
| 2 | 99,586 | 11 | 0.9998916 | 0.00010843 | 99,581 | 7,637,627 | 76.69 | 2 |
| 3 | 99,575 | 7 | 0.9999264 | 0.00007365 | 99,572 | 7,538,047 | 75.70 | 3 |
| 4 | 99,568 | 8 | 0.9999177 | 0.00008227 | 99,564 | 7,438,475 | 74.71 | 4 |
| 5 | 99,560 | 10 | 0.9998974 | 0.00010263 | 99,555 | 7,338,911 | 73.71 | 5 |
| 6 | 99,550 | 11 | 0.9998880 | 0.00011196 | 99,544 | 7,239,356 | 72.72 | 6 |
| 7 | 99,539 | 11 | 0.9998914 | 0.00010860 | 99,533 | 7,139,812 | 71.73 | 7 |
| 8 | 99,528 | 10 | 0.9999019 | 0.00009812 | 99,523 | 7,040,279 | 70.74 | 8 |
| 9 | 99,518 | 9 | 0.9999135 | 0.00008653 | 99,514 | 6,940,756 | 69.74 | 9 |
| 10 | 99,509 | 8 | 0.9999220 | 0.00007805 | 99,505 | 6,841,243 | 68.75 | 10 |
| 11 | 99,502 | 8 | 0.9999246 | 0.00007543 | 99,498 | 6,741,737 | 67.76 | 11 |
| 12 | 99,494 | 8 | 0.9999181 | 0.00008186 | 99,490 | 6,642,239 | 66.76 | 12 |
| 13 | 99,486 | 10 | 0.9998955 | 0.00010451 | 99,481 | 6,542,749 | 65.77 | 13 |
| 14 | 99,476 | 16 | 0.9998435 | 0.00015650 | 99,468 | 6,443,269 | 64.77 | 14 |
| 15 | 99,460 | 23 | 0.9997670 | 0.00023301 | 99,448 | 6,343,801 | 63.78 | 15 |
| 16 | 99,437 | 33 | 0.9996713 | 0.00032866 | 99,420 | 6,244,353 | 62.80 | 16 |
| 17 | 99,404 | 44 | 0.9995598 | 0.00044020 | 99,382 | 6,144,932 | 61.82 | 17 |
| 18 | 99,360 | 56 | 0.9994389 | 0.00056113 | 99,332 | 6,045,550 | 60.84 | 18 |
| 19 | 99,305 | 68 | 0.9993177 | 0.00068233 | 99,271 | 5,946,217 | 59.88 | 19 |
| 20 | 99,237 | 79 | 0.9992067 | 0.00079329 | 99,197 | 5,846,947 | 58.92 | 20 |
| 21 | 99,158 | 88 | 0.9991161 | 0.00088386 | 99,114 | 5,747,749 | 57.97 | 21 |
| 22 | 99,070 | 94 | 0.9990541 | 0.00094587 | 99,024 | 5,648,635 | 57.02 | 22 |
| 23 | 98,977 | 96 | 0.9990255 | 0.00097449 | 98,929 | 5,549,611 | 56.07 | 23 |
| 24 | 98,880 | 96 | 0.9990312 | 0.00096877 | 98,832 | 5,450,683 | 55.12 | 24 |
| 25 | 98,785 | 92 | 0.9990686 | 0.00093142 | 98,738 | 5,351,850 | 54.18 | 25 |
| 26 | 98,692 | 86 | 0.9991319 | 0.00086807 | 98,650 | 5,253,112 | 53.23 | 26 |
| 27 | 98,607 | 79 | 0.9992012 | 0.00079885 | 98,567 | 5,154,462 | 52.27 | 27 |
| 28 | 98,528 | 76 | 0.9992251 | 0.00077489 | 98,490 | 5,055,895 | 51.31 | 28 |
| 29 | 98,452 | 78 | 0.9992044 | 0.00079558 | 98,413 | 4,957,405 | 50.35 | 29 |
| 30 | 98,373 | 81 | 0.9991724 | 0.00082761 | 98,333 | 4,858,992 | 49.39 | 30 |
| 31 | 98,292 | 85 | 0.9991367 | 0.00086332 | 98,250 | 4,760,660 | 48.43 | 31 |
| 32 | 98,207 | 89 | 0.9990970 | 0.00090302 | 98,163 | 4,662,410 | 47.48 | 32 |
| 33 | 98,118 | 93 | 0.9990529 | 0.00094708 | 98,072 | 4,564,248 | 46.52 | 33 |
| 34 | 98,025 | 98 | 0.9990041 | 0.00099589 | 97,977 | 4,466,176 | 45.56 | 34 |
| 35 | 97,928 | 103 | 0.9989501 | 0.00104990 | 97,876 | 4,368,199 | 44.61 | 35 |
| 36 | 97,825 | 109 | 0.9988904 | 0.00110961 | 97,771 | 4,270,322 | 43.65 | 36 |
| 37 | 97,717 | 115 | 0.9988244 | 0.00117560 | 97,659 | 4,172,552 | 42.70 | 37 |
| 38 | 97,602 | 122 | 0.9987515 | 0.00124849 | 97,541 | 4,074,893 | 41.75 | 38 |
| 39 | 97,480 | 130 | 0.9986710 | 0.00132901 | 97,415 | 3,977,352 | 40.80 | 39 |
| 40 | 97,350 | 138 | 0.9985820 | 0.00141796 | 97,281 | 3,879,937 | 39.86 | 40 |
| 41 | 97,212 | 147 | 0.9984838 | 0.00151623 | 97,138 | 3,782,656 | 38.91 | 41 |
| 42 | 97,065 | 158 | 0.9983752 | 0.00162485 | 96,986 | 3,685,517 | 37.97 | 42 |
| 43 | 96,907 | 169 | 0.9982551 | 0.00174493 | 96,823 | 3,588,531 | 37.03 | 43 |
| 44 | 96,738 | 182 | 0.9981222 | 0.00187776 | 96,647 | 3,491,709 | 36.09 | 44 |
| 45 | 96,556 | 196 | 0.9979752 | 0.00202476 | 96,459 | 3,395,062 | 35.16 | 45 |
| 46 | 96,361 | 211 | 0.9978125 | 0.00218754 | 96,255 | 3,298,603 | 34.23 | 46 |
| 47 | 96,150 | 228 | 0.9976321 | 0.00236788 | 96,036 | 3,202,348 | 33.31 | 47 |
| 48 | 95,922 | 246 | 0.9974322 | 0.00256781 | 95,799 | 3,106,311 | 32.38 | 48 |
| 49 | 95,676 | 267 | 0.9972104 | 0.00278959 | 95,543 | 3,010,512 | 31.47 | 49 |
| 50 | 95,409 | 290 | 0.9969642 | 0.00303577 | 95,264 | 2,914,970 | 30.55 | 50 |
| 51 | 95,120 | 315 | 0.9966908 | 0.00330920 | 94,962 | 2,819,705 | 29.64 | 51 |
| 52 | 94,805 | 343 | 0.9963869 | 0.00361308 | 94,633 | 2,724,743 | 28.74 | 52 |
| 53 | 94,462 | 373 | 0.9960490 | 0.00395103 | 94,276 | 2,630,110 | 27.84 | 53 |
| 54 | 94,089 | 407 | 0.9956729 | 0.00432707 | 93,885 | 2,535,834 | 26.95 | 54 |
| 55 | 93,682 | 445 | 0.9952542 | 0.00474576 | 93,460 | 2,441,949 | 26.07 | 55 |
| 56 | 93,237 | 486 | 0.9947878 | 0.00521218 | 92,994 | 2,348,489 | 25.19 | 56 |
| 57 | 92,751 | 532 | 0.9942679 | 0.00573206 | 92,485 | 2,255,495 | 24.32 | 57 |
| 58 | 92,220 | 582 | 0.9936882 | 0.00631181 | 91,929 | 2,163,009 | 23.45 | 58 |
| 59 | 91,638 | 638 | 0.9930414 | 0.00695864 | 91,319 | 2,071,081 | 22.60 | 59 |
| 60 | 91,000 | 699 | 0.9923194 | 0.00768060 | 90,650 | 1,979,762 | 21.76 | 60 |
| 61 | 90,301 | 766 | 0.9915132 | 0.00848676 | 89,918 | 1,889,112 | 20.92 | 61 |
| 62 | 89,535 | 840 | 0.9906128 | 0.00938724 | 89,114 | 1,799,194 | 20.09 | 62 |
| 63 | 88,694 | 922 | 0.9896066 | 0.01039338 | 88,233 | 1,710,079 | 19.28 | 63 |
| 64 | 87,772 | 1011 | 0.9884821 | 0.01151787 | 87,267 | 1,621,846 | 18.48 | 64 |
| 65 | 86,761 | 1108 | 0.9872251 | 0.01277488 | 86,207 | 1,534,579 | 17.69 | 65 |
| 66 | 85,653 | 1215 | 0.9858197 | 0.01418025 | 85,046 | 1,448,372 | 16.91 | 66 |
| 67 | 84,438 | 1330 | 0.9842484 | 0.01575163 | 83,773 | 1,363,327 | 16.15 | 67 |
| 68 | 83,108 | 1455 | 0.9824913 | 0.01750868 | 82,381 | 1,279,553 | 15.40 | 68 |
| 69 | 81,653 | 1590 | 0.9805267 | 0.01947326 | 80,858 | 1,197,172 | 14.66 | 69 |
| 70 | 80,063 | 1735 | 0.9783303 | 0.02166966 | 79,196 | 1,116,314 | 13.94 | 70 |
| 71 | 78,328 | 1890 | 0.9758752 | 0.02412482 | 77,383 | 1,037,119 | 13.24 | 71 |
| 72 | 76,439 | 2054 | 0.9731315 | 0.02686850 | 75,412 | 959,735 | 12.56 | 72 |
| 73 | 74,385 | 2227 | 0.9700664 | 0.02993361 | 73,271 | 884,323 | 11.89 | 73 |
| 74 | 72,158 | 2407 | 0.9666436 | 0.03335637 | 70,955 | 811,052 | 11.24 | 74 |
| 75 | 69,751 | 2593 | 0.9628235 | 0.03717654 | 68,455 | 740,097 | 10.61 | 75 |
| 76 | 67,158 | 2783 | 0.9585623 | 0.04143771 | 65,767 | 671,643 | 10.00 | 76 |
| 77 | 64,375 | 2973 | 0.9538126 | 0.04618738 | 62,889 | 605,876 | 9.41 | 77 |
| 78 | 61,402 | 3161 | 0.9485227 | 0.05147726 | 59,822 | 542,987 | 8.84 | 78 |
| 79 | 58,241 | 3341 | 0.9426367 | 0.05736325 | 56,571 | 483,166 | 8.30 | 79 |
| 80 | 54,900 | 3508 | 0.9360944 | 0.06390562 | 53,146 | 426,595 | 7.77 | 80 |
| 81 | 51,392 | 3657 | 0.9288311 | 0.07116888 | 49,563 | 373,449 | 7.27 | 81 |
| 82 | 47,734 | 3782 | 0.9207783 | 0.07922174 | 45,844 | 323,886 | 6.79 | 82 |
| 83 | 43,953 | 3874 | 0.9118632 | 0.08813676 | 42,016 | 278,042 | 6.33 | 83 |
| 84 | 40,079 | 3927 | 0.9020100 | 0.09799000 | 38,115 | 236,027 | 5.89 | 84 |
| 85 | 36,152 | 3935 | 0.8911396 | 0.10886036 | 34,184 | 197,912 | 5.47 | 85 |
| 86 | 32,216 | 3893 | 0.8791713 | 0.12082873 | 30,270 | 163,728 | 5.08 | 86 |
| 87 | 28,323 | 3795 | 0.8660231 | 0.13397686 | 26,426 | 133,458 | 4.71 | 87 |
| 88 | 24,529 | 3640 | 0.8516141 | 0.14838593 | 22,709 | 107,032 | 4.36 | 88 |
| 89 | 20,889 | 3429 | 0.8358652 | 0.16413475 | 19,175 | 84,323 | 4.04 | 89 |
| 90 | 17,460 | 3166 | 0.8187025 | 0.18129754 | 15,878 | 65,148 | 3.73 | 90 |
| 91 | 14,295 | 2858 | 0.8000588 | 0.19994125 | 12,866 | 49,271 | 3.45 | 91 |
| 92 | 11,437 | 2517 | 0.7798775 | 0.22012245 | 10,178 | 36,405 | 3.18 | 92 |
| 93 | 8,919 | 2157 | 0.7581164 | 0.24188361 | 7,841 | 26,227 | 2.94 | 93 |
| 94 | 6,762 | 1794 | 0.7347512 | 0.26524880 | 5,865 | 18,386 | 2.72 | 94 |
| 95 | 4,968 | 1442 | 0.7097812 | 0.29021876 | 4,247 | 12,521 | 2.52 | 95 |
| 96 | 3,526 | 1117 | 0.6832348 | 0.31676523 | 2,968 | 8,274 | 2.35 | 96 |
| 97 | 2,409 | 831 | 0.6551755 | 0.34482447 | 1,994 | 5,306 | 2.20 | 97 |
| 98 | 1,579 | 580 | 0.6324683 | 0.36753170 | 1,288 | 3,312 | 2.10 | 98 |
| 99 | 998 | 350 | 0.6491586 | 0.35084135 | 823 | 2,024 | 2.03 | 99 |
| 100 | 648 | 196 | 0.6968287 | 0.30317131 | 550 | 1,200 | 1.85 | 100 |
| 101 | 452 | 172 | 0.6197644 | 0.38023555 | 366 | 650 | 1.44 | 101 |
| 102 | 280 | 204 | 0.2727366 | 0.72726337 | 178 | 285 | 1.02 | 102 |
| 103 | 76 | 40 | 0.4811619 | 0.51883813 | 57 | 107 | 1.40 | 103 |
| 104 | 37 | 5 | 0.8630853 | 0.13691468 | 34 | 50 | 1.36 | 104 |
| 105 | 32 | 32 | 0.9595670 | 0.04043304 | 16 | 16 | 0.50 | 105 |
| 1See below and background notes. | ||||||||
| x the exact age of the person, that is on his or her birthday. | ||||||||
| lx the number of persons surviving to exact age x out of the original 100,000 aged 0. | ||||||||
| dx the number of deaths in the year of age x to x+1 out of lx persons who enter that year. | ||||||||
| px the probability of surviving a year, or the ratio of the number completing the year of age x to x+1 to the number entering on the year. | ||||||||
| qx the rate of mortality, the probability of dying in a year, or the ratio of the number of deaths in the year of age x to x+1 to the number entering on the year. | ||||||||
| Lx the population to be expected according to the Life Table aged between x and x+1 years, assuming deaths occur evenly over the year. | ||||||||
| Tx the expected number of person years to be lived by the survivors at age x. | ||||||||
| 2e0x life expectancy at age x for each person surviving, or the total future life time in years which will on average be passed through by persons aged exactly x. | ||||||||
| Table 2 Irish Life Table No. 16, female period life expectancy by age, 2010 - 2012 | ||||||||
| Age x1 | lx1 | dx1 | px1 | qx1 | Lx1 | Tx1 | e0x1,2 | Age x |
| 0 | 100,000 | 329 | 0.9967098 | 0.00329021 | 99,835 | 8,275,177 | 82.75 | 0 |
| 1 | 99,671 | 68 | 0.9993223 | 0.00067768 | 99,637 | 8,175,342 | 82.02 | 1 |
| 2 | 99,603 | 9 | 0.9999110 | 0.00008903 | 99,599 | 8,075,705 | 81.08 | 2 |
| 3 | 99,595 | 6 | 0.9999373 | 0.00006267 | 99,591 | 7,976,106 | 80.09 | 3 |
| 4 | 99,588 | 7 | 0.9999338 | 0.00006623 | 99,585 | 7,876,514 | 79.09 | 4 |
| 5 | 99,582 | 8 | 0.9999236 | 0.00007639 | 99,578 | 7,776,929 | 78.10 | 5 |
| 6 | 99,574 | 7 | 0.9999278 | 0.00007218 | 99,571 | 7,677,351 | 77.10 | 6 |
| 7 | 99,567 | 6 | 0.9999424 | 0.00005760 | 99,564 | 7,577,781 | 76.11 | 7 |
| 8 | 99,561 | 5 | 0.9999505 | 0.00004953 | 99,559 | 7,478,217 | 75.11 | 8 |
| 9 | 99,556 | 5 | 0.9999524 | 0.00004755 | 99,554 | 7,378,658 | 74.12 | 9 |
| 10 | 99,552 | 5 | 0.9999499 | 0.00005006 | 99,549 | 7,279,104 | 73.12 | 10 |
| 11 | 99,547 | 6 | 0.9999433 | 0.00005671 | 99,544 | 7,179,555 | 72.12 | 11 |
| 12 | 99,541 | 7 | 0.9999321 | 0.00006790 | 99,538 | 7,080,011 | 71.13 | 12 |
| 13 | 99,534 | 8 | 0.9999157 | 0.00008434 | 99,530 | 6,980,474 | 70.13 | 13 |
| 14 | 99,526 | 11 | 0.9998933 | 0.00010669 | 99,520 | 6,880,944 | 69.14 | 14 |
| 15 | 99,515 | 13 | 0.9998651 | 0.00013494 | 99,508 | 6,781,423 | 68.14 | 15 |
| 16 | 99,502 | 17 | 0.9998325 | 0.00016755 | 99,493 | 6,681,915 | 67.15 | 16 |
| 17 | 99,485 | 20 | 0.9997995 | 0.00020048 | 99,475 | 6,582,422 | 66.16 | 17 |
| 18 | 99,465 | 23 | 0.9997730 | 0.00022696 | 99,454 | 6,482,947 | 65.18 | 18 |
| 19 | 99,443 | 24 | 0.9997613 | 0.00023867 | 99,431 | 6,383,493 | 64.19 | 19 |
| 20 | 99,419 | 23 | 0.9997671 | 0.00023288 | 99,407 | 6,284,062 | 63.21 | 20 |
| 21 | 99,396 | 22 | 0.9997807 | 0.00021928 | 99,385 | 6,184,655 | 62.22 | 21 |
| 22 | 99,374 | 21 | 0.9997916 | 0.00020844 | 99,363 | 6,085,270 | 61.24 | 22 |
| 23 | 99,353 | 21 | 0.9997908 | 0.00020925 | 99,343 | 5,985,907 | 60.25 | 23 |
| 24 | 99,332 | 23 | 0.9997679 | 0.00023206 | 99,321 | 5,886,564 | 59.26 | 24 |
| 25 | 99,309 | 28 | 0.9997183 | 0.00028166 | 99,295 | 5,787,243 | 58.27 | 25 |
| 26 | 99,281 | 30 | 0.9997017 | 0.00029827 | 99,267 | 5,687,948 | 57.29 | 26 |
| 27 | 99,252 | 24 | 0.9997548 | 0.00024517 | 99,240 | 5,588,681 | 56.31 | 27 |
| 28 | 99,227 | 23 | 0.9997668 | 0.00023316 | 99,216 | 5,489,442 | 55.32 | 28 |
| 29 | 99,204 | 25 | 0.9997440 | 0.00025599 | 99,192 | 5,390,226 | 54.33 | 29 |
| 30 | 99,179 | 28 | 0.9997127 | 0.00028726 | 99,165 | 5,291,035 | 53.35 | 30 |
| 31 | 99,150 | 32 | 0.9996784 | 0.00032159 | 99,134 | 5,191,870 | 52.36 | 31 |
| 32 | 99,118 | 36 | 0.9996408 | 0.00035920 | 99,101 | 5,092,736 | 51.38 | 32 |
| 33 | 99,083 | 40 | 0.9995997 | 0.00040035 | 99,063 | 4,993,635 | 50.40 | 33 |
| 34 | 99,043 | 44 | 0.9995547 | 0.00044528 | 99,021 | 4,894,572 | 49.42 | 34 |
| 35 | 98,999 | 49 | 0.9995057 | 0.00049429 | 98,975 | 4,795,551 | 48.44 | 35 |
| 36 | 98,950 | 54 | 0.9994523 | 0.00054769 | 98,923 | 4,696,576 | 47.46 | 36 |
| 37 | 98,896 | 60 | 0.9993942 | 0.00060581 | 98,866 | 4,597,653 | 46.49 | 37 |
| 38 | 98,836 | 66 | 0.9993310 | 0.00066900 | 98,803 | 4,498,787 | 45.52 | 38 |
| 39 | 98,770 | 73 | 0.9992623 | 0.00073767 | 98,733 | 4,399,984 | 44.55 | 39 |
| 40 | 98,697 | 80 | 0.9991878 | 0.00081224 | 98,657 | 4,301,251 | 43.58 | 40 |
| 41 | 98,617 | 88 | 0.9991068 | 0.00089320 | 98,573 | 4,202,594 | 42.62 | 41 |
| 42 | 98,529 | 97 | 0.9990189 | 0.00098106 | 98,480 | 4,104,021 | 41.65 | 42 |
| 43 | 98,432 | 106 | 0.9989236 | 0.00107639 | 98,379 | 4,005,540 | 40.69 | 43 |
| 44 | 98,326 | 116 | 0.9988201 | 0.00117985 | 98,268 | 3,907,161 | 39.74 | 44 |
| 45 | 98,210 | 127 | 0.9987079 | 0.00129214 | 98,147 | 3,808,893 | 38.78 | 45 |
| 46 | 98,083 | 139 | 0.9985859 | 0.00141406 | 98,014 | 3,710,746 | 37.83 | 46 |
| 47 | 97,945 | 151 | 0.9984535 | 0.00154649 | 97,869 | 3,612,732 | 36.89 | 47 |
| 48 | 97,793 | 165 | 0.9983096 | 0.00169041 | 97,710 | 3,514,863 | 35.94 | 48 |
| 49 | 97,628 | 180 | 0.9981531 | 0.00184695 | 97,538 | 3,417,153 | 35.00 | 49 |
| 50 | 97,447 | 197 | 0.9979827 | 0.00201734 | 97,349 | 3,319,615 | 34.07 | 50 |
| 51 | 97,251 | 214 | 0.9977970 | 0.00220300 | 97,144 | 3,222,266 | 33.13 | 51 |
| 52 | 97,037 | 233 | 0.9975945 | 0.00240550 | 96,920 | 3,125,122 | 32.21 | 52 |
| 53 | 96,803 | 254 | 0.9973733 | 0.00262665 | 96,676 | 3,028,202 | 31.28 | 53 |
| 54 | 96,549 | 277 | 0.9971315 | 0.00286847 | 96,411 | 2,931,526 | 30.36 | 54 |
| 55 | 96,272 | 302 | 0.9968667 | 0.00313326 | 96,121 | 2,835,116 | 29.45 | 55 |
| 56 | 95,970 | 329 | 0.9965764 | 0.00342364 | 95,806 | 2,738,995 | 28.54 | 56 |
| 57 | 95,642 | 358 | 0.9962574 | 0.00374259 | 95,463 | 2,643,189 | 27.64 | 57 |
| 58 | 95,284 | 390 | 0.9959065 | 0.00409351 | 95,089 | 2,547,726 | 26.74 | 58 |
| 59 | 94,894 | 425 | 0.9955197 | 0.00448027 | 94,681 | 2,452,637 | 25.85 | 59 |
| 60 | 94,469 | 464 | 0.9950927 | 0.00490733 | 94,237 | 2,357,956 | 24.96 | 60 |
| 61 | 94,005 | 506 | 0.9946202 | 0.00537978 | 93,752 | 2,263,719 | 24.08 | 61 |
| 62 | 93,499 | 552 | 0.9940965 | 0.00590350 | 93,223 | 2,169,966 | 23.21 | 62 |
| 63 | 92,947 | 603 | 0.9935148 | 0.00648522 | 92,646 | 2,076,743 | 22.34 | 63 |
| 64 | 92,345 | 659 | 0.9928673 | 0.00713274 | 92,015 | 1,984,097 | 21.49 | 64 |
| 65 | 91,686 | 720 | 0.9921449 | 0.00785509 | 91,326 | 1,892,082 | 20.64 | 65 |
| 66 | 90,966 | 788 | 0.9913373 | 0.00866270 | 90,572 | 1,800,756 | 19.80 | 66 |
| 67 | 90,178 | 863 | 0.9904323 | 0.00956770 | 89,746 | 1,710,184 | 18.96 | 67 |
| 68 | 89,315 | 945 | 0.9894158 | 0.01058422 | 88,842 | 1,620,438 | 18.14 | 68 |
| 69 | 88,370 | 1036 | 0.9882713 | 0.01172873 | 87,851 | 1,531,596 | 17.33 | 69 |
| 70 | 87,333 | 1137 | 0.9869795 | 0.01302048 | 86,765 | 1,443,744 | 16.53 | 70 |
| 71 | 86,196 | 1248 | 0.9855180 | 0.01448204 | 85,572 | 1,356,980 | 15.74 | 71 |
| 72 | 84,948 | 1371 | 0.9838601 | 0.01613991 | 84,262 | 1,271,408 | 14.97 | 72 |
| 73 | 83,577 | 1506 | 0.9819747 | 0.01802525 | 82,823 | 1,187,146 | 14.20 | 73 |
| 74 | 82,070 | 1656 | 0.9798252 | 0.02017484 | 81,242 | 1,104,322 | 13.46 | 74 |
| 75 | 80,414 | 1820 | 0.9773679 | 0.02263211 | 79,504 | 1,023,080 | 12.72 | 75 |
| 76 | 78,594 | 2000 | 0.9745515 | 0.02544851 | 77,594 | 943,576 | 12.01 | 76 |
| 77 | 76,594 | 2197 | 0.9713149 | 0.02868506 | 75,496 | 865,981 | 11.31 | 77 |
| 78 | 74,397 | 2412 | 0.9675857 | 0.03241428 | 73,191 | 790,485 | 10.63 | 78 |
| 79 | 71,986 | 2643 | 0.9632775 | 0.03672246 | 70,664 | 717,294 | 9.96 | 79 |
| 80 | 69,342 | 2892 | 0.9582954 | 0.04170456 | 67,896 | 646,630 | 9.33 | 80 |
| 81 | 66,450 | 3153 | 0.9525514 | 0.04744857 | 64,874 | 578,734 | 8.71 | 81 |
| 82 | 63,297 | 3421 | 0.9459559 | 0.05404413 | 61,587 | 513,860 | 8.12 | 82 |
| 83 | 59,877 | 3687 | 0.9384176 | 0.06158239 | 58,033 | 452,273 | 7.55 | 83 |
| 84 | 56,189 | 3942 | 0.9298475 | 0.07015253 | 54,218 | 394,240 | 7.02 | 84 |
| 85 | 52,247 | 4171 | 0.9201629 | 0.07983711 | 50,162 | 340,022 | 6.51 | 85 |
| 86 | 48,076 | 4361 | 0.9092936 | 0.09070642 | 45,896 | 289,860 | 6.03 | 86 |
| 87 | 43,715 | 4494 | 0.8971883 | 0.10281166 | 41,468 | 243,964 | 5.58 | 87 |
| 88 | 39,221 | 4557 | 0.8838228 | 0.11617723 | 36,943 | 202,496 | 5.16 | 88 |
| 89 | 34,664 | 4534 | 0.8692074 | 0.13079261 | 32,397 | 165,554 | 4.78 | 89 |
| 90 | 30,130 | 4417 | 0.8533959 | 0.14660408 | 27,922 | 133,156 | 4.42 | 90 |
| 91 | 25,713 | 4204 | 0.8364927 | 0.16350730 | 23,611 | 105,235 | 4.09 | 91 |
| 92 | 21,509 | 3900 | 0.8186587 | 0.18134133 | 19,559 | 81,623 | 3.79 | 92 |
| 93 | 17,608 | 3520 | 0.8001149 | 0.19988514 | 15,849 | 62,065 | 3.52 | 93 |
| 94 | 14,089 | 3083 | 0.7811427 | 0.21885730 | 12,547 | 46,216 | 3.28 | 94 |
| 95 | 11,005 | 2618 | 0.7620805 | 0.23791952 | 9,696 | 33,669 | 3.06 | 95 |
| 96 | 8,387 | 2153 | 0.7433158 | 0.25668423 | 7,311 | 23,973 | 2.86 | 96 |
| 97 | 6,234 | 1713 | 0.7252739 | 0.27472613 | 5,378 | 16,662 | 2.67 | 97 |
| 98 | 4,521 | 1318 | 0.7084032 | 0.29159681 | 3,862 | 11,285 | 2.50 | 98 |
| 99 | 3,203 | 983 | 0.6930682 | 0.30693179 | 2,711 | 7,422 | 2.32 | 99 |
| 100 | 2,220 | 718 | 0.6767526 | 0.32324744 | 1,861 | 4,711 | 2.12 | 100 |
| 101 | 1,502 | 521 | 0.6531123 | 0.34688766 | 1,242 | 2,850 | 1.90 | 101 |
| 102 | 981 | 378 | 0.6142550 | 0.38574501 | 792 | 1,608 | 1.64 | 102 |
| 103 | 603 | 272 | 0.5495238 | 0.45047618 | 467 | 816 | 1.35 | 103 |
| 104 | 331 | 148 | 0.5540559 | 0.44594407 | 257 | 349 | 1.05 | 104 |
| 105 | 184 | 184 | 0.8898570 | 0.11014299 | 92 | 92 | 0.50 | 105 |
| x the exact age of the person, that is on his or her birthday. | ||||||||
| lx the number of persons surviving to exact age x out of the original 100,000 aged 0. | ||||||||
| dx the number of deaths in the year of age x to x+1 out of lx persons who enter that year. | ||||||||
| px the probability of surviving a year, or the ratio of the number completing the year of age x to x+1 to the number entering on the year. | ||||||||
| qx the rate of mortality, the probability of dying in a year, or the ratio of the number of deaths in the year of age x to x+1 to the number entering on the year. | ||||||||
| Lx the population to be expected according to the Life Table aged between x and x+1 years, assuming deaths occur evenly over the year. | ||||||||
| Tx the expected number of person years to be lived by the survivors at age x. | ||||||||
| 2e0x life expectancy at age x for each person surviving, or the total future life time in years which will on average be passed through by persons aged exactly x. | ||||||||
| Table 3 Period life expectancy at various ages, 1871-2011 | ||||||||||||
| Years | ||||||||||||
| Irish Life Table No. | Period | Age in years | ||||||||||
| 0 | 5 | 10 | 15 | 20 | 25 | 35 | 45 | 55 | 65 | 75 | ||
| Males | ||||||||||||
| 1870-72 | 49.6 | .. | .. | 46.8 | .. | 39.0 | 31.8 | 24.4 | 17.5 | 11.1 | 6.5 | |
| 1881-83 | 49.4 | .. | .. | 46.0 | .. | 38.1 | 30.7 | 23.4 | 16.7 | 10.8 | 6.3 | |
| 1890-92 | 49.1 | .. | .. | 45.8 | .. | 37.8 | 30.6 | 23.4 | 16.5 | 10.5 | 5.8 | |
| 1900-02 | 49.3 | .. | .. | 46.2 | .. | 38.2 | 31.0 | 23.8 | 16.9 | 10.8 | 5.8 | |
| 1910-12 | 53.6 | .. | .. | 49.2 | .. | 41.0 | 33.5 | 25.9 | 18.9 | 13.0 | 8.0 | |
| 1 | 1925-27 | 57.4 | 59.5 | 55.2 | 50.7 | 46.4 | 42.4 | 34.4 | 26.5 | 19.1 | 12.8 | 7.7 |
| 2 | 1935-37 | 58.2 | 60.1 | 55.8 | 51.2 | 46.8 | 42.7 | 34.4 | 26.3 | 18.8 | 12.5 | 7.9 |
| 3 | 1940-42 | 59.0 | 60.7 | 56.3 | 51.6 | 47.2 | 43.1 | 34.8 | 26.5 | 18.8 | 12.3 | 7.3 |
| 4 | 1945-47 | 60.5 | 61.5 | 56.9 | 52.2 | 47.8 | 43.5 | 34.9 | 26.4 | 18.6 | 12.0 | 6.9 |
| 5 | 1950-52 | 64.5 | 63.6 | 58.8 | 54.0 | 49.3 | 44.8 | 35.8 | 27.0 | 19.0 | 12.1 | 6.8 |
| 6 | 1960-62 | 68.1 | 65.7 | 60.8 | 56.0 | 51.1 | 46.4 | 37.0 | 27.8 | 19.5 | 12.6 | 7.1 |
| 7 | 1965-67 | 68.6 | 65.7 | 60.8 | 56.0 | 51.2 | 46.4 | 36.9 | 27.7 | 19.3 | 12.4 | 7.3 |
| 8 | 1970-72 | 68.8 | 65.5 | 60.6 | 55.7 | 51.0 | 46.3 | 36.8 | 27.6 | 19.3 | 12.4 | 7.3 |
| 9 | 1978-80 | 69.5 | 65.7 | 60.8 | 55.9 | 51.1 | 46.4 | 36.9 | 27.7 | 19.3 | 12.4 | 7.1 |
| 10 | 1980-82 | 70.1 | 66.1 | 61.3 | 56.4 | 51.6 | 46.9 | 37.3 | 28.1 | 19.6 | 12.6 | 7.3 |
| 11 | 1985-87 | 71.0 | 66.8 | 61.9 | 57.0 | 52.2 | 47.4 | 37.9 | 28.5 | 19.8 | 12.6 | 7.3 |
| 12 | 1990-92 | 72.3 | 68.0 | 63.1 | 58.2 | 53.4 | 48.6 | 39.2 | 29.7 | 20.9 | 13.4 | 7.8 |
| 13 | 1995-97 | 73.0 | 68.6 | 63.6 | 58.7 | 53.9 | 49.3 | 39.8 | 30.4 | 21.5 | 13.8 | 8.0 |
| 14 | 2001-03 | 75.1 | 70.7 | 65.7 | 60.8 | 56.0 | 51.3 | 41.8 | 32.3 | 23.4 | 15.4 | 8.9 |
| 15 | 2005-07 | 76.8 | 72.2 | 67.2 | 62.3 | 57.5 | 52.8 | 43.3 | 33.8 | 24.8 | 16.6 | 9.8 |
| 16 | 2010-12 | 78.4 | 73.7 | 68.8 | 63.8 | 58.9 | 54.2 | 44.6 | 35.2 | 26.1 | 17.7 | 10.6 |
| Females | ||||||||||||
| 1870-72 | 50.9 | .. | .. | 47.7 | .. | 39.8 | 32.4 | 25.0 | 17.7 | 11.2 | 6.6 | |
| 1881-83 | 49.9 | .. | .. | 46.2 | .. | 38.3 | 31.0 | 23.7 | 16.7 | 10.7 | 6.3 | |
| 1890-92 | 49.2 | .. | .. | 45.5 | .. | 37.7 | 30.5 | 23.2 | 16.2 | 10.3 | 5.9 | |
| 1900-02 | 49.6 | .. | .. | 46.2 | .. | 38.3 | 30.9 | 23.7 | 16.7 | 10.6 | 5.9 | |
| 1910-12 | 54.1 | .. | .. | 49.4 | .. | 41.4 | 33.8 | 26.4 | 19.2 | 13.4 | 8.2 | |
| 1 | 1925-27 | 57.9 | 59.2 | 54.9 | 50.5 | 46.4 | 42.4 | 34.7 | 27.0 | 19.6 | 13.4 | 8.4 |
| 2 | 1935-37 | 59.6 | 60.4 | 56.1 | 51.6 | 47.3 | 43.2 | 35.2 | 27.2 | 19.6 | 13.1 | 8.4 |
| 3 | 1940-42 | 61.0 | 61.4 | 56.9 | 52.4 | 48.0 | 44.0 | 35.8 | 27.6 | 19.8 | 13.2 | 8.1 |
| 4 | 1945-47 | 62.4 | 62.5 | 57.9 | 53.2 | 48.8 | 44.7 | 36.3 | 28.0 | 20.1 | 13.1 | 7.7 |
| 5 | 1950-52 | 67.1 | 65.4 | 60.6 | 55.8 | 51.2 | 46.6 | 37.7 | 28.9 | 20.6 | 13.3 | 7.6 |
| 6 | 1960-62 | 71.9 | 69.0 | 64.1 | 59.2 | 54.3 | 49.5 | 39.9 | 30.7 | 22.1 | 14.4 | 8.1 |
| 7 | 1965-67 | 72.9 | 69.6 | 64.8 | 59.8 | 54.9 | 50.1 | 40.4 | 31.1 | 22.4 | 14.7 | 8.4 |
| 8 | 1970-72 | 73.5 | 70.0 | 65.1 | 60.2 | 55.3 | 50.5 | 40.8 | 31.4 | 22.7 | 15.0 | 8.5 |
| 9 | 1978-80 | 75.0 | 71.0 | 66.1 | 61.1 | 56.2 | 51.4 | 41.6 | 32.1 | 23.3 | 15.4 | 8.8 |
| 10 | 1980-82 | 75.6 | 71.5 | 66.6 | 61.7 | 56.8 | 51.9 | 42.1 | 32.6 | 23.7 | 15.7 | 9.1 |
| 11 | 1985-87 | 76.7 | 72.4 | 67.5 | 62.5 | 57.6 | 52.7 | 42.9 | 33.3 | 24.3 | 16.2 | 9.5 |
| 12 | 1990-92 | 77.9 | 73.5 | 68.6 | 63.6 | 58.7 | 53.8 | 44.0 | 34.5 | 25.4 | 17.1 | 10.2 |
| 13 | 1995-97 | 78.5 | 74.1 | 69.1 | 64.2 | 59.3 | 54.4 | 44.6 | 35.0 | 25.8 | 17.4 | 10.4 |
| 14 | 2001-03 | 80.3 | 75.7 | 70.8 | 65.8 | 60.9 | 56.0 | 46.2 | 36.6 | 27.4 | 18.7 | 11.2 |
| 15 | 2005-07 | 81.6 | 76.9 | 72.0 | 67.0 | 62.1 | 57.2 | 47.4 | 37.7 | 28.5 | 19.8 | 12.1 |
| 16 | 2010-12 | 82.8 | 78.1 | 73.1 | 68.1 | 63.2 | 58.3 | 48.4 | 38.8 | 29.5 | 20.6 | 12.7 |
| 1871-1911 data from the Report on the Commission on Emigration and other Population Problems 1948-1954. | ||||||||||||
| ..Data not available. | ||||||||||||
| Table 4 Period life expectancy in 2011 by sex, age and country | ||||||||
| Years | ||||||||
| Age | ||||||||
| 0 | 15 | 30 | 45 | 55 | 65 | 75 | 85 | |
| Males | ||||||||
| SE Sweden | 79.9 | 65.2 | 50.6 | 36.2 | 27.0 | 18.5 | 11.1 | 5.7 |
| IT Italy | 79.7 | 65.1 | 50.5 | 36.1 | 26.9 | 18.5 | 11.2 | 6.0 |
| ES Spain | 79.5 | 64.9 | 50.2 | 35.8 | 26.9 | 18.8 | 11.7 | 6.5 |
| NL Netherlands | 79.4 | 64.8 | 50.1 | 35.7 | 26.5 | 18.1 | 10.9 | 5.9 |
| CY Cyprus | 79.3 | 64.7 | 50.2 | 35.9 | 26.8 | 18.2 | 10.8 | 5.3 |
| UK United Kingdom | 79.0 | 64.5 | 49.9 | 35.7 | 26.7 | 18.5 | 11.5 | 6.3 |
| FR France | 78.7 | 64.1 | 49.7 | 35.6 | 27.0 | 19.3 | 12.2 | 6.9 |
| MT Malta | 78.6 | 64.2 | 49.7 | 35.3 | 26.1 | 17.7 | 10.6 | 6.0 |
| LU Luxembourg (Grand-Duché) | 78.5 | 64.0 | 49.4 | 34.8 | 25.8 | 17.8 | 10.9 | 5.6 |
| DE Germany (including ex-GDR from 1991) | 78.4 | 63.8 | 49.2 | 34.9 | 26.0 | 18.2 | 11.3 | 6.7 |
| IE Ireland | 78.4 | 63.8 | 49.4 | 35.2 | 26.1 | 17.7 | 10.6 | 5.5 |
| AT Austria | 78.3 | 63.7 | 49.3 | 34.9 | 26.0 | 18.1 | 11.2 | 6.1 |
| BE Belgium | 78.0 | 63.4 | 49.0 | 34.7 | 25.8 | 18.0 | 11.1 | 6.1 |
| GR Greece | 78.0 | 63.4 | 49.0 | 34.9 | 26.1 | 18.2 | 11.2 | 6.2 |
| DK Denmark | 77.8 | 63.2 | 48.5 | 34.2 | 25.3 | 17.3 | 10.5 | 5.6 |
| PT Portugal | 77.3 | 62.7 | 48.2 | 34.2 | 25.7 | 17.8 | 10.8 | 5.9 |
| FI Finland | 77.3 | 62.7 | 48.3 | 34.2 | 25.5 | 17.7 | 10.9 | 5.9 |
| SL Slovenia | 76.8 | 62.2 | 47.6 | 33.4 | 24.6 | 16.9 | 10.4 | 5.8 |
| CZ Czech Republic | 74.8 | 60.2 | 45.7 | 31.5 | 22.9 | 15.6 | 9.6 | 5.2 |
| HR Croatia | 73.8 | 59.3 | 44.9 | 30.8 | 22.2 | 15.1 | 9.0 | 5.0 |
| PL Poland | 72.5 | 58.1 | 43.8 | 30.1 | 22.1 | 15.4 | 9.8 | 5.7 |
| SK Slovak Republic | 72.3 | 57.9 | 43.5 | 29.6 | 21.4 | 14.5 | 8.9 | 5.2 |
| EE Estonia | 71.4 | 56.8 | 42.7 | 29.4 | 21.4 | 14.8 | 9.4 | 5.5 |
| HU Hungary | 71.2 | 56.7 | 42.2 | 28.1 | 20.4 | 14.3 | 9.2 | 5.7 |
| RO Romania | 70.8 | 56.9 | 42.6 | 28.8 | 21.1 | 14.5 | 9.0 | 5.2 |
| BG Bulgaria | 70.7 | 56.7 | 42.4 | 28.5 | 20.5 | 14.0 | 8.5 | 4.8 |
| LV Latvia | 68.6 | 54.3 | 40.2 | 27.1 | 19.6 | 13.4 | 8.7 | 5.4 |
| LT Lithuania | 68.1 | 53.7 | 39.8 | 27.1 | 19.8 | 14.0 | 9.1 | 5.3 |
| Females | ||||||||
| FR France | 85.7 | 71.1 | 56.3 | 41.8 | 32.6 | 23.8 | 15.5 | 8.8 |
| ES Spain | 85.6 | 71.0 | 56.1 | 41.5 | 32.1 | 23.0 | 14.5 | 7.9 |
| IT Italy | 84.8 | 70.2 | 55.3 | 40.7 | 31.2 | 22.2 | 14.0 | 7.5 |
| AT Austria | 83.8 | 69.2 | 54.4 | 39.8 | 30.5 | 21.7 | 13.6 | 7.3 |
| PT Portugal | 83.8 | 69.2 | 54.4 | 39.8 | 30.5 | 21.6 | 13.4 | 7.2 |
| FI Finland | 83.8 | 69.1 | 54.4 | 39.8 | 30.5 | 21.7 | 13.6 | 7.1 |
| SE Sweden | 83.8 | 69.1 | 54.3 | 39.6 | 30.2 | 21.3 | 13.3 | 6.8 |
| GR Greece | 83.6 | 69.0 | 54.2 | 39.6 | 30.2 | 21.2 | 12.8 | 6.7 |
| LU Luxembourg (Grand-Duché) | 83.6 | 68.9 | 54.2 | 39.5 | 30.2 | 21.6 | 13.5 | 7.3 |
| BE Belgium | 83.3 | 68.7 | 53.9 | 39.3 | 30.2 | 21.6 | 13.6 | 7.4 |
| SL Slovenia | 83.3 | 68.6 | 53.8 | 39.2 | 29.9 | 21.1 | 13.1 | 7.0 |
| DE Germany (including ex-GDR from 1991) | 83.2 | 68.6 | 53.8 | 39.2 | 29.9 | 21.2 | 13.2 | 7.0 |
| NL Netherlands | 83.1 | 68.5 | 53.6 | 39.1 | 29.8 | 21.2 | 13.3 | 7.1 |
| CY Cyprus | 83.1 | 68.4 | 53.6 | 38.9 | 29.5 | 20.3 | 11.9 | 5.8 |
| UK United Kingdom | 83.0 | 68.4 | 53.6 | 39.1 | 29.8 | 21.1 | 13.3 | 7.3 |
| MT Malta | 83.0 | 68.8 | 54.0 | 39.4 | 29.9 | 21.0 | 12.8 | 6.9 |
| IE Ireland | 82.8 | 68.1 | 53.4 | 38.8 | 29.5 | 20.6 | 12.7 | 6.5 |
| DK Denmark | 81.9 | 67.3 | 52.5 | 37.8 | 28.6 | 20.1 | 12.5 | 6.8 |
| EE Estonia | 81.3 | 66.7 | 52.0 | 37.7 | 28.6 | 20.1 | 12.4 | 6.8 |
| CZ Czech Republic | 81.1 | 66.4 | 51.6 | 37.1 | 27.8 | 19.2 | 11.7 | 6.2 |
| PL Poland | 81.1 | 66.5 | 51.8 | 37.3 | 28.2 | 19.9 | 12.4 | 6.9 |
| HR Croatia | 80.4 | 65.8 | 51.0 | 36.4 | 27.2 | 18.6 | 10.9 | 5.7 |
| SK Slovak Republic | 79.8 | 65.3 | 50.6 | 36.0 | 27.0 | 18.4 | 10.9 | 5.8 |
| LT Lithuania | 79.3 | 64.8 | 50.1 | 36.1 | 27.3 | 19.2 | 11.7 | 6.3 |
| LV Latvia | 78.8 | 64.4 | 49.7 | 35.5 | 26.7 | 18.7 | 11.5 | 6.3 |
| HU Hungary | 78.7 | 64.3 | 49.5 | 35.0 | 26.3 | 18.3 | 11.2 | 6.2 |
| RO Romania | 78.2 | 64.1 | 49.4 | 35.0 | 26.1 | 17.8 | 10.6 | 5.7 |
| BG Bulgaria | 77.8 | 63.6 | 48.9 | 34.7 | 25.7 | 17.3 | 10.0 | 5.1 |
| Table 5 Period life expectancy by sex, age, country and year | |||||||||||
| Years | |||||||||||
| Age = 0 | Age 65 | ||||||||||
| 1980 | 1990 | 2002 | 2006 | 2011 | 1980 | 1990 | 2002 | 2006 | 2011 | ||
| Males | |||||||||||
| EU15 European Union (15 countries) | 70.5 | 72.8 | 75.8 | .. | .. | 13.4 | 14.6 | 16.3 | .. | .. | |
| EU28 European Union (28 countries) | .. | .. | .. | .. | 77.3 | .. | .. | .. | .. | 17.8 | |
| SE Sweden | 72.8 | 74.8 | 77.7 | 78.8 | 79.9 | 14.3 | 15.3 | 16.9 | 17.7 | 18.5 | |
| IT Italy2 | 70.6 | 73.9 | 77.4 | 78.1 | 79.7 | 13.3 | 15.1 | 17.0 | 17.5 | 18.5 | |
| ES Spain | 72.3 | 73.4 | 76.3 | 77.7 | 79.5 | 14.6 | 15.5 | 16.9 | 17.9 | 18.8 | |
| NL Netherlands | 72.7 | 73.8 | 76.0 | 77.7 | 79.4 | 14.0 | 14.4 | 15.6 | 16.8 | 18.1 | |
| CY Cyprus | 72.3 | 74.1 | 76.4 | 78.8 | 79.3 | 14.5 | 15.8 | 16.3 | 17.7 | 18.2 | |
| UK United Kingdom | 70.2 | 72.9 | 76.0 | 77.2 | 79.0 | 12.6 | 14.0 | 16.2 | 17.2 | 18.5 | |
| FR France | 70.2 | 72.8 | 75.7 | 77.3 | 78.7 | 14.0 | 15.5 | 17.0 | 18.2 | 19.3 | |
| MT Malta | 68.0 | 73.7 | 76.3 | 77.0 | 78.6 | 10.7 | 15.4 | 15.3 | 16.1 | 17.7 | |
| LU Luxembourg (Grand-Duché) | 69.1 | 72.4 | 74.6 | 76.8 | 78.5 | 12.3 | 14.3 | 15.9 | 17.0 | 17.8 | |
| DE Germany1 | 69.6 | 72.0 | 75.7 | 77.2 | 78.4 | 12.8 | 14.0 | 16.2 | 17.2 | 18.2 | |
| IE Ireland | 70.1 | 72.3 | 75.1 | 76.8 | 78.4 | 12.6 | 13.4 | 15.4 | 16.6 | 17.7 | |
| AT Austria | 69.0 | 72.3 | 75.8 | 77.2 | 78.3 | 12.9 | 14.4 | 16.3 | 17.3 | 18.1 | |
| BE Belgium | 69.9 | 72.7 | 75.1 | 76.6 | 78.0 | 12.9 | 14.3 | 15.8 | 17.0 | 18.0 | |
| GR Greece | 73.0 | 74.7 | 76.2 | 77.2 | 78.0 | 15.2 | 15.7 | 16.6 | 17.5 | 18.2 | |
| DK Denmark | 71.2 | 72.0 | 74.8 | 76.1 | 77.8 | 13.6 | 14.0 | 15.4 | 16.2 | 17.3 | |
| PT Portugal | 67.9 | 70.6 | 73.8 | 75.5 | 77.3 | 13.1 | 14.0 | 15.7 | 16.6 | 17.8 | |
| FI Finland | 69.2 | 71.0 | 74.9 | 75.9 | 77.3 | 12.5 | 13.8 | 15.8 | 16.9 | 17.7 | |
| SL Slovenia | 67.4 | 69.8 | 72.6 | 74.5 | 76.8 | 12.6 | 13.3 | 14.5 | 15.8 | 16.9 | |
| CZ Czech Republic | 66.9 | 67.6 | 72.1 | 73.5 | 74.8 | 11.2 | 11.7 | 13.9 | 14.8 | 15.6 | |
| HR Croatia | .. | .. | .. | .. | 73.8 | .. | .. | .. | .. | 15.1 | |
| PL Poland | 66.9 | 66.3 | 70.3 | 70.9 | 72.5 | 12.4 | 12.4 | 13.9 | 14.5 | 15.4 | |
| SK Slovak Republic | 66.7 | 66.7 | 69.8 | 70.4 | 72.3 | 12.0 | 12.3 | 13.2 | 13.3 | 14.5 | |
| EE Estonia | 64.1 | 64.7 | 65.3 | 67.4 | 71.4 | 11.4 | 12.0 | 12.8 | 13.2 | 14.8 | |
| HU Hungary | 65.5 | 65.2 | 68.3 | 69.2 | 71.2 | 11.6 | 12.1 | 13.2 | 13.6 | 14.3 | |
| RO Romania | 66.6 | 66.7 | 67.3 | 69.2 | 70.8 | 12.5 | 13.2 | 12.9 | 13.6 | 14.5 | |
| BG Bulgaria | 68.4 | 68.0 | 68.8 | 69.2 | 70.7 | 12.6 | 12.7 | 13.0 | 13.2 | 14.0 | |
| LV Latvia | 63.6 | 64.3 | 64.7 | 65.4 | 68.6 | .. | 12.1 | 12.5 | 12.7 | 13.4 | |
| LT Lithuania | 65.4 | 66.5 | 66.2 | 65.3 | 68.1 | 13.4 | 13.3 | 13.3 | 13.0 | 14.0 | |
| Females | |||||||||||
| EU15 European Union (15 countries) | 77.2 | 79.4 | 81.6 | .. | .. | 17.1 | 18.4 | 19.9 | .. | .. | |
| EU28 European Union (28 countries) | .. | .. | .. | .. | 83.1 | .. | .. | .. | .. | 21.3 | |
| FR France | 78.4 | 80.9 | 83.0 | 84.4 | 85.7 | 18.2 | 19.8 | 21.3 | 22.6 | 23.8 | |
| ES Spain | 78.4 | 80.6 | 83.2 | 84.4 | 85.6 | 17.8 | 19.3 | 21.0 | 22.0 | 23.0 | |
| IT Italy2 | 77.4 | 80.4 | 83.2 | 83.7 | 84.8 | 17.1 | 18.9 | 21.0 | 21.3 | 22.2 | |
| AT Austria | 76.1 | 79.0 | 81.7 | 82.8 | 83.8 | 16.3 | 18.1 | 19.8 | 20.7 | 21.7 | |
| PT Portugal | 74.9 | 77.5 | 80.6 | 82.3 | 83.8 | 16.1 | 17.1 | 19.2 | 20.2 | 21.6 | |
| FI Finland | 77.6 | 79.0 | 81.6 | 83.1 | 83.8 | 16.5 | 17.8 | 19.8 | 21.2 | 21.7 | |
| SE Sweden | 79.0 | 80.5 | 82.1 | 83.1 | 83.8 | 18.1 | 19.1 | 20.1 | 20.9 | 21.3 | |
| GR Greece | 77.5 | 79.5 | 81.1 | 81.9 | 83.6 | 17.0 | 18.0 | 18.7 | 19.4 | 21.2 | |
| LU Luxembourg (Grand-Duché) | 75.9 | 78.7 | 81.5 | 81.9 | 83.6 | 16.0 | 18.5 | 20.0 | 20.3 | 21.6 | |
| BE Belgium | 76.7 | 79.5 | 81.2 | 82.3 | 83.3 | 16.8 | 18.8 | 19.7 | 20.6 | 21.6 | |
| SL Slovenia | 75.2 | 77.8 | 80.5 | 82.0 | 83.3 | 15.9 | 17.1 | 19.0 | 20.0 | 21.1 | |
| DE Germany1 | 76.2 | 78.5 | 81.3 | 82.4 | 83.2 | 16.3 | 17.7 | 19.6 | 20.5 | 21.2 | |
| NL Netherlands | 79.3 | 80.2 | 80.7 | 82.0 | 83.1 | 18.5 | 19.1 | 19.3 | 20.3 | 21.2 | |
| CY Cyprus | 77.0 | 78.6 | 81.0 | 82.4 | 83.1 | 16.5 | 17.5 | 19.0 | 19.7 | 20.3 | |
| UK United Kingdom | 76.2 | 78.5 | 80.6 | 81.5 | 83.0 | 16.6 | 17.9 | 19.2 | 19.9 | 21.1 | |
| MT Malta | 72.8 | 78.1 | 81.3 | 81.9 | 83.0 | 12.8 | 18.0 | 19.1 | 19.5 | 21.0 | |
| IE Ireland | 75.6 | 77.9 | 80.3 | 81.6 | 82.8 | 15.7 | 17.1 | 18.7 | 19.8 | 20.6 | |
| DK Denmark | 77.3 | 77.8 | 79.4 | 80.7 | 81.9 | 17.6 | 17.9 | 18.2 | 19.2 | 20.1 | |
| EE Estonia | 74.1 | 75.0 | 77.0 | 78.6 | 81.3 | 15.6 | 15.8 | 17.3 | 18.3 | 20.1 | |
| CZ Czech Republic | 74.0 | 75.5 | 78.7 | 79.9 | 81.1 | 14.4 | 15.3 | 17.3 | 18.3 | 19.2 | |
| PL Poland | 75.4 | 75.3 | 78.8 | 79.7 | 81.1 | 16.4 | 16.2 | 18.0 | 18.8 | 19.9 | |
| HR Croatia | .. | .. | .. | .. | 80.4 | .. | .. | .. | .. | 18.6 | |
| SK Slovak Republic | 74.4 | 75.7 | 77.7 | 78.4 | 79.8 | 15.2 | 16.0 | 16.9 | 17.3 | 18.4 | |
| LT Lithuania | 75.4 | 76.3 | 77.5 | 77.0 | 79.3 | 16.6 | 17.0 | 17.8 | 17.6 | 19.2 | |
| LV Latvia | 74.2 | 74.6 | 76.0 | 76.3 | 78.8 | .. | 15.8 | 17.0 | 17.3 | 18.7 | |
| HU Hungary | 72.8 | 73.8 | 76.7 | 77.8 | 78.7 | 14.7 | 15.4 | 17.0 | 17.7 | 18.3 | |
| RO Romania | 71.9 | 73.1 | 74.7 | 76.2 | 78.2 | 14.2 | 15.2 | 15.7 | 16.5 | 17.8 | |
| BG Bulgaria | 73.9 | 74.7 | 75.5 | 76.3 | 77.8 | 14.6 | 15.2 | 15.7 | 16.3 | 17.3 | |
| 1DEW Federal Republic of Germany (excluding ex-GDR) for 1980. | |||||||||||
| 2Figures for 2006 relate to 2005. | |||||||||||
| ..Data not available. | |||||||||||
Life Tables presented here are period life expectancies. Period expectation of life at a given age for 2010-12 is the average number of years a person would live if he or she experienced age-specific mortality rates for that time period throughout his or her life. It is therefore not the number of years someone of that age could actually expect to live because death rates are likely to change in the future.
The basic assumption is that a given cohort of births, (100,000), start in a given year. The mortality rates for each age are used to calculate how many of the cohort will reach each year of age until eventually all members of the cohort have died. This enables the total number of years lived by the cohort to be calculated. When this total is divided by the number of persons in the cohort, (100,000), the result is the average number of years lived in the cohort, or the mean expectation of life at birth. The total number of years lived by the cohort from any given age can also be calculated and, when divided by the number of survivors in the cohort entering upon that year of age, the figure obtained is the expectation of life in years for those persons.
Life Tables were constructed for males and females which are representative of the mortality experience in Ireland in 2011 by using the 2010, 2011 and 2012 estimates and census of population (usually resident) and deaths registered in the three years. The life table should reflect the normal mortality conditions at about the time of the Census.
Glossary of technical terms
x the exact age of the person, that is, on his or her birthday.
lx the number of persons surviving to exact age x out of the original 100,000 aged 0.
dx the number of deaths in the year of age x to x+1 out of lx persons who enter that year.
px the probability of surviving a year, or the ratio of the number completing the year of age x to x+1 to the number entering on the year.
qx the rate of mortality, the probability of dying in a year, or the ratio of the number of deaths in the year of age x to x+1 to the number entering on the year.
Lx the population to be expected according to the Life Table aged between x and x+1 years, assuming deaths occur evenly over the year.
Tx the expected number of person years to be lived by the survivors at age x.
e0x life expectancy at age x for each person surviving, or the total future life time in years which will on average be passed through by persons aged exactly x.
Examples
Figures from the Male Irish Life Table No. 16 are used in the examples below. Please note that totals may not add up due to rounding.
The first column of the life table, lx equals the number of persons surviving in the life table at each exact age x, in other words the January population. l0 represents the life table population of new born children or those aged exactly zero. If we let l0 equal 100,000 then for example, l5 is the number of persons surviving on their fifth birthday, which in this case equals 99,560.
The second column of the life table, dx equals the expected number of deaths of persons aged age x in the life table.
equation 1
dx= lx− lx+1
Equation 1 tells us that the number of deaths equals the number of persons surviving at age x less the number of persons surviving at age x+1.
e.g. for males aged 5
d5= l5 − l6
= 99,560 – 99,550
= 10
The third column of the life table, px equals the probability of surviving from exact age x to x+1. This is simply the ratio of those completing the year of age x to x+1 to the number entering the year. For example, p5 is the probability of surviving ones fifth year, which in this case equals 0.99990.
equation 2
px= l(x+1) / lx
Rewriting equation 2 where age x = 10, we see the number of persons surviving to their eleventh birthday equals the number of persons at their tenth birthday multiplied by the probability of their surviving to their eleventh, the remainder having of course died. Migration is ignored in a life table as the population if closed.
l11 = l10.p10
= 99,509 x 0.99992
= 99,502
The fourth column of the life table, qx equals the probability of dying between one birthday and the next. This may also be called the risk of dying in a life table year, in other words the risk of dying at a particular age. The probability of dying and the probability of survival equal unity. In other words one can only be alive or dead.
equation 3
px+ qx = 1
From equations 1, 2 and 3:
equation 4
qx= dx / lx
So the probability of dying is the ratio of the number of deaths at exact age x divided by the number of persons surviving at that exact age. Hence we say the life table is based on ‘current mortality rates only and that no assumptions are made about future changes’.
The fifth column of the life table, Lx equals the number of years survived by the life table cohort between the ages x and x+1, in other words the July population. Assuming a uniform distribution of deaths over a year of age and using equation 1 we find:
equation 5
Lx= lx− (dx / 2)
= lx − (( lx− lx+1 ) / 2)
= (lx + lx+1 ) / 2 (x>0)
e.g. for age 1 this means
L1= l1− (d1 / 2) = 99,621 – 35/2 = 99,604
or
L1= (l1+12 ) / 2= (99,621 + 99,586)/2 = 99,604
This cannot be used at age 0 as infant deaths are not evenly distributed (i.e. they are non-linear over a year). For example, in 2011 34% of all infant deaths occurred on their first day of life.
The sixth column of the life table, Tx equals the total number of years which will be survived at age x, lx. So if Lx is person years, then Tx is cumulated person years , i.e.
equation 6
Tx = x∑105Lx
e.g. T102 = L102+L103+L104+L105
The final column of the life table, e0x is the life expectancy in years
equation 7
e0x=Tx / lx
e00 represents life expectancy at birth and it is broadly used to express the level of mortality. Life expectancy is the average number of additional years a person would live if current mortality trends were to continue. The expectation of life at birth represents the mean length of life of individuals who are subjected since birth to current mortality trends. Life expectancy is usually compiled on the basis of a life table showing the probability of dying at each age for a given population according to the age specific death rates prevailing in a given period.
Further information
From equation 3 we see the link between the probability of surviving with that of dying, therefore we can make assumptions on the probability of surviving from the probability of dying. This is what is referred to in population projections as the mortality assumption.
Sx= Lx ⁄ Lx-1
The survivorship ratio at age x, Sx, equals the ratio of those surviving between ages x and x+1 and those surviving between the ages of x-1 and x, e.g. the ratio of those aged 5 – 9 surviving to age 10 -14 is calculated as follows:
S10-14 =10∑14 Lx / 5∑9 Lx
Similarly, the probability of a man aged 20 dying before his 50th birthday is calculated as follows:
qx=1−px
=1− (lx+1 ) / (lx )
= ( lx− lx+1 ) / lx
therefore
q20-50 = ( l20− l50 ) / l20
= (99,237 − 95,409) / 99,237
= 0.039 = 3.9%
 Hide Background Notes
Scan the QR code below to view this release online or go to
http://www.cso.ie/en/releasesandpublications/er/ilt/irishlifetablesno162010-2012/
 Show Table 1 Irish Life Table No. 16, male period life expectancy by age, 2010 - 2012
 Hide Table 1 Irish Life Table No. 16, male period life expectancy by age, 2010 - 2012