
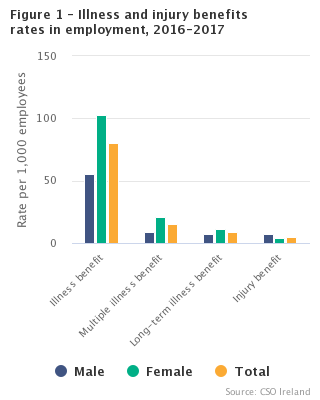
| Illness and injury benefits rates in employment, 2016-2017 | |||
| per 1,000 employees | |||
| Male | Female | Total | |
| Illness benefit rate | 55 | 103 | 80 |
| of which | |||
| Multiple illness benefit rate | 9 | 21 | 15 |
| Long-term illness benefit rate | 7 | 11 | 9 |
| Injury benefit rate | 7 | 4 | 5 |
Illness benefit is a scheme provided by the Department of Employment Affairs and Social Protection to support employees if they cannot work in the short term because they are sick or ill. The majority of illness benefit claims are less than 4 weeks in duration with no payment made for the first six days of illness. Only paid claims are included in the following analysis. The duration of Illness Benefit is capped at two years for new entrants since 2009.
commuters travelling by car
workers who left home for work earlier
working outside of Dublin
as age increased
with people who described their health as poor
female employees, at 103 per 1,000 employees compared with a rate of 55 per 1,000 male employees
employees who said they had a disability
highest for people who worked in Health & Social Work and Public Administration & Defence
lowest for people who were managers, senior officials and professionals
below average among higher earners
About this releaseThis CSO release examines commuting and employment data for people who received illness or injury benefits (see Infographic) and is an example of the policy-relevant research projects the CSO are developing as part of their leadership role of the Irish Statistical System. Our goal is to maximise the variety and volume of data available, to provide high quality information to government, businesses and citizens.
Long commuting times can have significant impacts on work-life balance, well-being, and stress levels and can indirectly impact on people’s ability to manage their own health and well-being. Commuting can have a detrimental effect on health levels if the individual is, for example, using a car instead of walking, and where exposure to pollution is increased by commuting. Also, findings from the Healthy Ireland Survey, Irish Sports Monitor and other research shows that one of the most common reasons cited for not meeting the National Physical Activity Guidelines is lack of time. Following discussions with the Department of Health, the CSO agreed to explore the potential of linking Department of Employment Affairs and Social Protection illness benefit claims with data from Census 2016 to provide information on any potential correlation between commuting patterns and illness benefit claims. The analysis looks at employees who made a claim for illness benefit in the 12 months following Census night (24 April 2016). An illness benefit claim was made by 110,371 employees in this period, with 20,896 employees making multiple illness benefit claims and 12,148 employees making an illness benefit claim of six months or longer. Over this time period, an occupational injury benefit claim was made by 7,575 employees, (see Background Notes for more details). While the insights obtained here only relate to commuting patterns at the time of Census 2016, it demonstrates the possibilities for analysis if Eircodes were more widely collected in public sector datasets. A previous CSO publication on Measuring Distance to Everyday Services in Ireland 2019 demonstrated the potential value of Eircodes in relation to access to services also using Census location data. In using the increasingly-varied sources of data available, the CSO must ensure that we continue to protect and secure data. Our aim is to ensure that citizens can live in an informed society while at the same time ensuring adherence to all relevant data protection legislation. |
Illness benefit was more common as age increased. For workers under 25 years, the rate was 35 per 1,000 employees, compared with 94 per 1,000 employees among workers aged 45-64. See Table 1.
People who described their health as poor were more likely to claim illness benefit. The rate was 196 per 1,000 employees for those with bad health and 162 per 1,000 employees for those with very bad health, compared to just 68 per 1,000 employees for workers with very good health. See Table 2.
Employees with a disability in Census 2016 had an illness benefit rate of 129 per 1,000 employees, higher than the average rate of 80 per 1,000 employees.
Workers who had a ‘difficulty that limits basic physical activities such as walking, climbing stairs, reaching, lifting or carrying’ had the highest illness benefit rate of 177 per 1,000 employees. Workers with an intellectual disability had the lowest rate of illness benefit, at 50 per 1,000 employees, well below the average rate of 80 per 1,000 employees. Workers with long term disabilities may be in receipt of other Department of Employment Afairs and Social Protection benefits such as disability allowance rather than illness benefit. See Table 2.
The illness benefit rate was higher than average, at 100 per 1,000 employees, for those who were carers providing unpaid assistance. See Table 2.
The average rate of illness benefit among employees who commuted to work was 82 per 1,000 employees, slightly higher than the rate of 80 for all employees. See Table 3.
Illness benefit rates were above average for those who left for work before 8.00am, with the highest rate of 101 per 1,000 employees for those who left before 6.30am. The rate of illness benefit falls for those who left for work up to 9.30am. Workers who started their commute after 9.30am had a rate of 78 per 1,000 employees, close to the average of 80. See Figure 2 and Table 3.
Long-term illness benefit rates were above average among those who departed for work later (after 9.00am), which included those on irregular hours and shift work.
For injury benefit, the highest rate was 12 per 1,000 employees for workers who started their commute before 6.30am, compared with the average rate of 5 per 1,000 employees. Commuters who left between 6.30am and 7.30am and after 9.30am also had rates above the average.
| Time of Departure for Work | Illness benefit | Multiple illness benefit | Long-term illness benefit | Injury benefit |
|---|---|---|---|---|
| Before 06:30 | 101 | 20 | 10 | 12 |
| 06:30 - 07:00 | 94 | 18 | 9 | 8 |
| 07:01 - 07:30 | 90 | 18 | 8 | 6 |
| 07:31 - 08:00 | 81 | 16 | 8 | 4 |
| 08:01 - 08:30 | 75 | 14 | 7 | 3 |
| 08:31 - 09:00 | 73 | 13 | 8 | 2 |
| 09:01 - 09:30 | 69 | 12 | 10 | 3 |
| After 09:30 | 78 | 14 | 11 | 6 |
The illness benefit rate was above average for those who commuted by driving or were a passenger in a car, at 91 and 86 per 1,000 employees respectively. All other modes of commuting had lower than average rates of illness benefit, with the lowest rates for those who cycled (44 per 1,000 employees) or took the Train, DART, or Luas (54 per 1,000 employees). See Figure 3 and Table 3.
The injury benefit rate was highest at 10 per 1,000 employees for those who commuted by motorcycle or scooter, followed by those who commuted by other modes, including lorry or van. Car passengers and cyclists also had higher rates but those who commuted by train, DART or Luas had the lowest rate of 2 per 1,000 employees.
| Means of Travel to Work | Illness benefit | Multiple illness benefit | Long-term illness benefit | Injury benefit |
|---|---|---|---|---|
| On foot | 63 | 11 | 8 | 4 |
| Bicycle | 44 | 7 | 4 | 6 |
| Bus, minibus or coach | 69 | 15 | 8 | 4 |
| Train, DART or Luas | 54 | 13 | 4 | 2 |
| Motor cycle or scooter | 78 | 14 | 8 | 10 |
| Driving a car | 91 | 17 | 9 | 5 |
| Passenger in a car | 86 | 17 | 11 | 7 |
| Van | 59 | 9 | 7 | 8 |
| Other, including lorry | 70 | 10 | 11 | 10 |
The illness benefit rate was just above the average for all journey times to work which took up to one hour and was lowest for those with a commuting time of more than 1.5 hours. See Figure 4 and Table 3.
| Time Taken to Travel to Work | Illness benefit | Multiple illness benefit | Long-term illness benefit | Injury benefit |
|---|---|---|---|---|
| < ¼ hour | 84 | 15 | 10 | 5 |
| ¼ hour - < ½ hour | 85 | 16 | 9 | 6 |
| ½ hour - < ¾ hour | 82 | 16 | 8 | 5 |
| ¾ hour - < 1 hour | 80 | 16 | 7 | 4 |
| 1 hour - < 1½ hours | 75 | 15 | 7 | 5 |
| 1½ hours and over | 72 | 15 | 7 | 5 |
The illness benefit rate among commuters travelling to Dublin was below average at 70 per 1,000 employees. Commuters travelling to cities other than Dublin had the highest illness benefit rate of 95 per 1,000 employees. See Table 3.
Four occupational groups had below average illness benefit rates: Managers, Directors & Senior Officials, Professional, Associate Professional & Technical and Skilled Trades. See Figure 5 and Table 4.
The highest rates of illness benefit with over 100 per 1,000 employees were from the occupations of Caring, Leisure & Other Service Occupations and Process, Plant & Machine Operatives.
The highest rates of people with multiple illness benefit claims were in the occupations of Caring, Leisure & Other Service Occupations and Administrative & Secretarial Occupations.
For injury benefit, the highest rates were for Process, Plant & Machine Operatives at 12 per 1,000, followed by Elementary Occupations at 9 per 1,000 employees, both well above the average rate of 5 per 1,000 employees.
| Broad Occupational Group | Illness benefit | Multiple illness benefit | Long-term illness benefit | Injury benefit |
|---|---|---|---|---|
| Managers, directors and senior officials | 52 | 8 | 7 | 2 |
| Professional occupations | 69 | 13 | 4 | 2 |
| Associate professional and technical occupations | 62 | 13 | 6 | 4 |
| Administrative and secretarial occupations | 97 | 23 | 9 | 2 |
| Skilled trades occupations | 61 | 9 | 8 | 8 |
| Caring, leisure and other service occupations | 117 | 24 | 14 | 8 |
| Sales and customer service occupations | 87 | 15 | 13 | 5 |
| Process, plant and machine operatives | 102 | 19 | 12 | 12 |
| Elementary occupations | 83 | 14 | 13 | 9 |
At over 130 per 1,000 employees the Human Health & Social Work and Public Administration & Defence sectors had the highest illness benefit rates. Transportation & Storage was the only other sector with above average rates. Industry, at a rate of 80 per 1,000 employees was exactly on the average for illness benefits. See Figure 6 and Table 4.
Information & Communication, Construction, and Professional, Scientific & Technical Activities had the lowest rates at 40 or lower per 1,000 employees.
Public Administration & Defence had the highest multiple illness benefit rate followed by Human Health & Social Work.
The sectoral pattern was different for long-term illness benefit recipients. Economic sectors which include irregular hours or shift work had above average rates of long-term illness benefit, with Human Health & Social Work, Wholesale & Retail Trade, and Accommodation & Food Service having the highest rates.
At 13 per 1,000 employees, Transportation & Storage had the highest rate of injury benefit followed by Public Administration & Defence and Agriculture, Forestry & Fishing. Information & Communication, Financial, Insurance & Real Estate, Professional, Scientific & Technical and Education had the lowest rates of injury benefit.
| NACE Economic Sector | Illness benefit | Multiple illness benefit | Long-term illness benefit | Injury benefit |
|---|---|---|---|---|
| Agriculture, forestry and fishing | 52 | 7 | 8 | 8 |
| Industry | 80 | 14 | 9 | 6 |
| Construction | 40 | 5 | 7 | 6 |
| Wholesale and retail trade; repair of motor vechicles | 74 | 12 | 11 | 6 |
| Transportation and storage | 90 | 16 | 10 | 13 |
| Accommodation and food service activities | 60 | 9 | 11 | 5 |
| Information and communication activities | 38 | 7 | 4 | 1 |
| Financial, insurance and real estate activities | 79 | 17 | 7 | 2 |
| Professional, scientific and technical activities | 40 | 6 | 5 | 2 |
| Administrative and support service activities | 61 | 10 | 10 | 6 |
| Public administration and defence; compulsory social security | 132 | 38 | 7 | 9 |
| Education | 77 | 13 | 6 | 2 |
| Human health and social work activities | 132 | 28 | 12 | 7 |
| Arts, entertainment and recreation | 54 | 9 | 7 | 3 |
| Other | 68 | 11 | 11 | 3 |
The occupations and economic sectors of workers who received illness benefit is reflected in the earnings data, with below average illness benefit rates among higher earners. The rate of illness benefit is above the average of 80 per 1,000 employees for all annual earnings up to €60,000, with the highest rate of 103 per 1,000 employees for those earning between €30,000 and €50,000. Workers earning more than €70,000 a year had the lowest illness benefit rate of 43 per 1,000 employees. See Figure 7 and Table 4.
| Gross pay | Illness benefit |
|---|---|
| €10,000-€19,999 | 81 |
| €20,000-€29,999 | 91 |
| €30,000-€39,999 | 103 |
| €40,000-€49,999 | 103 |
| €50,000-€59,999 | 97 |
| €60,000-€69,999 | 75 |
| €70,000 and above | 43 |
| Table 1 Demographic profile of illness benefit recipients, multiple and long-term illness benefit recipients and injury benefit recipients, 2016 | |||||
| per 1,000 employees | |||||
| Illness Benefit Recipients1 | Multiple Illness Benefit Recipients2 | Long-term illness Benefit Recipients3 | Injury Benefit Recipients4 | ||
| Sex | |||||
| Male | 55 | 9 | 7 | 7 | |
| Female | 103 | 21 | 11 | 4 | |
| Total | 80 | 15 | 9 | 5 | |
| Age | |||||
| 15-24 years | 35 | 6 | 3 | 5 | |
| 25-44 years | 77 | 15 | 7 | 5 | |
| 45-64 years | 94 | 17 | 14 | 6 | |
| Region of Usual Residence | |||||
| Border | 86 | 16 | 10 | 5 | |
| West | 88 | 17 | 9 | 5 | |
| Mid-West | 88 | 16 | 10 | 6 | |
| South-East | 84 | 15 | 10 | 5 | |
| South-West | 86 | 15 | 10 | 5 | |
| Dublin | 66 | 14 | 7 | 5 | |
| Mid-East | 80 | 15 | 9 | 6 | |
| Midlands | 93 | 18 | 11 | 6 | |
| Highest Level of Education5 | |||||
| No formal education or primary education only | 105 | 18 | 22 | 9 | |
| Secondary education | 89 | 17 | 12 | 7 | |
| Technical, vocational, completed apprenticeship, advanced or higher certificate | 88 | 17 | 10 | 7 | |
| Ordinary or higher bachelor degree, professional qualification or both | 70 | 14 | 5 | 3 | |
| Postgraduate diploma, degree or doctorate | 62 | 11 | 4 | 2 | |
| Socio-Economic Group | |||||
| Employers and managers | 51 | 9 | 6 | 2 | |
| Higher professional | 45 | 8 | 3 | 1 | |
| Lower professional | 90 | 18 | 6 | 3 | |
| Non-manual | 90 | 18 | 10 | 5 | |
| Manual skilled | 67 | 10 | 9 | 11 | |
| Semi-skilled | 108 | 21 | 13 | 10 | |
| Unskilled | 84 | 14 | 14 | 10 | |
| Farmers and agricultural workers | 58 | 9 | 9 | 9 | |
| All others gainfully occupied and unknown | 71 | 14 | 11 | 7 | |
| 1 Employees (usually resident, aged 15-64 years, economic status ‘at work’, employment status ‘employee’ and in PRSI Class A, E, H or P) who made a claim for Illness Benefit in the 12-month period between 25 April 2016 and 24 April 2017 and received at least one weekly payment. | |||||
| 2 Employees who made more than one claim for Illness Benefit in the 12-month period between 25 April 2016 and 24 April 2017 and received at least one weekly payment. | |||||
| 3 Employees who made a claim for Illness Benefit in the 12-month period between 25 April 2016 and 24 April 2017, which lasted for 6 months or longer. | |||||
| 4 Employees (usually resident, aged 15-64 years, 'at work', 'employee' and in PRSI Class A, D or J) who made a claim for Injury Benefit in the 12-month period 25 April 2016 to 24 April 2017 and received at least one weekly payment. | |||||
| 5 Persons whose full-time education has ceased. | |||||
| Table 2 Health, disability and carers among illness benefit recipients, multiple and long-term illness benefit recipients and injury benefit recipients, 2016 | |||||
| per 1,000 employees | |||||
| Illness Benefit Recipients1 | Multiple Illness Benefit Recipients2 | Long-term illness Benefit Recipients3 | Injury Benefit Recipients4 | ||
| General Health | |||||
| Very Good | 68 | 12 | 6 | 4 | |
| Good | 96 | 19 | 12 | 7 | |
| Fair | 144 | 35 | 28 | 9 | |
| Bad | 196 | 55 | 48 | 6 | |
| Very Bad | 162 | 47 | 34 | … | |
| Disability5 | |||||
| All Disabilities | 129 | 30 | 22 | 7 | |
| Type of Disability | |||||
| Blindness or vision impairment | 98 | 21 | 13 | 6 | |
| Deafness or a serious hearing impairment | 110 | 23 | 16 | 7 | |
| An intellectual disability | 50 | 10 | 9 | 3 | |
| A difficulty with learning, remembering or concentrating | 84 | 19 | 16 | 8 | |
| A difficulty with basic physical activities | 177 | 41 | 41 | 10 | |
| Other disability including chronic illness | 148 | 37 | 25 | 8 | |
| A psychological or emotional condition | 140 | 39 | 26 | 6 | |
| Carers | |||||
| Providing unpaid assistance | 100 | 20 | 11 | 7 | |
| Carer Hours per Week | |||||
| 1-14 hours unpaid help per week | 96 | 19 | 10 | 5 | |
| 15-42 hours unpaid help per week | 107 | 22 | 14 | 7 | |
| 43 hours or more unpaid help per week | 103 | 23 | 9 | 6 | |
| 1 Employees (usually resident, aged 15-64 years, economic status ‘at work’, employment status ‘employee’ and in PRSI Class A, E, H or P) who made a claim for Illness Benefit in the 12-month period between 25 April 2016 and 24 April 2017 and received at least one weekly payment. | |||||
| 2 Employees who made more than one claim for Illness Benefit in the 12-month period between 25 April 2016 and 24 April 2017 and received at least one weekly payment. | |||||
| 3 Employees who made a claim for Illness Benefit in the 12-month period between 25 April 2016 and 24 April 2017, which lasted for 6 months or longer. | |||||
| 4 Employees (usually resident, aged 15-64 years, 'at work', 'employee' and in PRSI Class A, D or J) who made a claim for Injury Benefit in the 12-month period 25 April 2016 to 24 April 2017 and received at least one weekly payment. | |||||
| 5 For the purpose of this report a disabled person has been classified as someone who responded 'yes' to any of the seven categories in question 16 of the Census on long-lasting conditions or 'yes' to any of the four categories in question 17 on difficulties. | |||||
| Table 3 Profile of commuting behaviour of illness benefit recipient commuters, multiple and long-term illness benefit recipient commuters and injury benefit commuters, 2016 | |||||
| per 1,000 employees | |||||
| Illness Benefit Recipient Commuters1 | Multiple illness Benefit Recipient Commuters2 | Long-tern illness Benefit Recipient Commuters3 | Injury Benefit Recipient Commuters4 | ||
| Means of Travel to Work | |||||
| On foot | 63 | 11 | 8 | 4 | |
| Bicycle | 44 | 7 | 4 | 6 | |
| Bus, minibus or coach | 69 | 15 | 8 | 4 | |
| Train, DART or Luas | 54 | 13 | 4 | 2 | |
| Motor cycle or scooter | 78 | 14 | 8 | 10 | |
| Driving a car | 91 | 17 | 9 | 5 | |
| Passenger in a car | 86 | 17 | 11 | 7 | |
| Van | 59 | 9 | 7 | 8 | |
| Other, including lorry | 70 | 10 | 11 | 10 | |
| Total | 82 | 16 | 9 | 5 | |
| Time of Departure for Work | |||||
| Before 06:30 | 101 | 20 | 10 | 12 | |
| 06:30 - 07:00 | 94 | 18 | 9 | 8 | |
| 07:01 - 07:30 | 90 | 18 | 8 | 6 | |
| 07:31 - 08:00 | 81 | 16 | 8 | 4 | |
| 08:01 - 08:30 | 75 | 14 | 7 | 3 | |
| 08:31 - 09:00 | 73 | 13 | 8 | 2 | |
| 09:01 - 09:30 | 69 | 12 | 10 | 3 | |
| After 09:30 | 78 | 14 | 11 | 6 | |
| Time Taken to Travel to Work | |||||
| < ¼ hour | 84 | 15 | 10 | 5 | |
| ¼ hour - < ½ hour | 85 | 16 | 9 | 6 | |
| ½ hour - < ¾ hour | 82 | 16 | 8 | 5 | |
| ¾ hour - < 1 hour | 80 | 16 | 7 | 4 | |
| 1 hour - < 1½ hours | 75 | 15 | 7 | 5 | |
| 1½ hours and over | 72 | 15 | 7 | 5 | |
| Work Destination | |||||
| Dublin | 70 | 15 | 7 | 5 | |
| City other than Dublin | 95 | 18 | 10 | 5 | |
| Rest of Ireland | 89 | 16 | 10 | 6 | |
| 1 Employees (usually resident, aged 15-64 years, economic status ‘at work’, employment status ‘employee’, in PRSI Class A, E, H or P and provided valid commuting data in Census 2016) who made a claim for Illness Benefit in the 12-month period between 25 April 2016 and 24 April 2017 and received at least one weekly payment. | |||||
| 2 Employees who made more than one claim for Illness Benefit in the 12-month period between 25 April 2016 and 24 April 2017, received at least one weekly payment and provided valid commuting data in Census 2016. | |||||
| 3 Employees who made a claim for Illness Benefit in the 12-month period between 25 April 2016 and 24 April 2017, which lasted for 6 months or longer and provided valid commuting data in Census 2016. | |||||
| 4 Employees (usually resident, aged 15-64 years, 'at work', 'employee', in PRSI Class A, D or J and provided valid commuting data in Census 2016) who made a claim for Injury Benefit in the 12-month period 25 April 2016 to 24 April 2017 and received at least one weekly payment. | |||||
| Table 4 Labour market profile of illness benefit recipients, multiple and long-term illness benefit recipients and injury benefit recipients, 2016 | |||||
| per 1,000 employees | |||||
| Illness Benefit Recipients1 | Multiple illness Benefit Recipients2 | Long-term illness Benefit Recipients3 | Injury Benefit Recipients4 | ||
| Broad Occupational Group | |||||
| Managers, directors and senior officials | 52 | 8 | 7 | 2 | |
| Professional occupations | 69 | 13 | 4 | 2 | |
| Associate professional and technical occupations | 62 | 13 | 6 | 4 | |
| Administrative and secretarial occupations | 97 | 23 | 9 | 2 | |
| Skilled trades occupations | 61 | 9 | 8 | 8 | |
| Caring, leisure and other service occupations | 117 | 24 | 14 | 8 | |
| Sales and customer service occupations | 87 | 15 | 13 | 5 | |
| Process, plant and machine operatives | 102 | 19 | 12 | 12 | |
| Elementary occupations | 83 | 14 | 13 | 9 | |
| NACE Economic Sector5 | |||||
| Agriculture, forestry and fishing | 52 | 7 | 8 | 8 | |
| Industry | 80 | 14 | 9 | 6 | |
| Construction | 40 | 5 | 7 | 6 | |
| Wholesale and retail trade; repair of motor vehicles | 74 | 12 | 11 | 6 | |
| Transportation and storage | 90 | 16 | 10 | 13 | |
| Accommodation and food service activities | 60 | 9 | 11 | 5 | |
| Information and communication activities | 38 | 7 | 4 | 1 | |
| Financial, insurance and real estate activities | 79 | 17 | 7 | 2 | |
| Professional, scientific and technical activities | 40 | 6 | 5 | 2 | |
| Administrative and support service activities | 61 | 10 | 10 | 6 | |
| Public administration and defence; compulsory social security | 132 | 38 | 7 | 9 | |
| Education | 77 | 13 | 6 | 2 | |
| Human health and social work activities | 132 | 28 | 12 | 7 | |
| Arts, entertainment and recreation | 54 | 9 | 7 | 3 | |
| Other | 68 | 11 | 11 | 3 | |
| Gross Pay (2015)6 | |||||
| €10,000-€19,999 | 81 | 14 | 14 | 6 | |
| €20,000-€29,999 | 91 | 17 | 10 | 7 | |
| €30,000-€39,999 | 103 | 22 | 8 | 7 | |
| €40,000-€49,999 | 103 | 21 | 7 | 6 | |
| €50,000-€59,999 | 97 | 19 | 6 | 6 | |
| €60,000-€69,999 | 75 | 14 | 4 | 5 | |
| €70,000 and above | 43 | 7 | 4 | 2 | |
| 1 Employees (usually resident, aged 15-64 years, economic status ‘at work’, employment status ‘employee’ and in PRSI Class A, E, H or P) who made a claim for Illness Benefit in the 12-month period between 25 April 2016 and 24 April 2017 and received at least one weekly payment. | |||||
| 2 Employees who made more than one claim for Illness Benefit in the 12-month period between 25 April 2016 and 24 April 2017 and received at least one weekly payment. | |||||
| 3 Employees who made a claim for Illness Benefit in the 12-month period between 25 April 2016 and 24 April 2017, which lasted for 6 months or longer. | |||||
| 4 Employees (usually resident, aged 15-64 years, 'at work', 'employee' and in PRSI Class A, D or J) who made a claim for Injury Benefit in the 12-month period 25 April 2016 to 24 April 2017 and received at least one weekly payment. | |||||
| 5 The sector of economic activity that a person works in, based on NACE, the general industrial classification of economic activities used within the EU. The current version is NACE Rev. 2. | |||||
| 6 Gross Pay (for USC purposes) is gross pay before deductions of any kind, and should include the notional value of any benefit-in-kind. Gross pay for 2015 is used as an Illness Benefit recipient's gross pay in 2016 or 2017 would be influenced by their time in receipt of Illness Benefit. | |||||
This release presents statistics on the employment and commuting characteristics of people in receipt of illness benefit and injury benefit over the period April 2016 to April 2017, based on a combination of administrative data sources and Census 2016 data. Analysis is limited to persons who made a claim and also received at least one weekly payment of illness benefit from the Department of Employment Affairs and Social Protection.
Illness benefit is a scheme to support an employee if they cannot work in the short term because they are sick or ill. Details of the illness benefit scheme can be found at the following link; https://www.gov.ie/en/service/ddf6e3-illness-benefit/
An employee is deemed to have multiple illness benefits if they had more than one illness benefit claim during the period of analysis.
An employee is deemed to be in receipt of long-term illness benefit if their illness benefit claim lasted for six months or longer.
The Occupational Injuries Scheme provides benefits for people injured or incapacitated by an accident at work or while travelling directly to or from work. The scheme also covers people who have contracted a disease as a result of the type of work they do. This research analyses injury benefit only from the Occupational Injuries Scheme.
The results presented in this release are based on a data-matching exercise of the following administrative data sources:
The linkage and analysis was undertaken by the CSO for statistical purposes in line with the Statistics Act, 1993 and the CSO Data Protocol.
Before using personal administrative data for statistical purposes, the CSO removes all identifying personal information, including the Personal Public Service Number (PPSN). The PPSN is a unique number that enables individuals to access social welfare benefits, personal taxation and other public services in Ireland. The CSO converts the PPSN to a Protected Identifier Key (PIK). The PIK is a unique and non-identifiable number which is internal to the CSO. Using the PIK enables the CSO to link and analyse data for statistical purposes, while protecting the security and confidentiality of an individual's data. PIR, CRS and CSO records were linked using the PIK for this project. All records in the datasets are anonymised and the results are in the form of statistical aggregates which do not identify any individuals.
Person Income Register (PIR)
The PIR is a pseudonymised income register held internally within the CSO. It contains information on income received by individuals relating to employment, self-employment and social transfers. It is derived from administrative holdings held by the Revenue Commissioners and Department of Employment Affairs and Social Protection. Therefore, the PIR provides a near complete picture on individual-level income, for a calendar year. All linkage is carried out using a PIK assigned on each contributing data source. The PIK is then used to link the pseudonymised data sources together to create the PIR. The PIK protects a person’s identity but also enables linking across data sources and over time. The PIK enables high quality deterministic matching thus significantly reducing/eliminating linkage error. PIR is valid up to 2018.
Census of Population Analysis (COPA)
The COPA is a pseudonymised copy of the Census of Population 2016 dataset held internally within the CSO for analysis purposes. It contains Census attribute information for individuals and households of which 95% of records have a PIK which allows them to be linked to pseudonymised administrative data sources to create new analysis.
Department of Employment Affairs and Social Protection (DEASP)
The BOMi dataset provides additional payment details of illness benefits. The Central Records System (CRS) of the Department of Employment Affairs and Social Protection provides information on age, gender and family relationships. Using a unique identifier (PIK), each employee in the PIR dataset can be linked to their individual demographic characteristics on the Department of Employment Affairs and Social Protection Datasets.
Persons of working age (15-64 years), usually resident in the Republic of Ireland, with a principal economic status of 'at work', an employment status of 'employee' and in PRSI Class A, E, H or P (eligible classes for Illness Benefit). When examining injury benefit the analysis is limited to those in PRSI Class A, D or J (eligible classes for injury benefit).
|
Target populations |
2016/2017 |
|
Target female population |
708,474 |
|
Target male population |
679,173 |
The economic sector classification (NACE) is based on the ‘Statistical Classification of Economic Activities in the European Community, Rev. 2 (2008)'
https://ec.europa.eu/eurostat/ramon/nomenclatures/index.cfm?TargetUrl=LST_NOM_DTL&StrNom=NACE_REV2
The Occupation classification used here and in Census 2016, is based on the UK Standard Occupational Classification (SOC), with modifications to reflect Irish labour market conditions.
https://www.ons.gov.uk/methodology/classificationsandstandards/standardoccupationalclassificationsoc
In Census 2016, the entire population was classified to one of ten specific socio-economic groups (introduced in 1996). In addition, a residual group entitled. “All others gainfully occupied and unknown” was used where sufficient details were not provided. The classification aimed to bring together persons with similar social and economic statuses on the basis of the level of skill or educational attainment acquired. In defining socio-economic group no attempt is made to rank groups in order of socio-economic importance.
The socio-economic group of persons aged 15 years or over who are at work was determined by their occupation and employment status. Unemployed or retired persons aged 15 years or over are classified according to their former occupation and employment status.
Persons looking after the home/family or at school/ college, who were members of a family unit, were classified to the socio-economic group of another person in the family unit using a priority table based on the relationships within the family. Thus, if the reference person1 of a family was at work, unemployed or retired, other persons were assigned to his/her socio-economic group. If the reference person was neither at work, unemployed nor retired, they were assigned to the socio-economic group of the other parent, spouse or cohabiting partner in the family unit. If there was no such spouse or partner or if the spouse, in turn, was neither at work, unemployed or retired, they were assigned to the socio-economic group of a working son/daughter. If there were no persons in the family unit with a socio-economic group, then they were assigned to the unknown socio-economic group. Other persons looking after the home/family or at school/college who were not members of a family unit, such as relatives of the reference person (e.g. widowed grandparents, etc.) were assigned a socio-economic group using the above method. Unrelated persons or persons living alone who are looking after the home/family or at school/college were assigned to the unknown group.
The socio-economic groups used in the census are as follows:
A Employers and managers
B Higher professional
C Lower professional
D Non-manual
E Manual skilled
F Semi-skilled
G Unskilled
H Own account workers
I Farmers
J Agricultural workers
Z All others gainfully occupied and unknown
1The reference person in each private household is the first person identified as a parent, spouse or cohabiting partner in the first family in the household. Where no person in the household satisfies these criteria, the first usually resident person is used as the reference person.
 Hide Background Notes
Scan the QR code below to view this release online or go to
http://www.cso.ie/en/releasesandpublications/er/ibeca/illnessbenefitsemploymentandcommutinganalysis2016-2017/
 Show Table 1 Demographic profile of illness benefit recipients, multiple and long-term illness benefit recipients and injury benefit recipients, 2016
 Hide Table 1 Demographic profile of illness benefit recipients, multiple and long-term illness benefit recipients and injury benefit recipients, 2016